During the reporting period, the summer crops such as maize and rice were harvested, followed by the sowing of winter wheat in November. The CropWatch agro-climatic indicators show that rain and temperature were 99% and 0.5°C above the average, respectively. High rainfall occurred in late October and January. RADPAR, which is the main limiting factor for crop growth in Egypt since almost all crops are irrigated, was 0.4% below the average. The estimated BIOMSS was 14% below the average and VCIx was 0.85. The nationwide NDVI profile shows below-average crop conditions during October and November. Starting in December, conditions improved to average. The NDVI spatial pattern shows that 6.8% of the cultivated area was above the 5YA, 60.3% was below the 5YA, and 32.8% was below the average until the end of December then increased in January. The whole country VCIx value was 0.85 and the CALF exceeded the 5YA by 8%, indicating favorable crop conditions.
Regional Analysis
Egypt can be subdivided into three agro-ecological zones(AEZ) based on cropping systems, climatic zones, and topographic conditions. Only two of them are relevant for crops: 1) the Nile Delta and the Mediterranean coastal strip and 2) the Nile Valley. Rainfall was 121% above the average in the first AEZ and 39% below average in the Nile Valley. Temperatures in both zones were slightly above average and on the contrary, the RADPAR was slightly below average. The estimated BIOMSS was 27% below the average in the Nile Delta and Mediterranean coastal strip and 16% above the average in the Nile Valley. For the Nile Delta and Mediterranean coastal strip, CALF was up by 6% and VCIx at 0.84. In the Nile Valley, CALF was up by 10% and VCIx at 0.95. The NDVI-based crop condition development graphs indicate below-average conditions during October and November, and average starting in December. Since most of the agricultural lands in Egypt are irrigated, the rainfall makes little change in the outcome of the season. However, additional water usually has a beneficial effect. It should be noted that unusually high amounts of rainfall registered during a short period (late of October) may have slightly delayed the sowing of winter wheat. This could explain the reduction of BIOMSS over the Nile Delta and the Mediterranean coastal strip. However, the crops seem to be well on track by the end of January.
Figure3.14. Egypt’s crop condition, October 2019 - January 2020
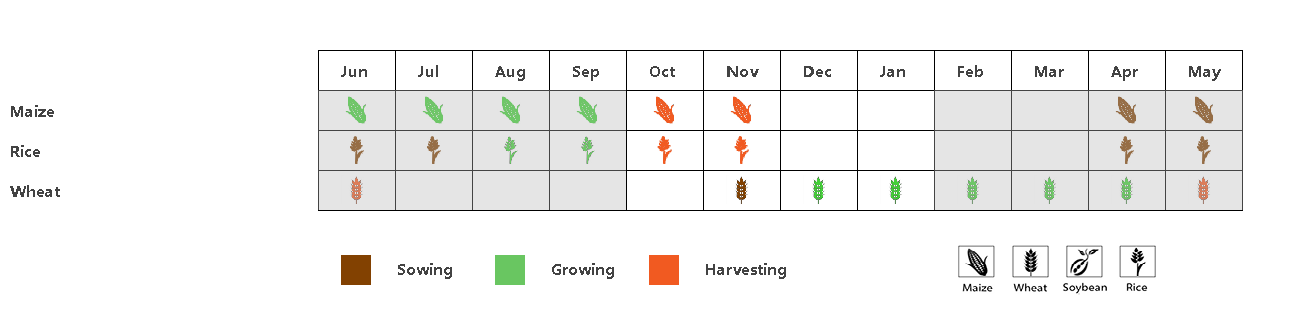
(a). Phenology of major crops
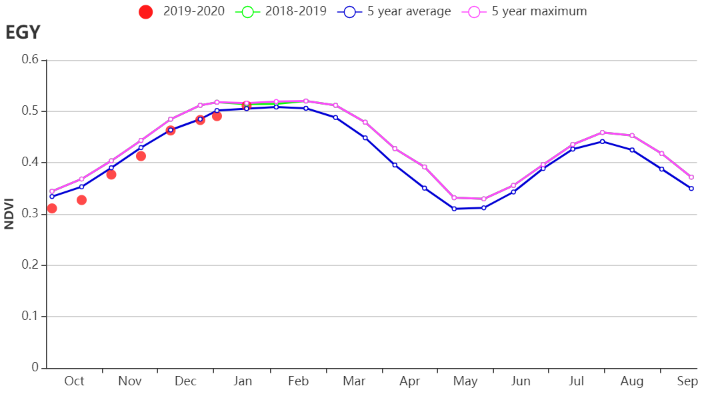
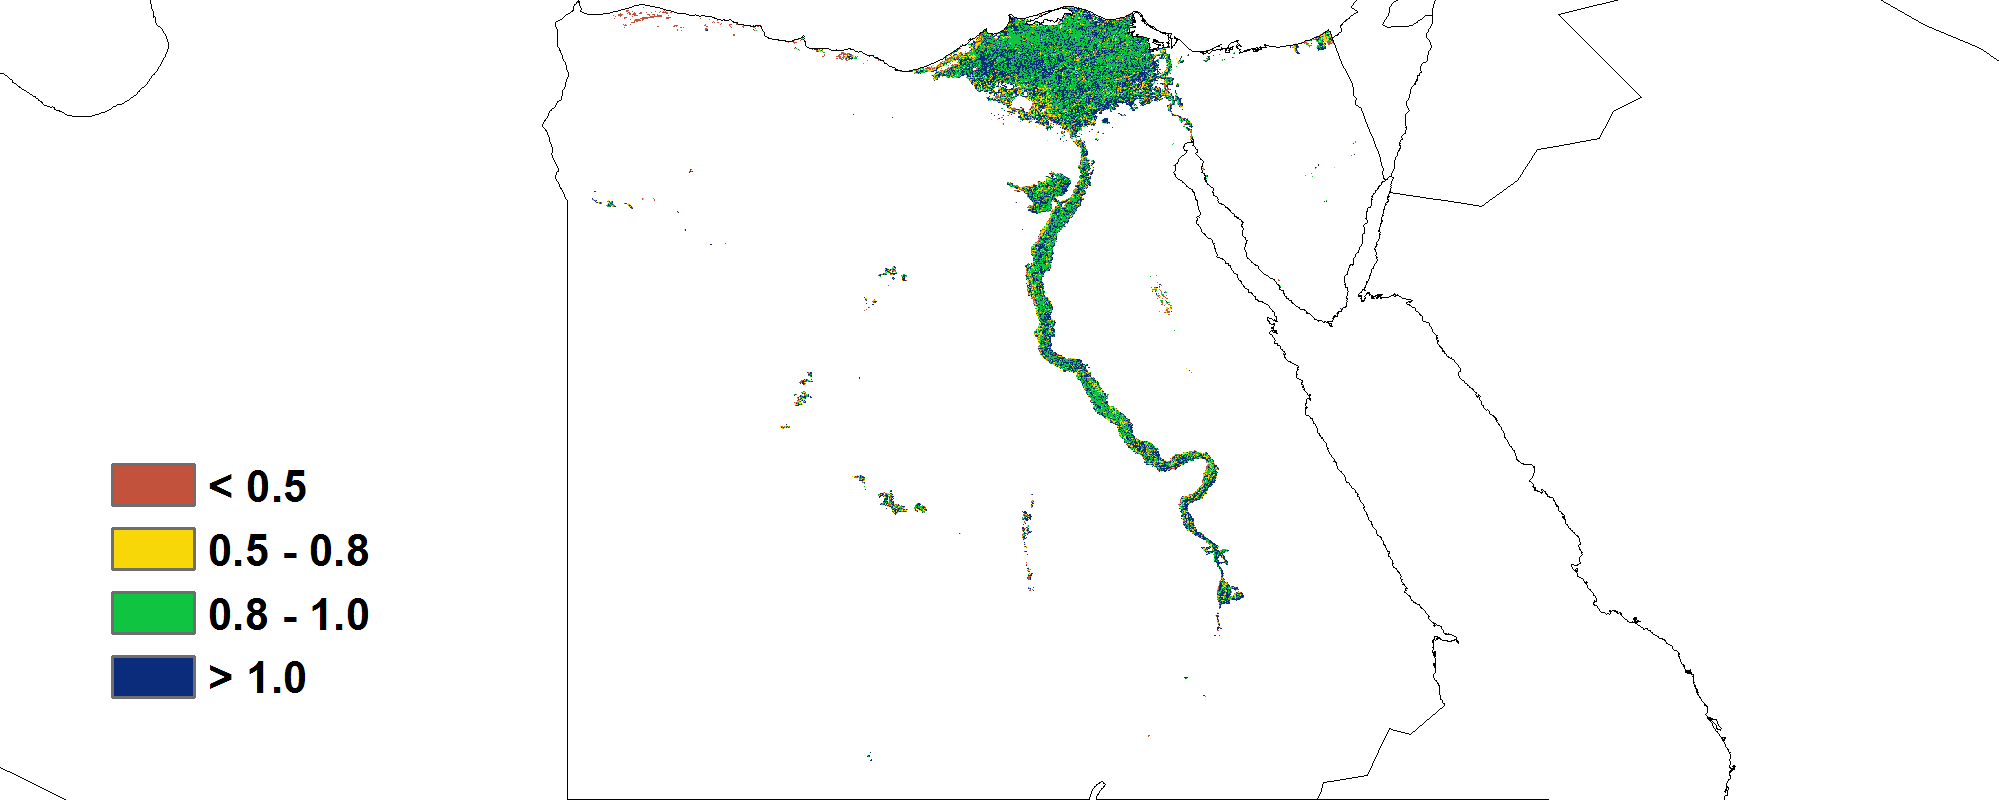
Figure.X (c) Maximum VCI
(b) Crop condition development graph based on NDVI (c) Maximum VCI

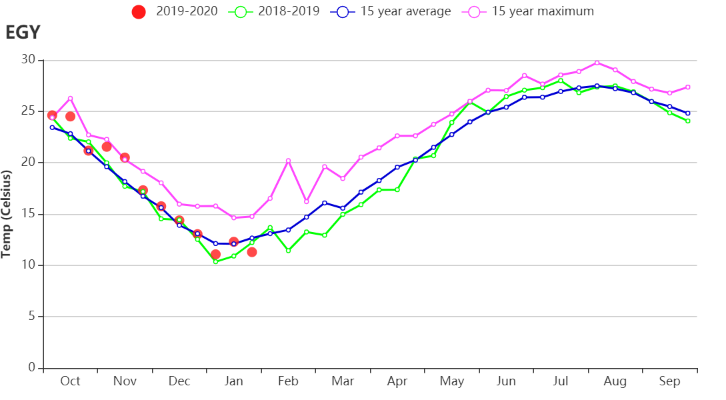
(d) Rainfall Index (e)Temperature Index

(f) Spatial NDVI patterns compared to 5YA (g) NDVI profiles
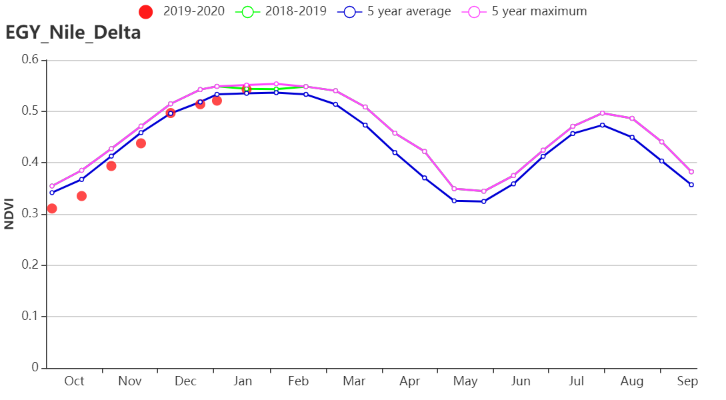
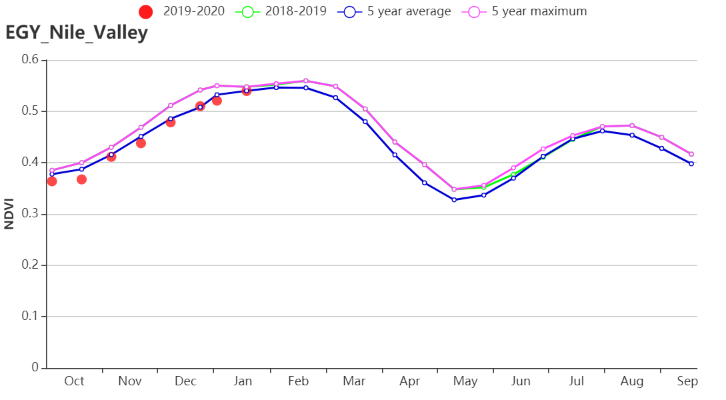
(k) Crop condition development graph based on NDVI (Nile Delta (left) and Nile Valley (right))
Table 3.28. Egypt’s agro-climatic indicators by sub‐national regions, current season's values and departure from15YA, October 2019 - January 2020
| RAIN | TEMP | RADPAR | ||||
| Current | Departure | Current | Departure | Current | Departure | |
| Nile Delta and | 108 | 121 | 17.6 | 0.5 | 756 | -0.5 |
| Nile Valley | 6 | -39 | 17.4 | 0.6 | 881 | -0.4 |
Table 3.29.Egypt’s agronomic indicators by sub‐national regions, current season's values and departure from 15YA, October 2019 - January 2020
| Region | BIOMSS | CALF | Maximum | ||
| Current | Departure | Current | Departure | Current | |
| Nile Delta and | 203 | -27 | 72 | 6 | 0.84 |
| Nile Valley | 128 | 16 | 82 | 10 | 0.95 |