During this reporting period, irrigated wheat was harvested with an estimated national production of 150,000 MT while main field crops were planted following the onset of the rainy season in October/November. The previous seasons resulted in a decline of rainfed cereal production in two consecutive years to below‑average levels, mainly driven by rainfall deficits.
Countrywide the average rainfall was at 962 mm, 12% above the 15 year average, average temperatures at 23.7 °C (+0.1) and solar radiation of 1315 MJ/m2. These conditions resulted in potential biomass production of 786 g DM/m2 (+2%), total cropped land at 98% (+9%) and maximum VCI of 0.89. Delayed onset of the rainfall in October and early November affected crop establishment in some parts of the country. However rainfall returned to average levels thereafter.
Regional Analysis
The three agro-ecological zones (AEZs) indicated that the cumulative rainfall received in all the agro-ecological zones was above the 15 year average (>3%), except for the Luangwa-Zambezi Rift Valleys where the deviation was negative (-1%). Based on the temperature profiles, average temperature for the regions varied from 21.9°C to 25.3°C with negligible departure from 15 year average. Similarly the sunshine radiation for the three agro-ecological zones was above 1200 MJ/m2. These indicators are reflected in positive BIOMSS departures in the Luangwa-Zambezi Rift Valley (+11%) and West-Semiarid zone (+4%) while Northern high rainfall zone (-7%) and Central, eastern and southern plateau (-1%) recorded negative departures.
The Cropped Arable Land Fraction (CALF) was above 98% across all the AEZs except for Luangwa-Zambezi Rift Valley (95%). Similar positive trends were observed for the maximum VCI. The NDVI showed a large negative outlier in January, presumably due to cloud cover. Values for all regions were above average by the end of January. Overall, these agronomic indicators showed more favorable crop conditions as compared to the previous year and hence an expected potential increase for the 2020 cereal harvest.
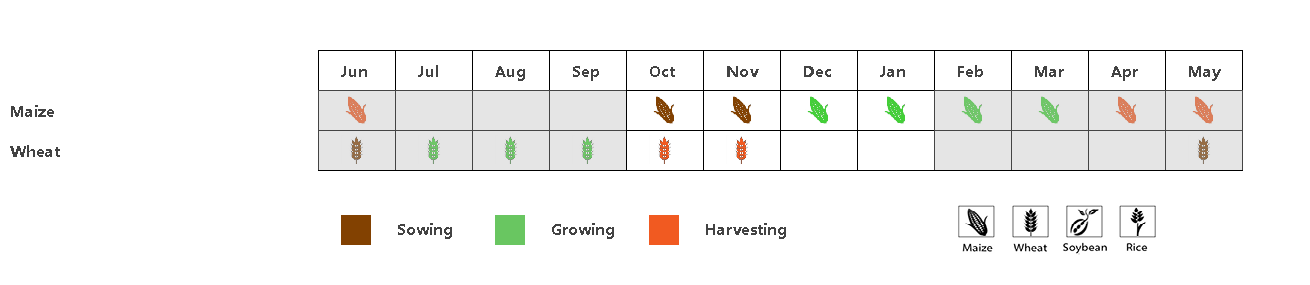
Figure a: Phenology calendar of main crops
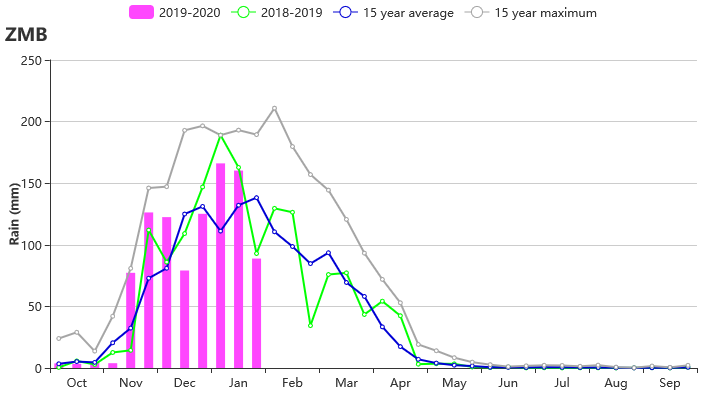
Figure b: Time series rainfall profile
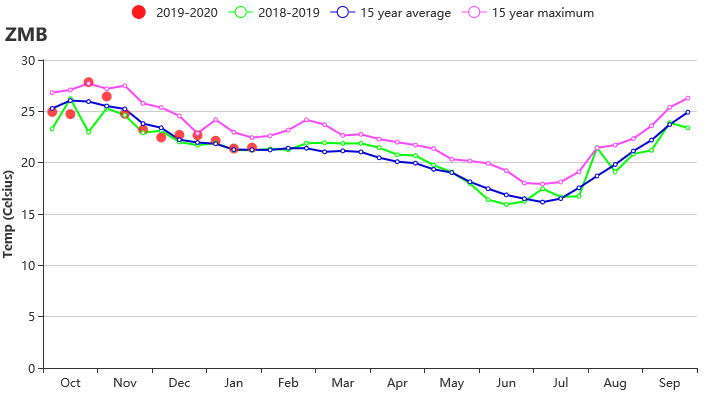
Figure c: Time series temperature profile
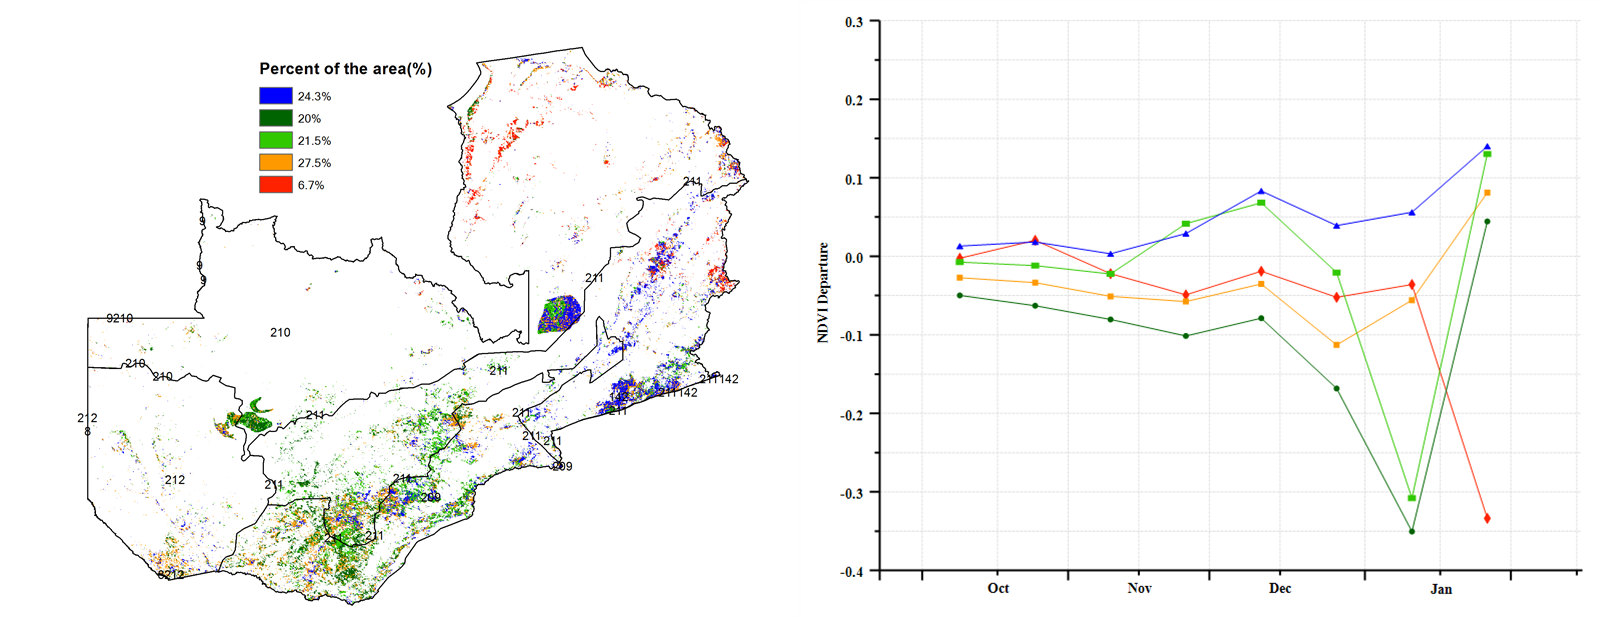
Figure d: Spatial distribution of NDVI profiles
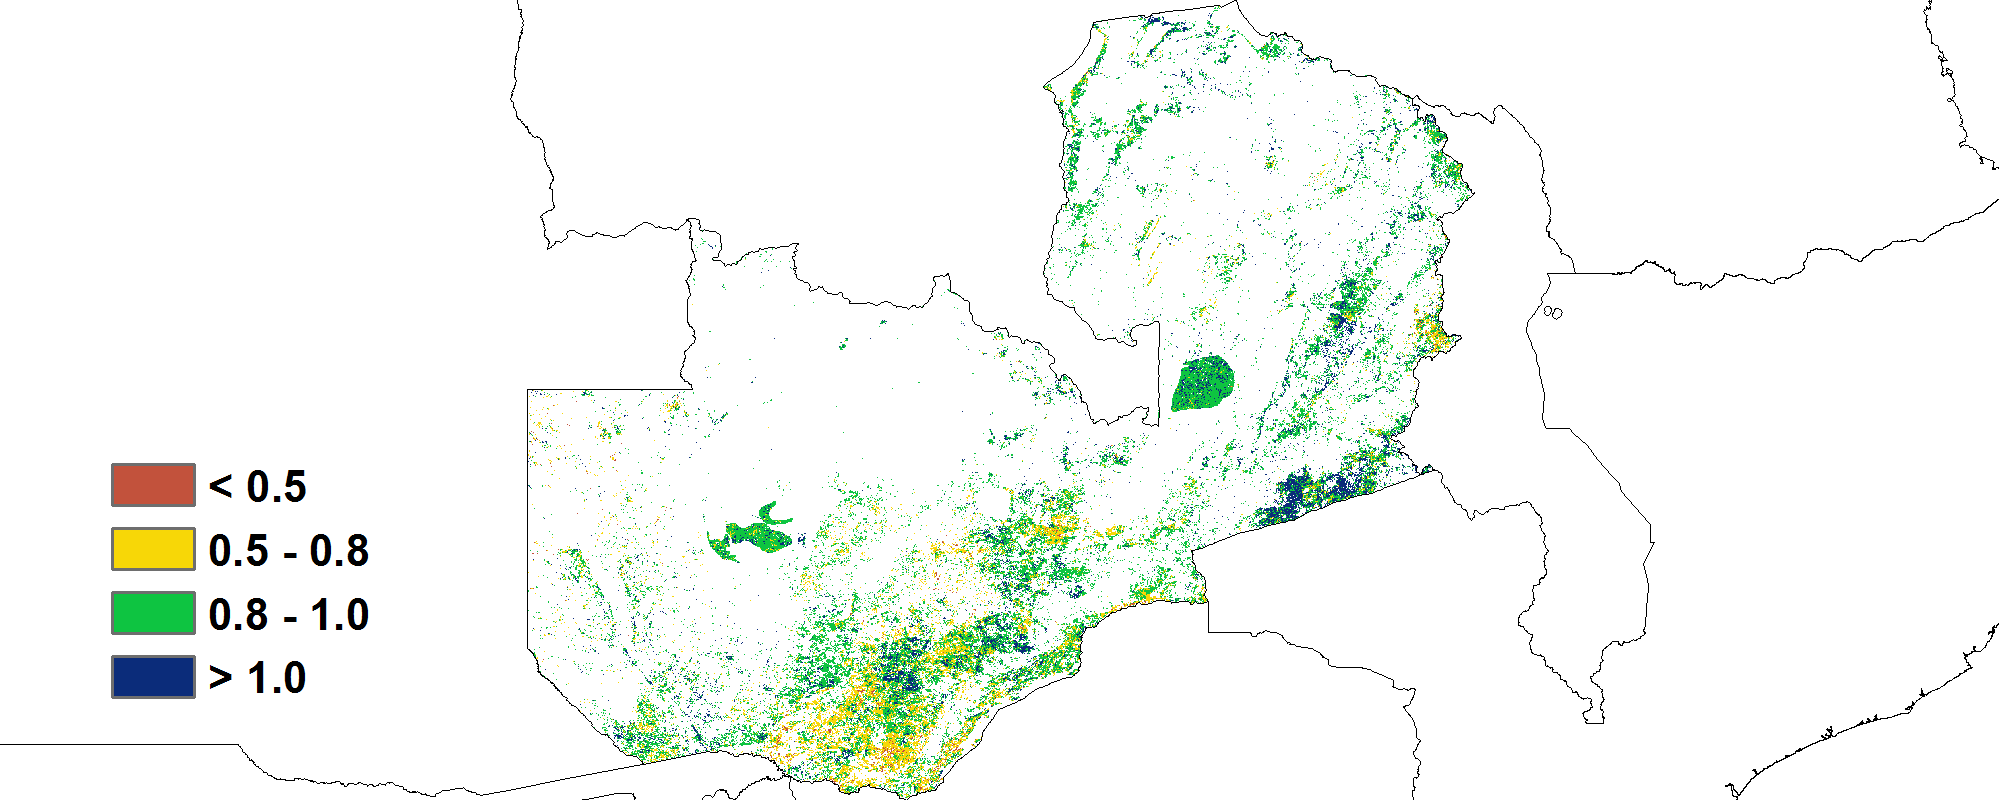
Figure e: Maximum VCI
Table a: Zambia’s agroclimatic indicators by sub-national regions, current season's values and departure from 15YA, October 2019 – January 2020
| RAIN | TEMP | RADPAR | |||
Region | Current (mm) | Departure from 15YA (%) | Current (°C) | Departure from 15YA (°C) | Current (MJ/m2) | Departure from 15YA (%) |
Luangwa- Zambezi rift valley
| 780 | -1 | 25.3 | +0.5 | 1409 | 0 |
Northern high rainfall zone | 1193 | +20 | 21.9 | -0.2 | 1211 | -2 |
Central, eastern and southern plateau | 914 | +14 | 24.0 | +0.1 | 1337 | +1 |
Western semi-arid plain | 811 | +3 | 24.7 | -0.2 | 1310 | -1 |
Table b: Zambia’s agronomic indicators by sub‐national regions, current season's values and departure from 15YA, October 2019 – January 2020
| BIOMSS | CALF | Maximum VCI | ||
Region | Current (gDM/m2) | Departure from 15YA (%) | Current(%) | Departure from 5YA (%) | Current |
Luangwa- Zambezi rift valley | 895 | +11 | 95 | +6 | 0.83 |
Northern high rainfall zone | 683 | -7 | 99 | +1 | 0.93 |
Central, eastern and southern plateau | 760 | -1 | 98 | +17 | 0.91 |
Western semi-arid plain | 852 | +4 | 99 | +2 | 0.90 |