The Project
  • 首页
  • 关于
  • 快报
  • 通报
  • 方法
  • 出版物
  • 联系我们
  • 中文
    • 中文
    • English
    • Português
  • 登录

Update on El Niño Focus and perspectives
作者: 编辑:


Neutral El Nino condition prevails across the Pacific Ocean continuously. Figure 5.5 illustrates the behavior of the standard Southern Oscillation Index (SOI) of the Australian Bureau of Meteorology (BOM) from January 2019 to January 2020 [1]. Sustained positive values of the SOI above +7 typically indicate La Niña while sustained negative values below −7 typically indicate El Niño. Values between about +7 and −7 generally indicate neutral conditions. During this monitoring period, SOI decreased from -5.6 in October to -9.3 in November, then increased gradually to -5.5 in December, further to +1.3 in January, 2020, indicating a neutral El Nino situation. The sea surface temperature anomalies in January 2020 for NINO3, NINO3.4, and NINO4 regions were +0.3°C, +0.5°C, and +0.9°C, respectively,  somewhat warmer than the 1961-1990 average according to BOM (see Figure 5.6-5.7) [2-3]. Both BOM and NOAA conjecture that the warmer condition indicates a neutral El Niño [4]. CropWatch will keep monitoring the situation.

Figure 5.5. Monthly SOI-BOM time series from January 2019 to January 2020 [1]

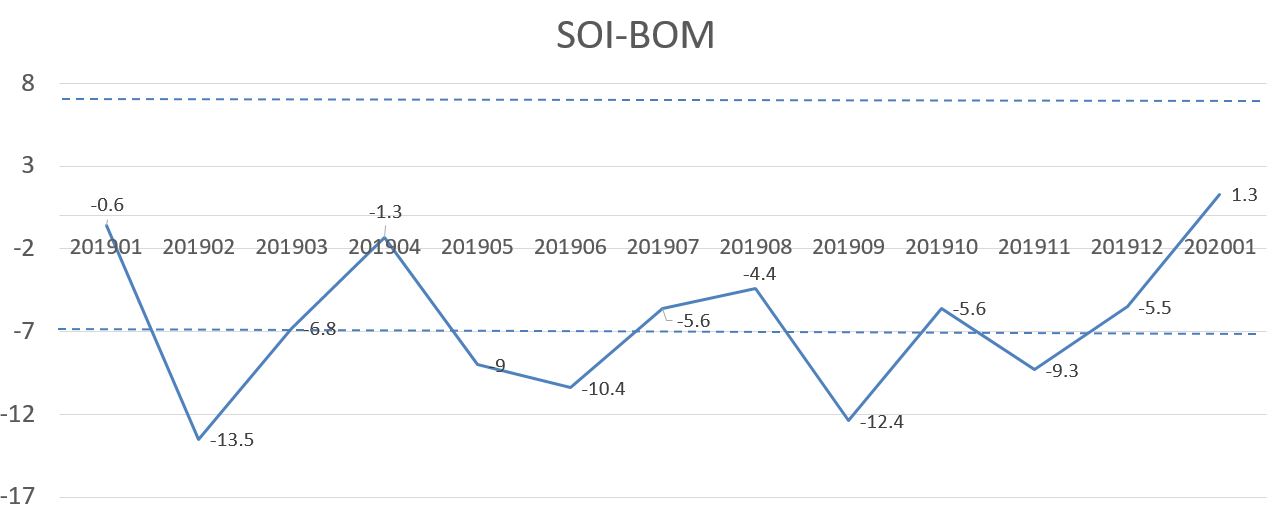
Figure 5.6. Map of NINO Region [2]

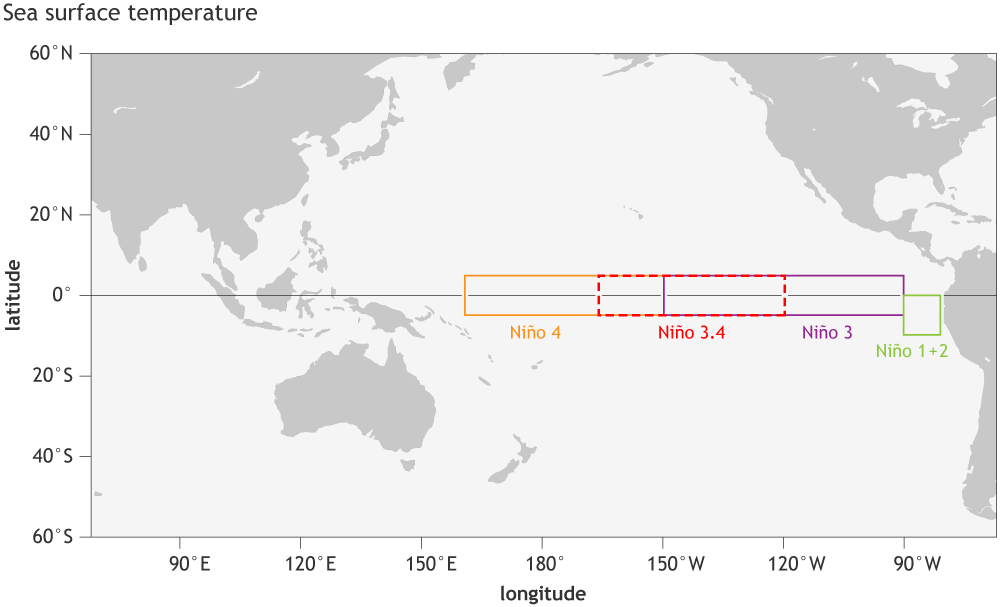
Figure 5.7. January 2020 sea surface temperature departure from the 1961-1990 average [3]

Main Sources:

[1] http://www.bom.gov.au/climate/current/soi2.shtml

[2] https://www.climate.gov/sites/default/files/Fig3_ENSOindices_SST_large.png

[3] http://www.bom.gov.au/climate/enso/wrap-up/archive/20200204.ssta_pacific_monthly.png?popup

[4] www.climate.gov/enso

菜单

  • Executive summary
    • Executive summary
  • Global agroclimatic patterns
    • Global agroclimatic patterns
  • Crop and environmental conditions in major production zones
    • Overview
    • West Africa
    • North America
    • South America
    • South and Southeast Asia
    • Western Europe
    • Central Europe to Western Russia
  • Main producing and exporting countries
    • Overview
    • Country analysis
    • Afghanistan
    • Angola
    • Argentina
    • Australia
    • Bangladesh
    • Belarus
    • Brazil
    • Canada
    • Germany
    • Egypt
    • Ethiopia
    • France
    • United Kingdom
    • Hungary
    • Indonesia
    • India
    • Iran
    • Italy
    • Kazakhstan
    • Kenya
    • Cambodia
    • Sri Lanka
    • Morocco
    • Mexico
    • Myanmar
    • Mongolia
    • Mozambique
    • Nigeria
    • Pakistan
    • Philippines
    • Poland
    • Romania
    • Russia
    • Thailand
    • Turkey
    • Ukraine
    • United States
    • Uzbekistan
    • Viet Nam
    • South Africa
    • Zambia
    • Kyrgyzstan
  • China
    • Overview
    • Northeast region
    • Inner Mongolia
    • Huanghuaihai
    • Loess region
    • Lower Yangtze region
    • Southwest China
    • Southern China
  • Focus and perspectives
    • 2020 Global production outlook
    • Disaster events
    • Update on El Niño
  • Annex
    • Annex A. Agroclimatic indicators and BIOMSS
    • Annex B. Quick reference guide to CropWatch indicators, spatial units, and production estimation methodology

Figures

  • 北京市朝阳区北辰西路奥运科技园区
  • +86 10-64842375/6
  • +8610-64858721(传真)
  • 许可证号:京ICP备05080539号-16
  • cropwatch@radi.ac.cn

中国科学院空天信息创新研究院(AIRCAS)

RADI CAS

Copyright © 2023 中国科学院空天信息创新研究院生态系统遥感研究室