This monitoring period covers the planting and growth of Aman rice and the harvest of Aus rice. Rainfall was above average by 5%. The average temperature was a bit higher (+0.5℃) and the photosynthetically active radiation was 1055 MJ/m2 (3% lower than average). BIOMSS was below average by 2%. The national NDVI development curve shows that crop conditions across the country were significantly lower than the 5-year average from July to September, due to the influence of floods, and reached average levels by October. The spatial NDVI pattern shows that 33.1% of the crops were above the 5-year average throughout the season, mainly dispersed in Coastal region and Hills. 22.3% of the crops were below average during the whole monitoring period. The best Vegetation Condition Index (VCIx) ranged from 0.8 to 1 and the national VCIx value was 0.91, with most areas higher than 0.8. However, the flood in July and August caused wide-spread crop damage and made it difficult to harvest Aus rice, which also delayed the planting of the Aman rice. According to the last report, the NDVI curve was close to average from April to May and then rapidly dropped to below average in June, and returned to normal levels by the end of October, which was consistent with the flood events. They caused local crop damage and a general delay of the Aman rice production. The fact that the crops recovered to close to normal crop conditions in October indicates that production prospects are only slightly below average.
监测期涵盖了阿曼稻种植与生长过程以及澳洲稻的收获期。与过去15年同期平均水平相比,降水量偏高5%。平均气温偏高0.5℃,光合有效辐射为1055 MJ / m2(偏低3%),潜在生物量偏低2%。基于NDVI的作物生长过程线表明,由于洪水的影响,7月至9月全国农作物长势明显低于近5年平均值,直到10月才达平均水平。基于NDVI的距平聚类图显示,整个监测期内全国33.1%的农作物长势高于近5年平均水平,主要分布在沿海地区和山地丘陵地区,22.3%的农作物长势低于平均水平。最佳植被状况指数(VCIx)变化范围处于0.8到1,全国范围内VCIx值为0.91,大多数地区都高于0.8。然而,七月和八月的洪水使得农作物大面积受损,导致澳洲水稻收割困难,推迟了阿曼水稻的播种时间。结合上一期监测报告可知,NDVI曲线在4月至5月接近平均水平,然后在6月迅速下降至平均水平以下,并在10月底恢复到正常水平,这与洪水侵袭时间一致。洪水造成了当地农作物受损,导致阿曼大米产量明显下降。十月份作物长势恢复到接近正常水平表明作物未来产量将略低于平均水平。
Bangladesh can be divided into four Agro-Ecological Zones (AEZ): Coastal region, the Gangetic plain, the Hills, and the Sylhet basin.
孟加拉国分为四个农业生态区:沿海地区、恒河平原、山地丘陵以及锡尔赫特盆地
In the Coastal region, both RAIN and TEMP were above average (+15% and +0.6℃, respectively). BIOMSS and RADPAR were below average (-1% and -2%). The crop condition development graph based on NDVI shows that crop conditions were significantly lower than the 5-year average from July to September, and then reached average levels. CALF was at 92% and VCIx at 0.95. These parameters indicate average conditions .
与过去15年同期平均水平相比,沿海地区降水量和平均气温分别为偏高15% 和0.6℃,潜在生物量与光合有效辐射分别偏低1%和-2%。基于NDVI的作物生长过程线表明,沿海地区7月至9月的作物长势明显低于5年平均水平,之后在十月份达到平均水平。 耕地种植比例为92%,最佳植被状况指数为0.95, 这些指标表明作物生长条件处于平均水平。
The Gangetic plains received the largest precipitation amount (+18% above average). Temperature was above average (+0.5 °C) and RADPAR was 3% below. The crop condition development graph based on NDVI shows that crop conditions were significantly lower than the 5-year average during the whole monitoring period, and BIOMSS decreased by 3%. CALF (95%) and VCIx at 0.92 indicate unsatisfactory prospects.
与过去15年同期平均水平相比,恒河平原降水量偏高18%(在四个分区中降水量最大), 平均气温偏高0.5°C,光合有效辐射偏低3%。 基于NDVI的作物生长过程线表明,作物长势在整个监测期内明显低于近5年平均水平,潜在生物量偏低3%。 耕地种植比例(95%)和最佳植被状况指数(0.92)表明作物生长前景不理想。
In the Hills, rainfall was 2% below the average, TEMP was above average (+0.5°C) and poor sunshine (RADPAR -5%). The crop condition development graph based on NDVI shows that crop conditions were close to average in August and October, but slightly below average in the other months. BIOMSS was below average (-3%), CALF was 98% and VCIx was 0.99, indicating satisfactory crop conditions.
与过去15年同期平均水平相比,山地丘陵区降水量偏低2%,平均气温偏高0.5°C,日照较差(光合有效辐射偏低5%)。基于NDVI的作物生长过程线显示8月和10月的作物长势接近平均水平,而其他月份则略低于平均水平。 潜在生物量偏低3%,耕地种植比例为98%,最佳植被状况指数为0.99,表明作物生长条件较好。
In the Sylhet Basin, rainfall was closed to average. TEMP was 0.6°C above the average and RADPAR was 4% below. The NDVI developmnet was similar to the Coastal region, starting below average and exceeding the average in October. The BIOMSS potential of 699 gDM/m2 (the lowest for all regions) was also 4% below the 5YA, with low CALF at 86% and VCIx of 0.87. Widespread flooding in August caused unfavorable crop conditions.
与过去15年同期平均水平相比,锡尔赫特盆地降水量接近平均水平,平均气温偏高0.6°C,而光合有效辐射偏低4%, NDVI曲线的变化趋势与沿海地区相似,监测初期低于平均水平,并于十月份达到平均水平。 潜在生物量为699 gDM/m2(分区最低)偏低4%,耕地种植比例(86%)较低,最佳植被状况指数为0.87。八月份洪水对当地作物造成了不利影响。
Figure 3.9 Bangladesh's crop condition, July-October 2020.
图3.9 2020年7月-10月孟加拉国作物长势
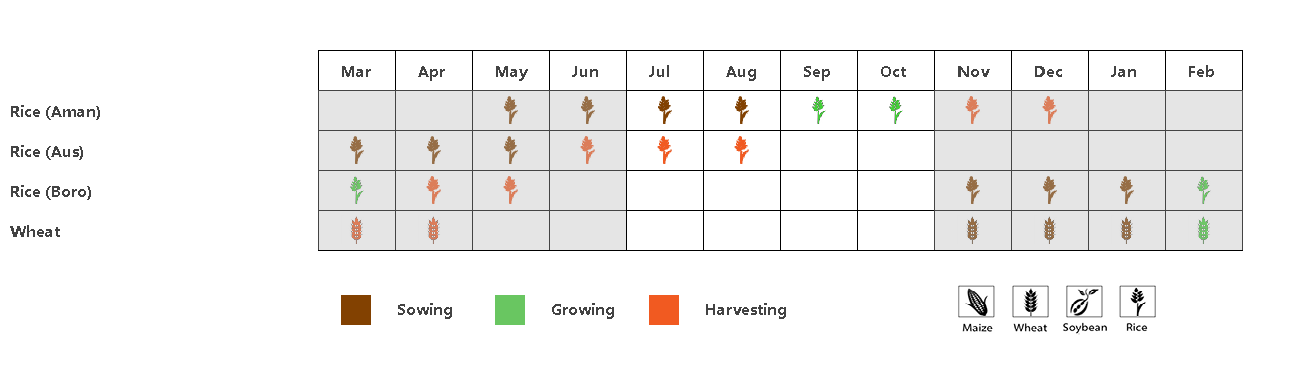
(a). 主要作物物候历
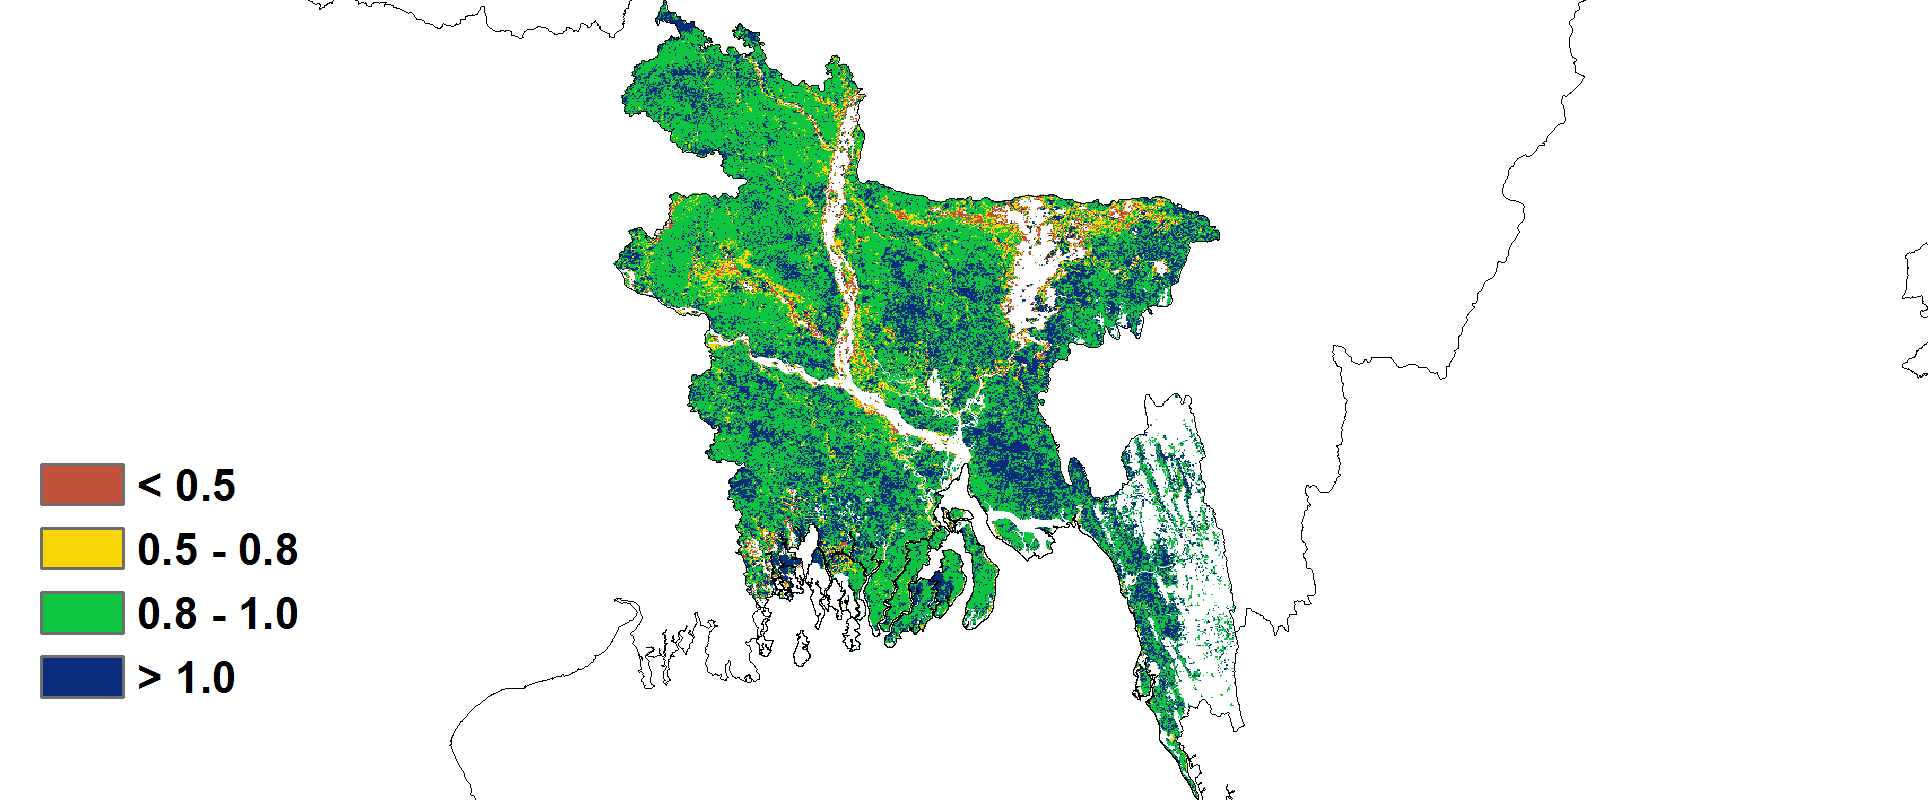
(b) 基于 NDVI 的作物生长过程线 (c) 最佳植被状况指数
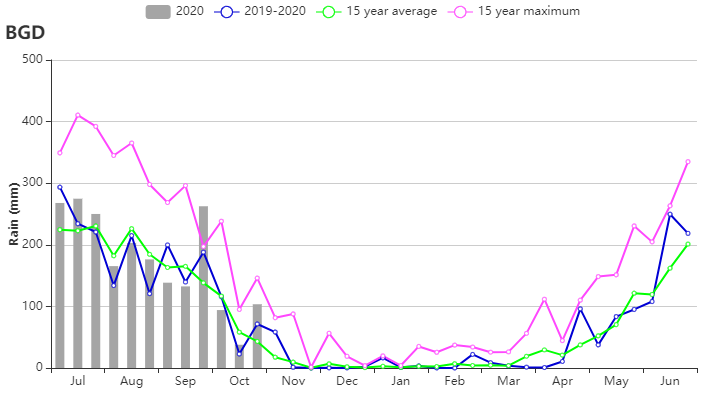
(d) 降水指数 (e) 温度指数
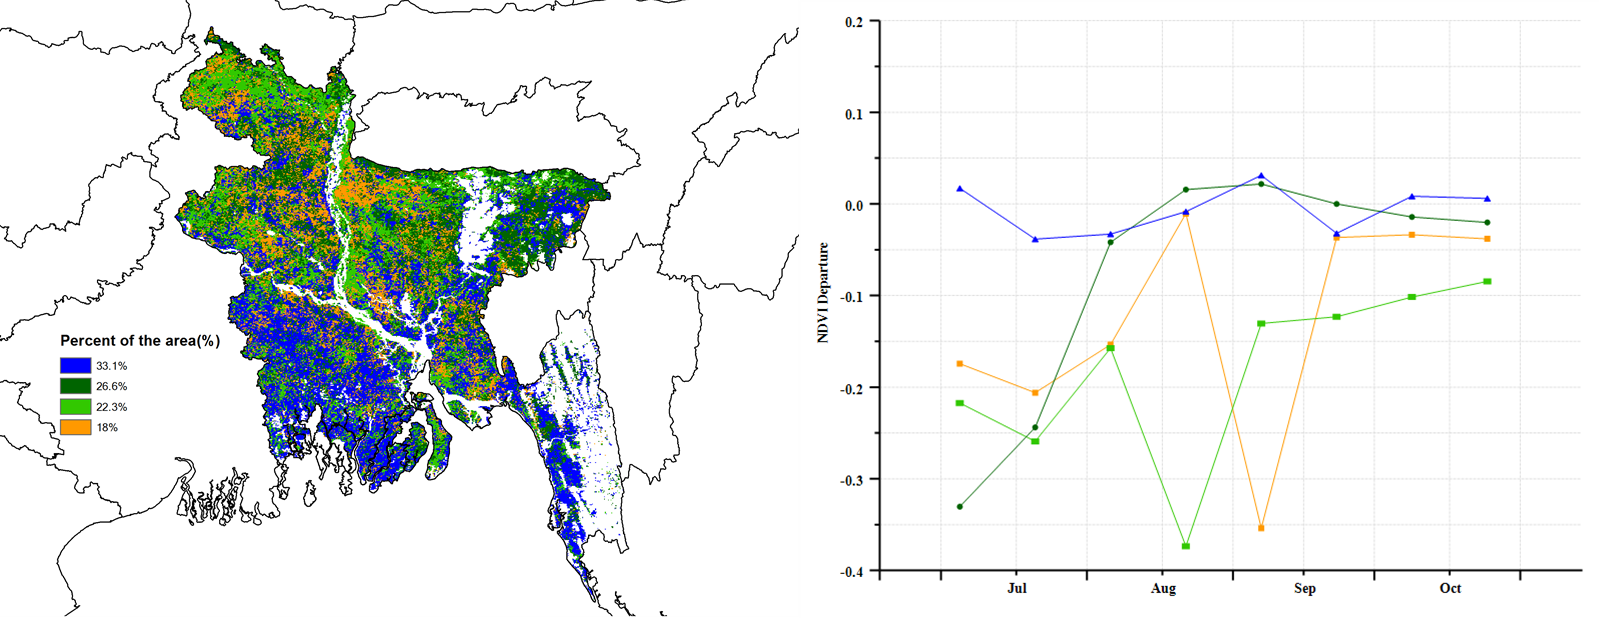
(f)NDVI 距平空间聚类图 (g) NDVI 距平聚类过程线
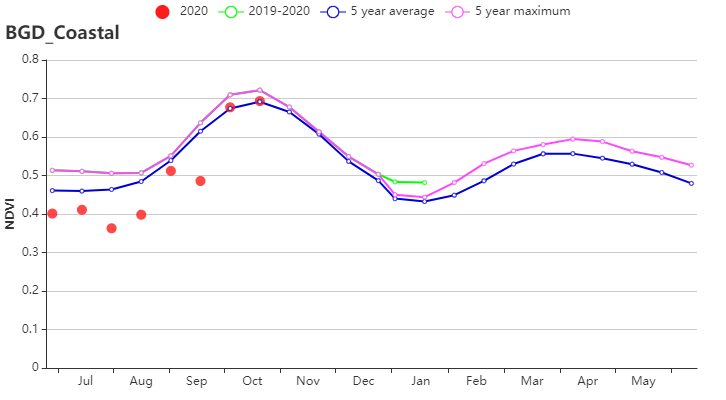
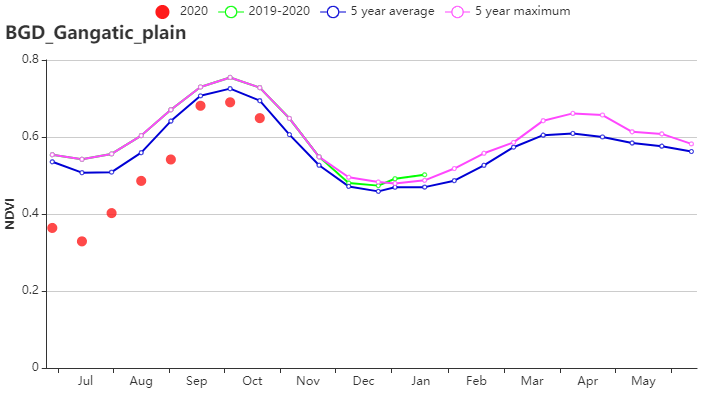
(h) 基于 NDVI 的作物生长过程线(沿海地区(左)和恒河地区(右))
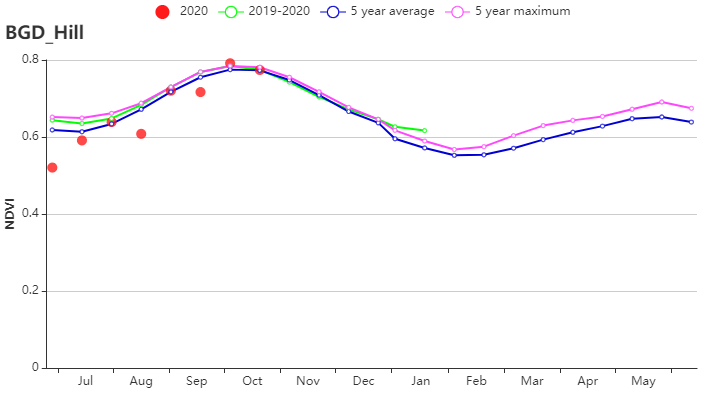
(i) 基于 NDVI 的作物生长过程线(山地丘陵区(左)和锡尔赫特地区(右))
表3.77孟加拉国农业生态分区2020年7月-10月与过去15 年(15YA)同期农业气象指标
区域 | 累计降水 | 平均气温 | 光合有效辐射 | 潜在生物量 | ||||
当前值(mm) | 距平(%) | 当前值(℃) | 距平(℃) | 当前值(MJ/m2) | 距平(%) | 当前值(gDM/m2) | 距平(%) | |
沿海地区 | 1524 | 8 | 28.8 | -0.6 | 1340 | 2 | 902 | 4 |
恒河平原 | 1725 | 38 | 28.7 | -0.9 | 1227 | -2 | 791 | -4 |
山地丘陵区 | 1700 | -12 | 27.0 | -0.4 | 1303 | 1 | 830 | -3 |
沿海地区 | 1671 | 11 | 27.8 | -0.5 | 1207 | -2 | 817 | -2 |
表3.78孟加拉国农业生态分区2020年7月-10月与近5 年(5YA)同期农情指标
分区 | 耕地种植比例 | 复种指数 | 最佳植被状况指数 | ||
当前值(%) | 距平(%) | 当前值(%) | 距平(%) | 当前值 | |
沿海地区 | 90 | 6 | 159 | 1 | 0.97 |
恒河平原 | 98 | 1 | 181 | -3 | 0.97 |
山地丘陵区 | 97 | 1 | 109 | -21 | 0.95 |
锡尔赫特盆地 | 99 | 2 | 160 | -5 | 0.97 |