The current monitoring period covers the monsoon season, during which the main rice crop (Kharif) is grown. It is planted at the beginning of monsoon in June and harvested in October. Other major crops grown during this monitoring period are maize and soybean. Rabi wheat sowing started in October. The graph of NDVI development shows that the crop conditions were close to or above the average in general, except in mid-August, indicating that the crop conditions for Kharif rice, maize and soybean were favorable at the national level.
本监测期内,印度处于季风季节,涵盖了主要作物夏季水稻(六月播种,十月收获)、玉米和大豆的生长期,冬季水稻在十月开始播种。基于NDVI的作物生长过程曲线显示,在监测期内除8月中旬以外,作物长势总体接近或者高于近5年同期平均水平,表明全国范围内夏季水稻、玉米和大豆作物长势良好。
The CropWatch agroclimatic indicators show that nationwide TEMP (+0.3 °C) was close to average, wheras RADPAR was at the same level as the 15YA. India recorded abundant RAIN (+5%) after July, which exceeded the 15-year average for the same monitoring period. The increased rainfall and temperature resulted in a BIOMSS increase by 1% compared with the 15YA. Moreover, the overall VCIx was high, with a value of 0.97. As can be seen from the spatial distribution, only the South, Northeast and Northwest recorded values below 0.80. Most of India had high VCIx values. These spatial patterns of VCIx were thus generally consistent with those of NDVI. Almost all areas experienced continuously above-average crop conditions until September. The spatial distribution of NDVI profiles shows that in August, 28.9% of the areas recorded below-average crop conditions in the West and Northeast regions. CALF increased by 3% compared to the 5YA.
CropWatch农气指数显示本监测期内,国家尺度上,与过去15年同期平均水平相比,平均气温偏高0.3℃,光合有效辐射与平均水平持平。与过去15年同期平均水平相比,在七月后降水量偏高5%。偏高的降水量和平均气温使得潜在累积生物量与过去15年平均水平相比偏高了1%。此外,从空间分布上看,除了印度南部,东北部和西北部地区最佳植被状况指数较低外(小于0.80),其他全国均处于较高水平,达到0.97。NDVI距平的空间分布与最佳植被状况指数的分布情况基本一致。一直到九月,几乎所有地区的作物长势均高于平均水平。NDVI距平的空间分布图显示,八月28.9%西部和东北地区的作物长势低于平均水平。全国耕地种植比例与近5年平均水平相比增长了3%。
With the exception of a few areas, the crop conditions in all parts of India were favorable. During the last monitoring period, the crops in some areas were affected by excessive rainfall and flooding, but the general situation has turned favorable. Crop production for this season is estimated to be above average at the national level.
除少数地区外,印度大部分地区的作物长势良好。在上一个监测期内,一些地区的作物受到降雨和洪水的影响,但在本期内总体形势好转。预计本监测期间全国作物长势将高于往年平均水平。
Regional analysis
区域分析
India is divided into eight agro-ecological zones: the Deccan Plateau (94), the Eastern coastal region (95), the Gangetic plain (96), Assam and north-eastern regions (97), Agriculture areas in Rajasthan and Gujarat (98), the Western coastal region (99), the North-western dry region (100) and the Western Himalayan region (101).
根据作物种植制度、气候区及地形条件,将印度划分为8个农业生态分区,分别为德干高原区(94)、东部沿海地区(95)、恒河平原区(96)、阿萨姆邦和东北地区(97)、拉贾斯坦邦和古吉拉特邦农业区(98)、西部沿海地区(99)、西北部干旱地区(100)和西部喜马拉雅地区(101)。
The two agro-ecological zones of the Deccan Plateau and the Agriculture areas in Rajasthan and Gujarat show similar trends in agricultural indices. Compared to the same period of previous years, RAIN had increased, especially in the Agriculture areas in Rajasthan and Gujarat (+21%). Aided by slightly higher TEMP and RADPAR, abundant rainfall caused BIOMSS to be much higher than the 15-year average. CALF showed the same trends. In Rajasthan and Gujarat, it was 4% above the 5YA. The graph of NDVI development shows that the crop growth of these two agro-ecological regions during this monitoring period exceeded the 5-year maximum in most months. Generally, the crop production is expected to be above average.
德干高原区、拉贾斯坦邦和古吉拉特邦农业区这两个生态农业区农业指数变化趋势类似。与过去15年同期平均水平相比,降水量均偏高,特别是在
拉贾斯坦邦和古吉拉特邦农业区(偏高21%)。平均气温和光合有效辐射均略高于平均水平,但在充沛降水的加持下,潜在生物量远远高出平均水平。两个地区耕地种植比例趋势相同,在拉贾斯坦邦和古吉拉特邦农业区增幅超过了4%。根据NDVI作物生长过程线显示,两个地区的作物长势在绝大月份超过了近5年的最高水平。总而言之,预计这两个地区作物产量将高于平均水平。
The Eastern coastal region and the Western coastal region recorded similar trends of agricultural indices in this monitoring period. Compared to the same period of the previous years, RAIN had increased by more than 10%. TEMP was slightly below average (-0.1°C) in the Eastern coastal region and slightly above average (+0.1°C) in the Western coastal region. Below average RADPAR caused a decrease in BIOMSS. Both regions recorded increases of CALF (+3% and +6%, respectively). VCIx was above 0.95. The graph of NDVI development shows that the crop growth for the two regions exceeded the 5-year average. The crop production is expected to be above average.
东部沿海地区和西部沿海地区在本次监测期内农气指数变化趋势类似。与往年同期平均水平相比,降水均偏高10%以上。平均气温在东部和西部沿海地区均接近于平均水平(分别偏低0.1℃和偏高0.1℃)。偏低的光合有效辐射导致了潜在生物量与往年同期水平相比有所偏低。2个地区的耕地种植比例均偏高,分别为3%和6%。最佳植被状况指数均高于0.95。根据NDVI作物长势曲线,2个生态农业区的作物长势均超过了近5年平均水平,预计该监测期间作物产量高于往年平均水平。
The North-western dry region recorded 512 mm of RAIN, which was 54% above average. TEMP was at 31.1°C (+0.3°C), and RADPAR was slightly below the 15YA at 1188 MJ/m² (-2%). BIOMSS was above the 5YA (+7%) due to the heavy rainfall. CALF reached 56% which was a significant increase by 44% over the 5-year average, and VCIx was 0.90. The graph of NDVI development shows that the crop growth of this region during this monitoring period exceeded the 5-year average in most months. Generally, the crop production is expected to be above average.
西北干旱区邦累计降水量为512mm(+54%),平均气温约为31.1°C(+0.3°C),光合有效辐射为1188 MJ/m²(-2%).。监测期内,由于大幅增加的降水量,使得潜在生物量偏高7%。耕地种植比例为56%,与近5年同期平均水平相比有着大幅的增加,偏高了44%。最佳植被状况指数为0.90.总的来说,预计该监测期间作物产量高于往年平均水平。
The Assam and Northeastern region recorded 2429 mm of RAIN, which was slightly above average (+4%). TEMP was at 24.3°C (+0.3°C) and RADPAR was at 863 MJ/m² (-9%). BIOMSS was below the 5YA (-7%) due to less solar radiation. CALF reached 95% which was near average, and VCIx was 0.94. The outlook of crop production in this region is slightly unfavorable due to the low radiation and high rainfall.
阿萨姆邦累计降水量为2429mm(+4%),平均气温约为24.3°C(+0.3°C),光合有效辐射为863 MJ/m²(-9%)。尽管本监测期内降水量增加,但仍不足以抵消光合有效辐射偏低带来的影响。因此,潜在生物量与往年平均水平相比偏低(-7%)。耕地种植比例达到95%,与平均水平持平。最佳植被状况指数为0.94,由于较低的光合有效辐射,预计该地区的作物产量不佳。
The Western Himalayan region and the Gangetic plain recorded similar trends of agricultural indices in this monitoring period. Compared to the same period of the previous years, RAIN had decreased significantly, especially in the Western Himalayan region (-53%). TEMP and RADPAR were slightly higher. Lack of rainfall caused BIOMSS estimates to be below the 15-year average. CALF was close to the 5-year average in both regions. The VCIx was higher than 0.94. The graph of NDVI development shows that crop growth for the two regions was below the 5-year average during the monitoring period. Therefore, crop production conditions were slightly unfavorable.
西部喜马拉雅地区和恒河平原区在本次监测期内农气指数变化趋势类似。与往年同期平均水平相比,降水量大幅偏低,西部喜马拉雅地区尤为显著(-53%)。尽管平均气温和光合有效辐射略微增高,但是显著偏低的降水使得潜在生物量与往年同期水平相比偏低。2个地区的耕地种植比例均接近平均水平。最佳植被状况指数均超过0.94。根据NDVI作物长势曲线,2个生态农业区的作物长势均低于近5年平均水平,预计该监测期间作物产量不佳。
图3.20 2020年7月-10月印度作物长势
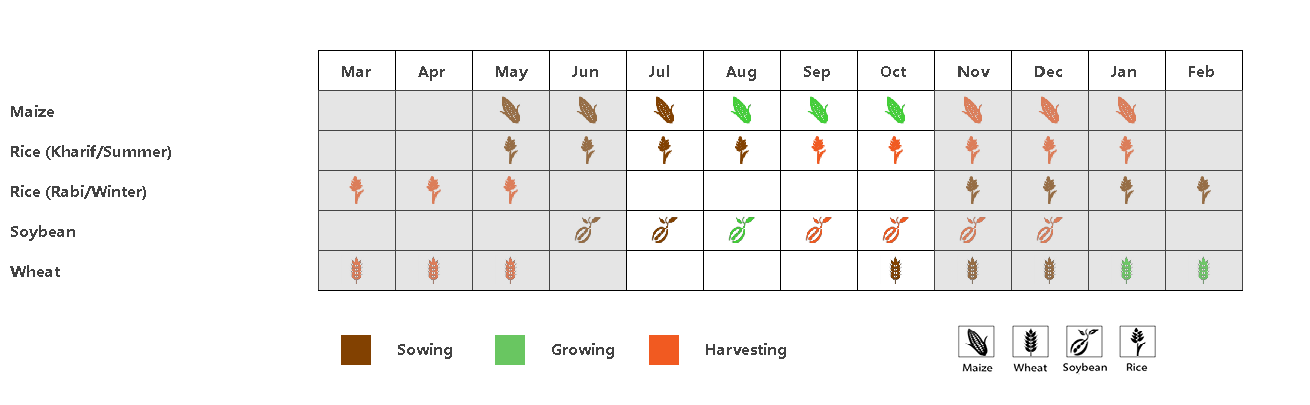
(a) 主要作物物候历
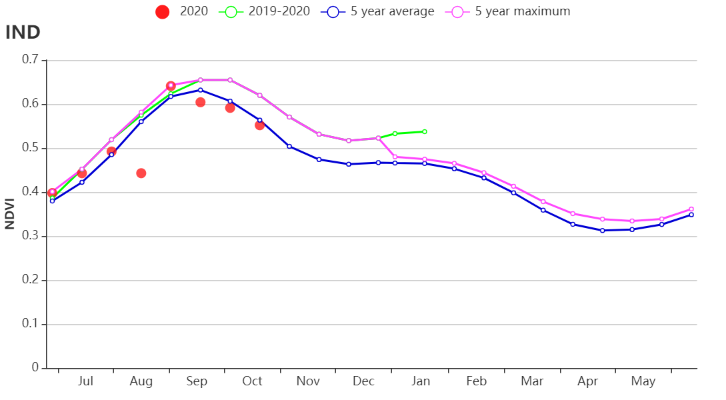
(b) 基于 NDVI 的作物生长过程线
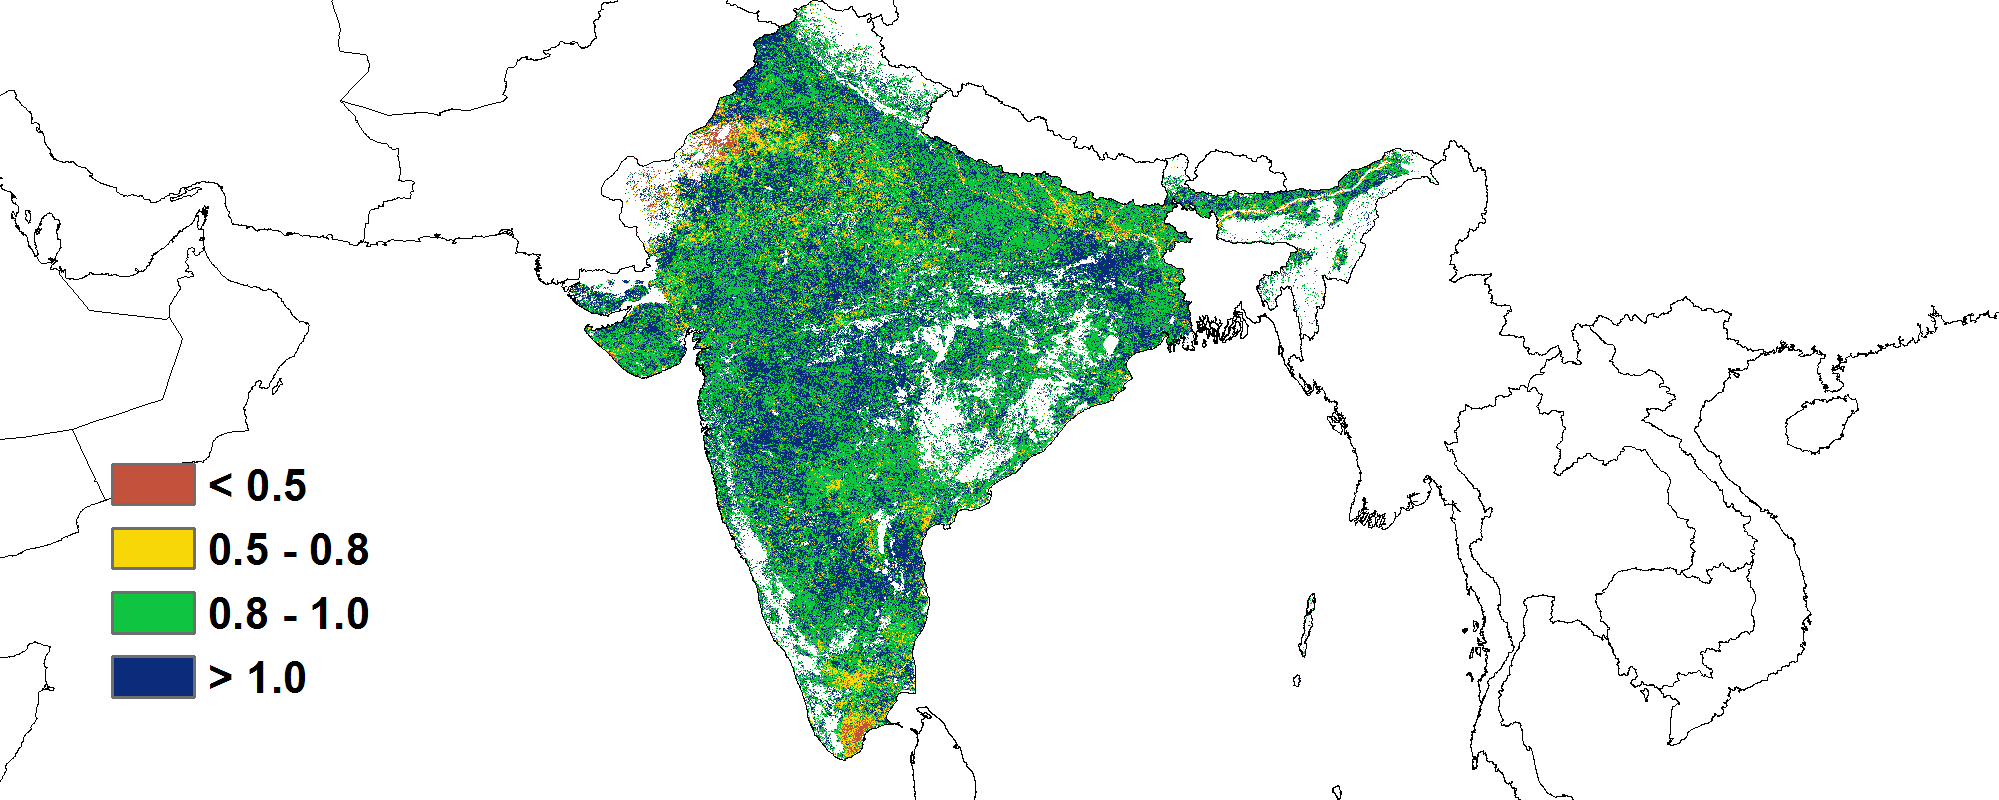
(c) 最佳植被状况指数
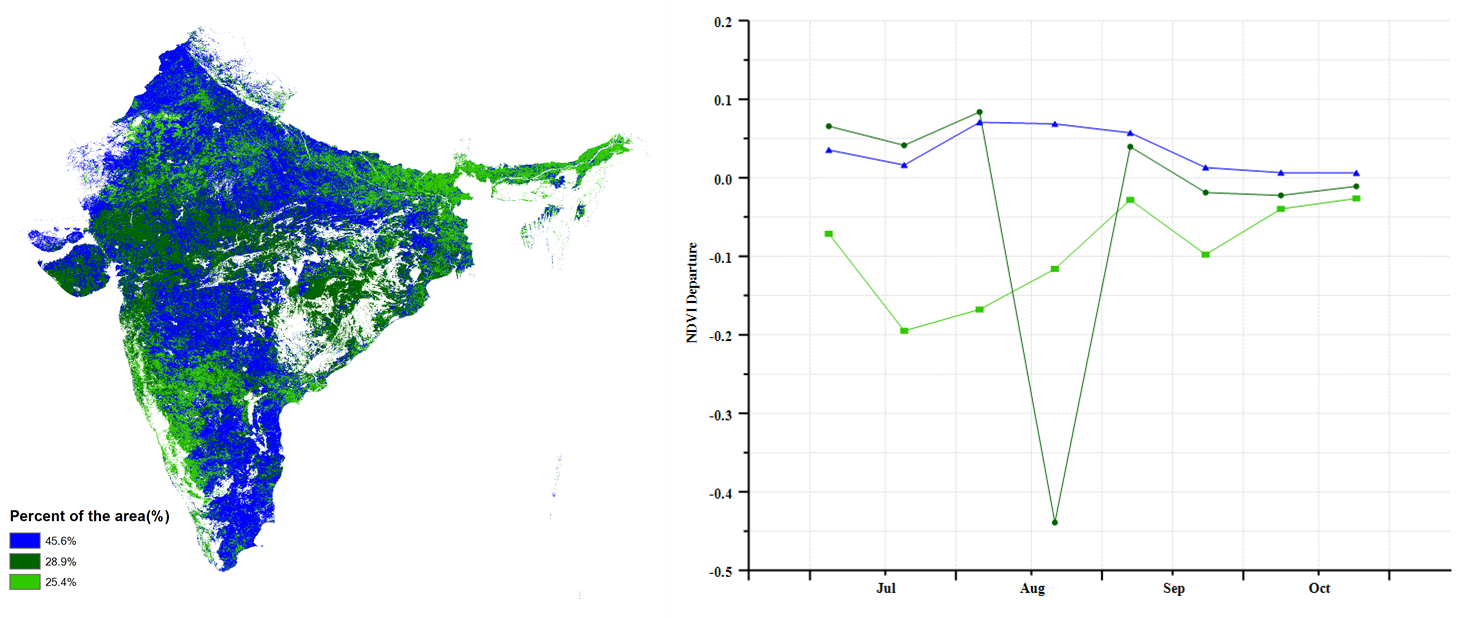
(d) NDVI 距平空间聚类图 (e) NDVI 距平聚类过程线
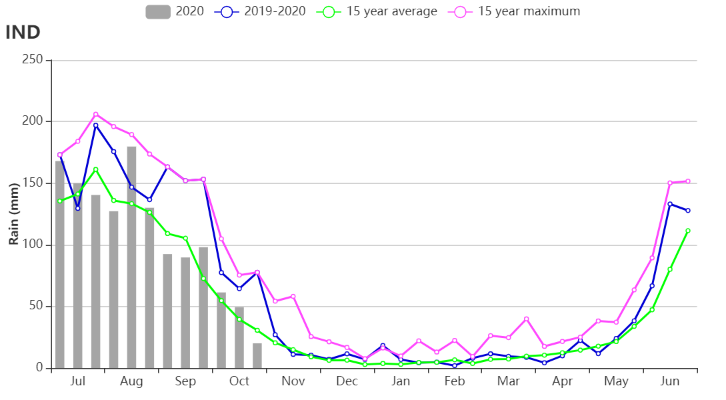
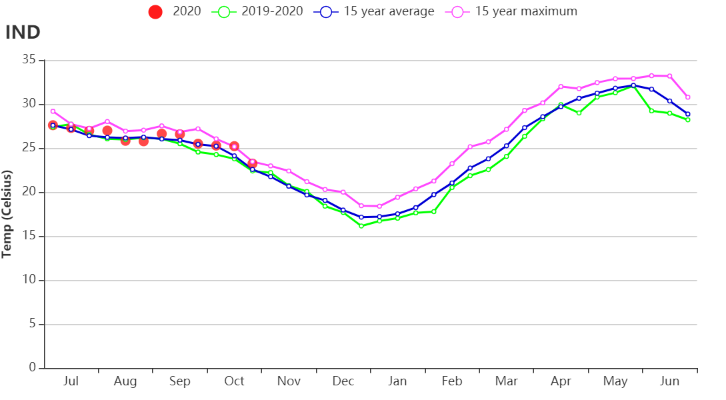
(f) 时间序列的降水过程线 (g) 时间序列的温度过程线
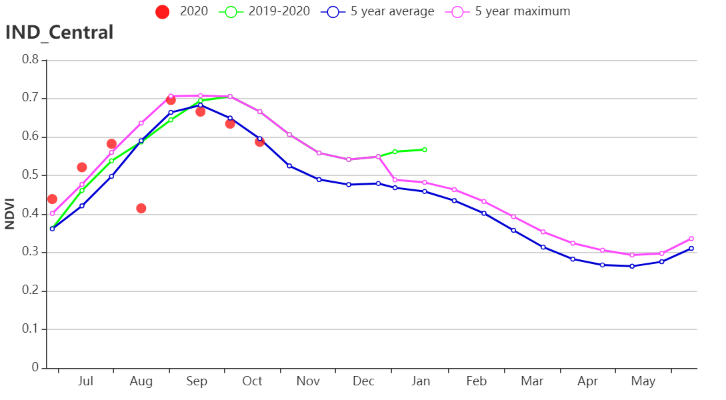
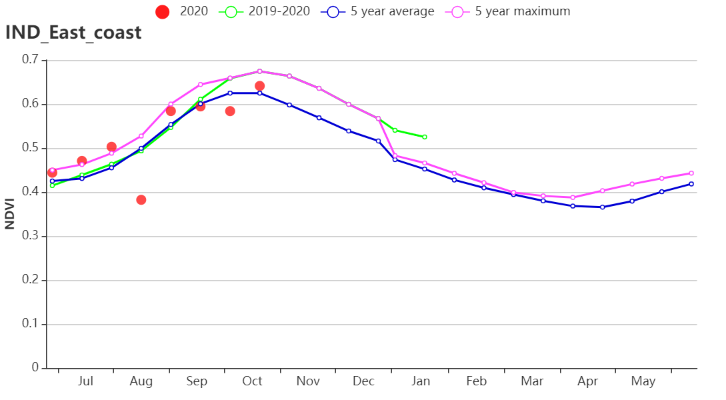
(h) 于 NDVI 的作物生长过程线(德干高原(左)和东部沿海地区(右))
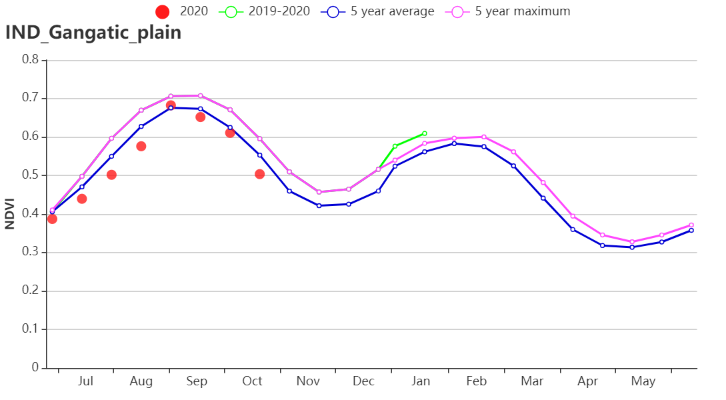
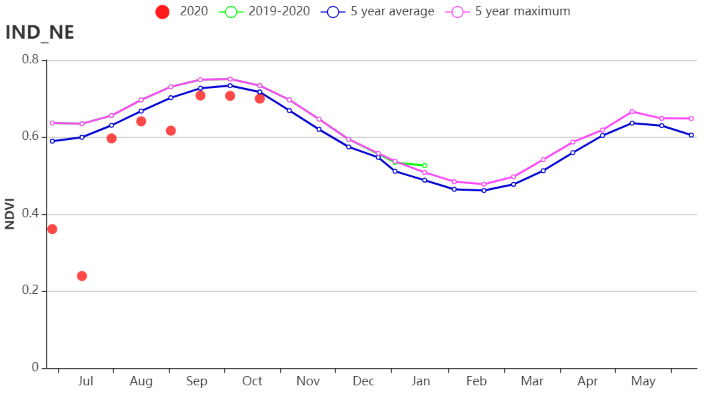
(i) 基于 NDVI 的作物生长过程线(恒河平原(左)和阿萨姆邦和东北地区(右))
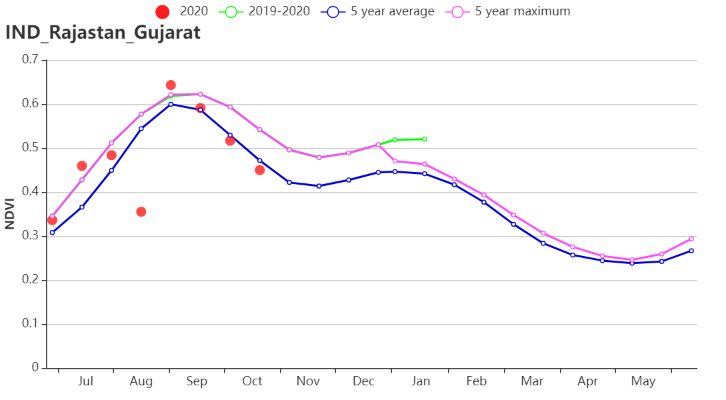
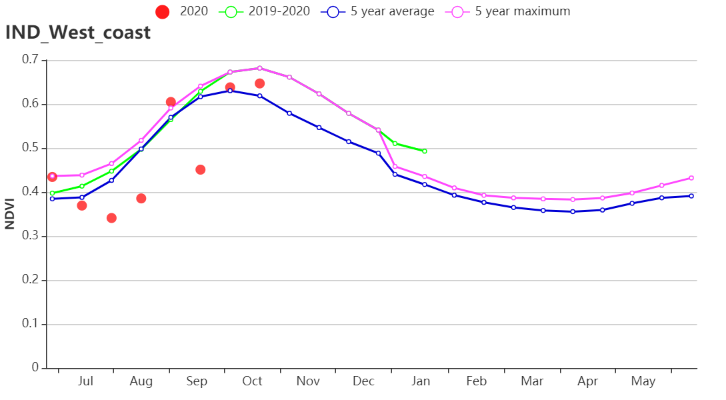
(j) 基于 NDVI 的作物生长过程线(拉贾斯坦邦和古吉拉特邦农业区(左)和西部沿海区(右))
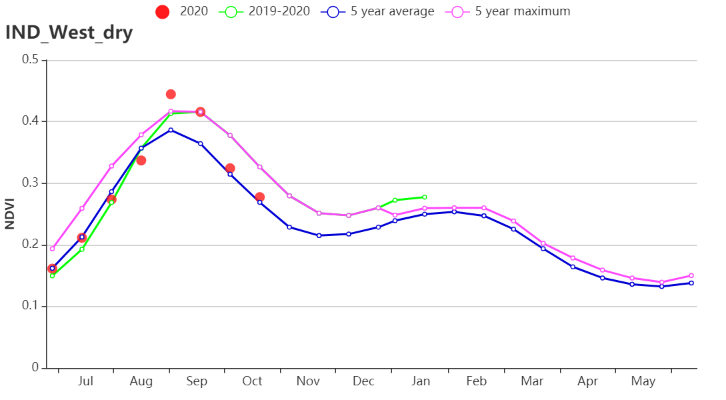
(k) 基于 NDVI 的作物生长过程线(西北部干旱区(左)和西部喜马拉雅地区(右))
表3.31印度农业生态分区2020年7月-10月与过去15年(15YA)同期农业气象指标
区域 | 累计降水 | 平均气温 | 光合有效辐射 | 潜在生物量 | ||||
当前值(mm) | 距平(%) | 当前值(°C) | 距平 (°C) | 当前值(MJ/m2) | 距平(%) | 当前值(gDM/m2) | 距平 (%) | |
德干高原 | 1144 | 7 | 26.0 | 0.6 | 1079 | 3 | 662 | 5 |
东部沿海地区 | 1179 | 11 | 26.3 | -0.1 | 1080 | -2 | 710 | -3 |
恒河平原 | 1048 | -6 | 27.9 | 0.5 | 1148 | 2 | 667 | -4 |
阿萨姆邦和东北地区 | 2430 | 4 | 24.3 | 0.4 | 864 | -9 | 538 | -7 |
拉贾斯坦邦和古吉拉特邦农业区 | 1103 | 21 | 27.9 | 0.4 | 1077 | 0 | 648 | 12 |
西部沿海地区 | 1603 | 12 | 24.0 | 0.0 | 932 | -4 | 608 | -1 |
西北部干旱地区 | 512 | 54 | 31.1 | 0.3 | 1188 | -2 | 604 | 7 |
西部喜马拉雅地区 | 436 | -53 | 19.2 | 0.5 | 1280 | 7 | 431 | -9 |
表3.32印度农业生态分区2020年7月-10月与近5年(5YA)同期农情指标
区域 | 耕地种植比例 | 复种指数 | 最佳植被状况指数 | ||
当前值(%) | 距平(%) | 当前值(%) | 距平(%) | 当前值 | |
德干高原 | 99 | 1 | 126 | 6 | 0.99 |
东部沿海地区 | 95 | 3 | 114 | 2 | 0.96 |
恒河平原 | 98 | 0 | 169 | 2 | 0.97 |
阿萨姆邦和东北地区 | 95 | -1 | 137 | -4 | 0.94 |
拉贾斯坦邦和古吉拉特邦农业区 | 97 | 4 | 130 | 3 | 0.97 |
西部沿海地区 | 99 | 6 | 107 | 1 | 0.99 |
西北部干旱地区 | 56 | 44 | 129 | 3 | 0.9 |
西部喜马拉雅地区 | 99 | 0 | 112 | 0 | 0.94 |