到八月底,夏季作物(马铃薯和水稻)的收获期接近尾声,九月份逐渐开始播种冬季作物(小麦和大麦)。 根据基于NDVI的作物生长状况曲线图,在整个监测期内,伊朗的作物生长状况优于近5年同期平均水平。降水量比平均水平低13%,平均气温偏低0.7℃,光合有效辐射下降了4%。潜在生物量比近15年同期平均水平高出18%。全国最佳植被状况指数(VCIx)平均值为0.84,耕地面积比例(CALF)比过去5年同期平均水平高26%。
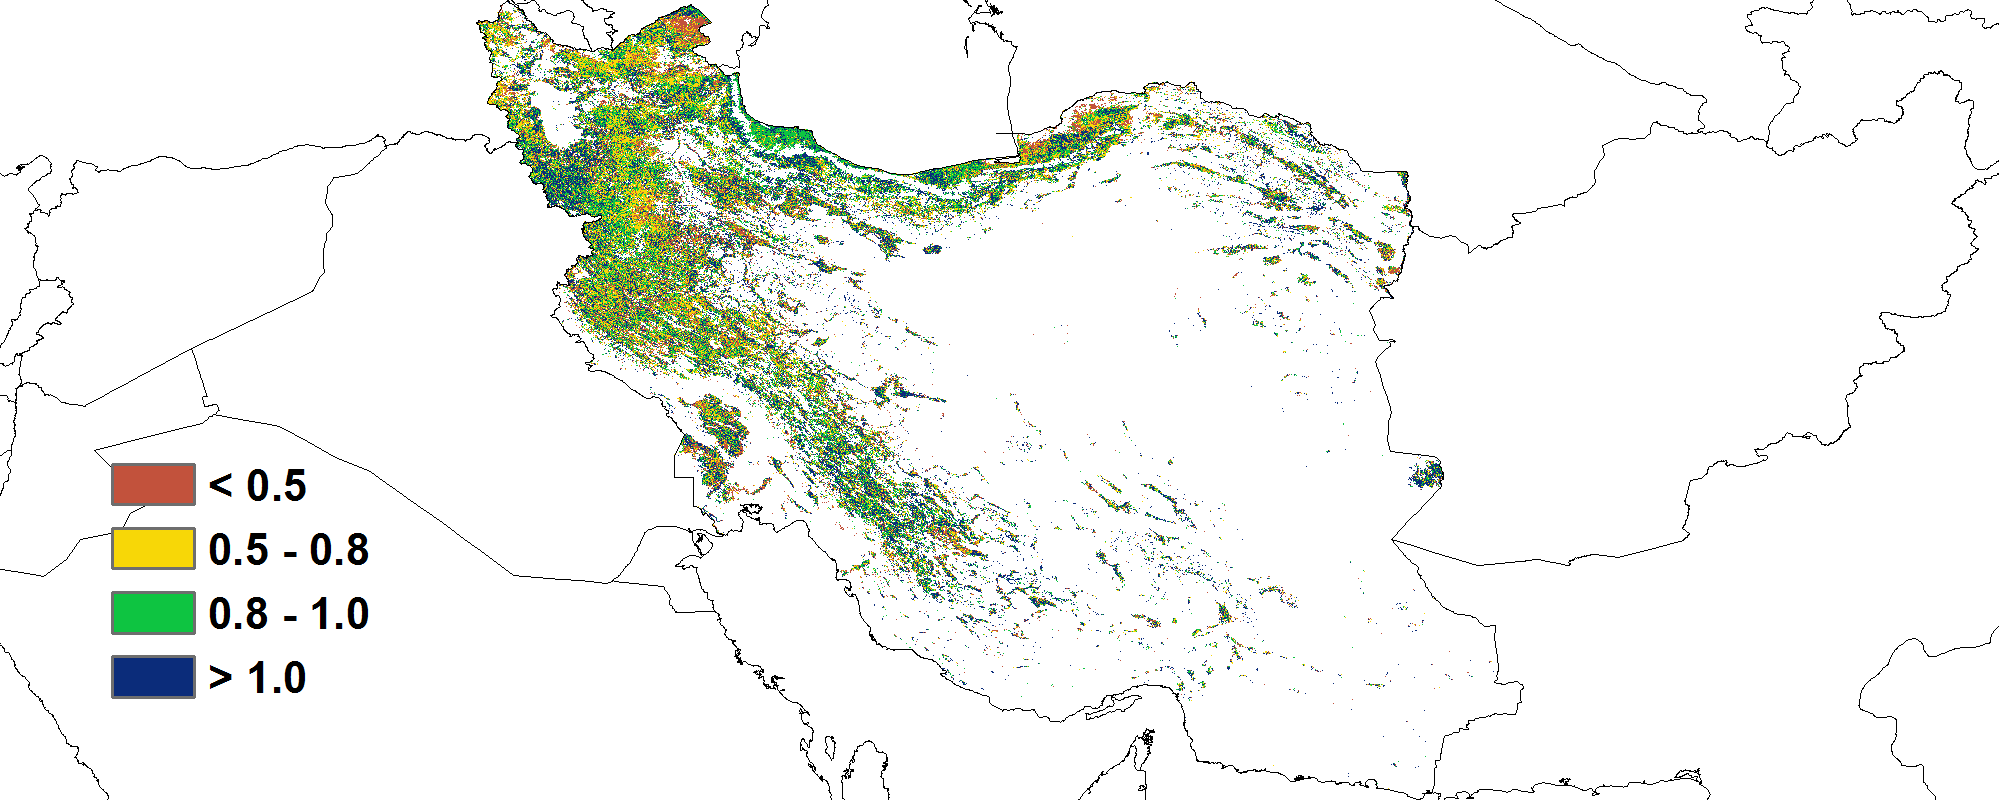
NDVI距平空间聚类图表明,从7月到10月,44.3%的耕地作物生长状况为处于或略优于近5年同期平均水平(以红色标记的区域)。直到监测期结束,有16.7%耕地(以深绿色和浅绿色标记)的作物生长状况优于平均水平,主要分布在西阿扎拜疆、东阿扎拜疆、阿尔德比勒、胡泽斯坦和加兹温省。有5.6%的耕地的作物生长状况劣于平均水平,主要分布在伊朗的北部和西南部,包括吉兰北部、马扎达兰、哥勒斯坦和胡泽斯坦省的部分地区。最佳植被状况指数(VCIx)的空间格局与NDVI距平空间聚类图的空间分布一致。
根据基于NDVI的作物长势分类图,所有时期都只有少于10%耕地的作物长势劣于平均水平。根据基于植被健康状况指数的作物长势分类图,在最后的四周里,中度至重度干旱耕地的比例增加到20%以上。
整体而言,作物生长状况处于正常平均水平。
区域分析
基于耕作制度、气候分区以及地形条件综合判断,伊朗可细分为三个子区域,其中有两个分区是农作物的主要种植区,分别是西部和北部半干旱至亚热带丘陵区域和干旱红海沿海低地和平原区域。
在西部和北部半干旱至亚热带丘陵区域,监测期间的降水量为56 mm,比平均水平低13%。平均气温(-0.7℃)和光合有效辐射(-5%)均低于近15年同期平均水平。潜在生物量比平均水平高8%。作物生长状况优于近5年同期平均水平。耕地种植比例为14%,偏高22%。复种指数较近5年平均水平略有偏低(-1%)。该地区的最佳植被状况指数平均值为0.87,表明作物收成前景良好。
在干旱红海沿海低地和平原区域,平均气温偏高0.1℃,而降水量偏低与光合有效辐射分别偏低48%和2%。潜在生物量比近15年同期平均水平高出23%。作物生长状况总体上优于近5年同期的平均水平。在监测期内,虽然耕地种植比例和复种指数分别比平均水平高60%和2%,最佳植被状况指数平均值为0.63,表明作物生长状况劣于平均水平。
图3.21. 2020年7月-10月伊朗作物长势
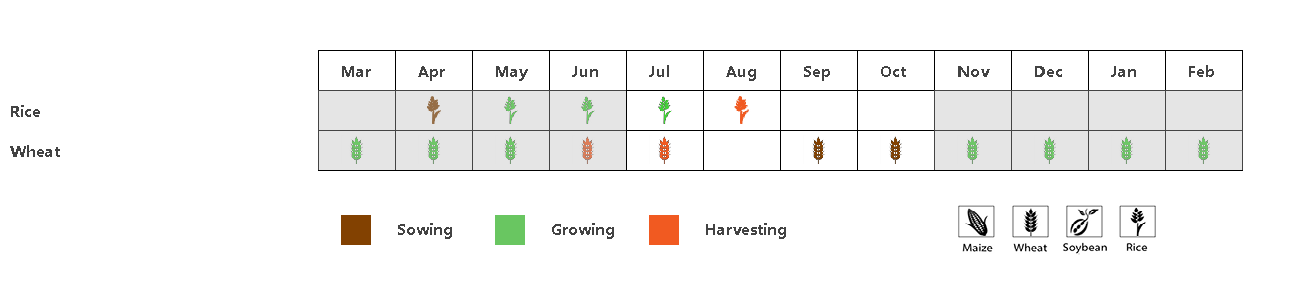
(a) 主要作物物候历
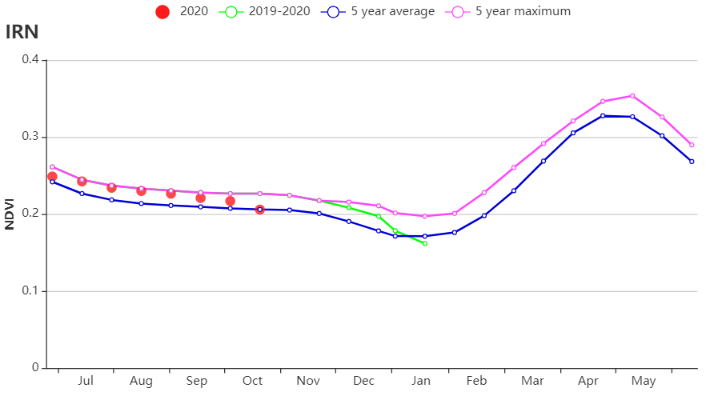
(b) 基于 NDVI 的作物生长过程线
(c) 最佳植被状况指数
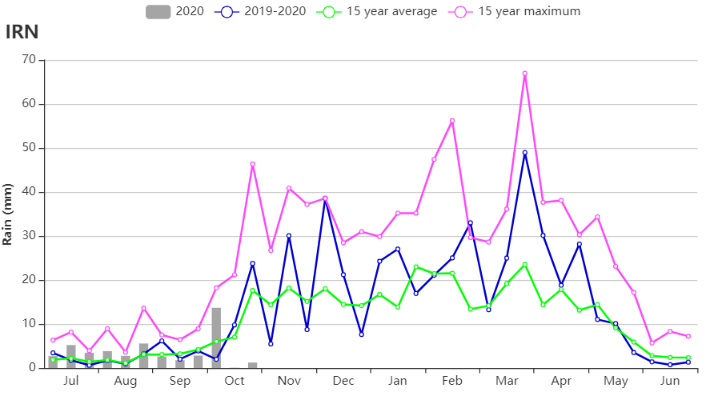
(d) 降水量时间序列过程线

(e) 平均气温时间序列过程线
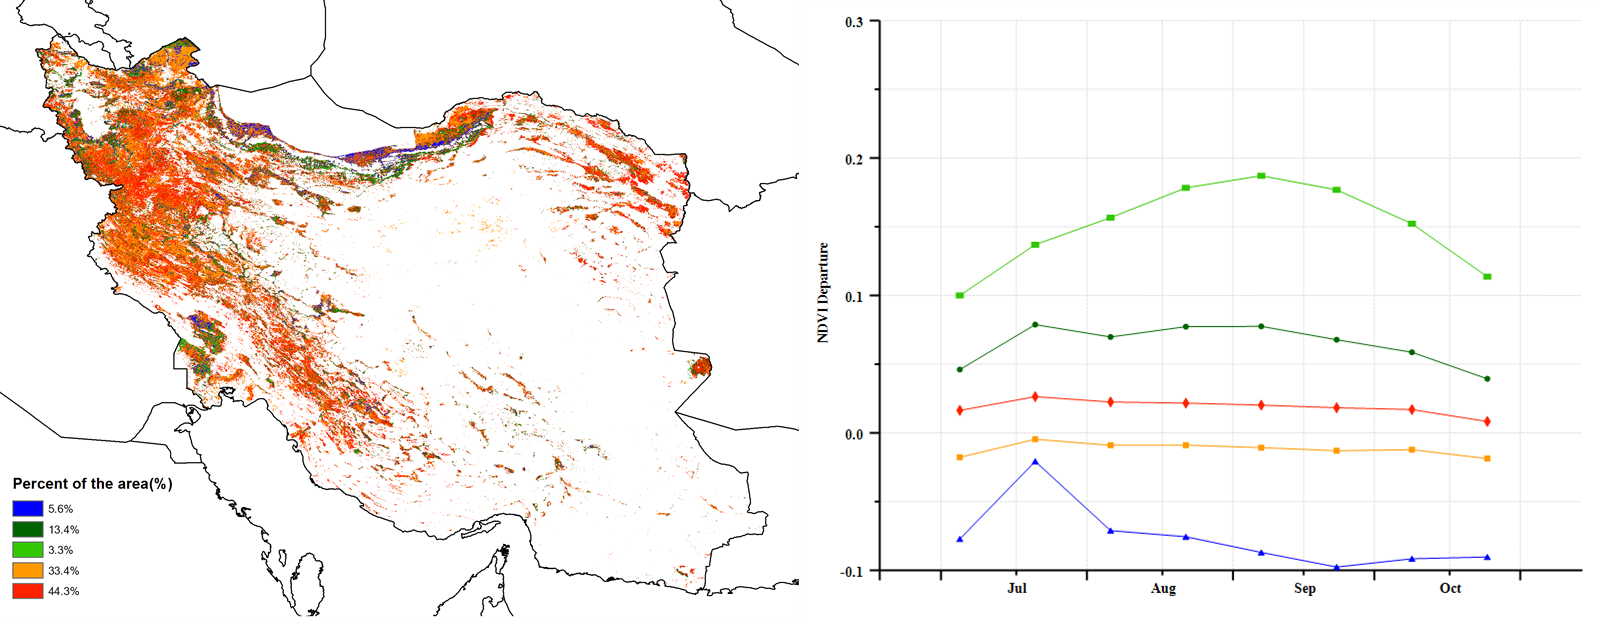
(f) NDVI距平空间聚类图 (g) NDVI距平聚类过程线
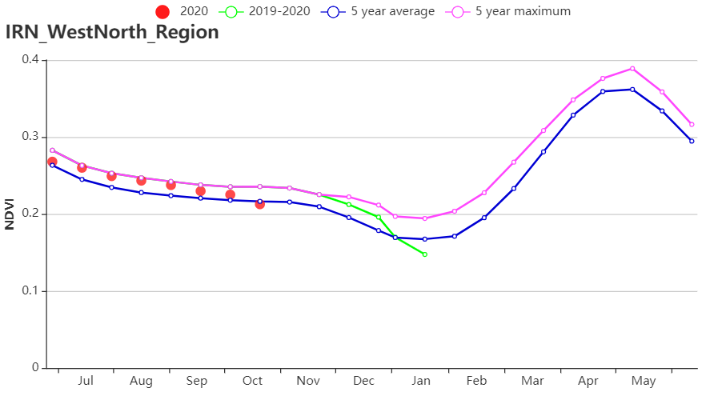
(h) 基于 NDVI 的作物生长过程线(西部和北部半干旱至亚热带丘陵区域)
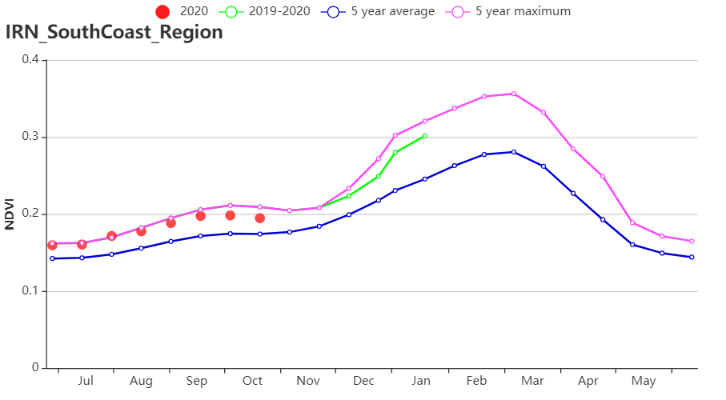
(i) 基于 NDVI 的作物生长过程线( 干旱红海沿海低地和平原区域)
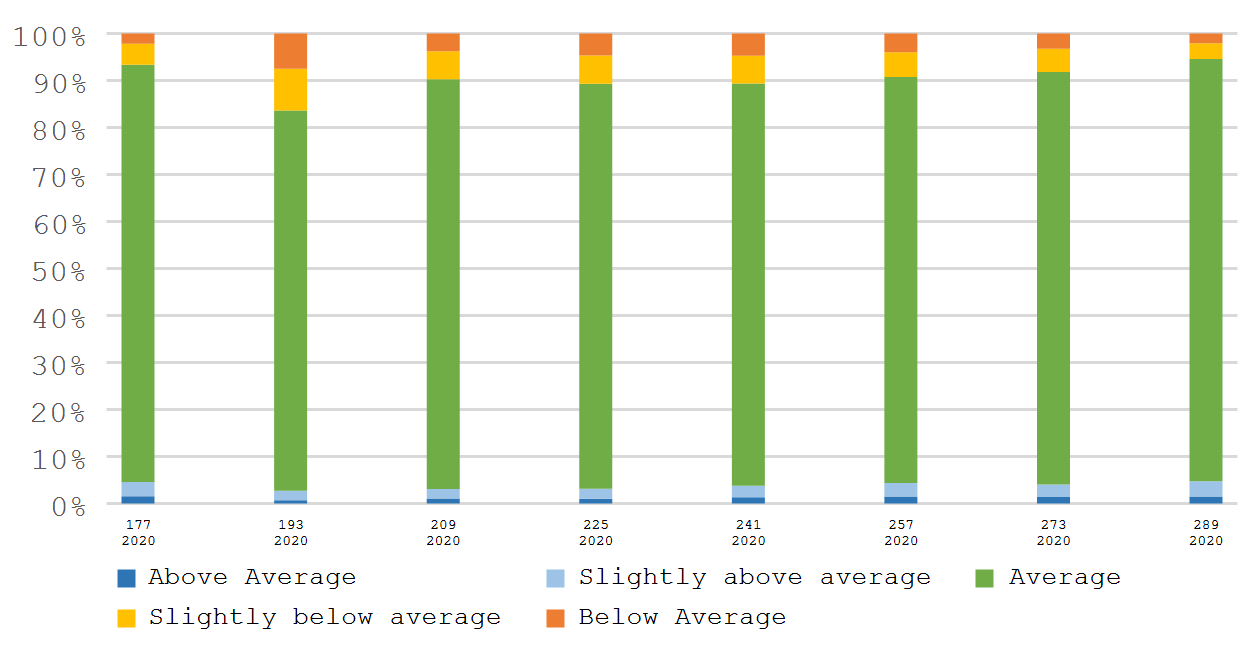
(j) 基于NDVI的作物长势分类图
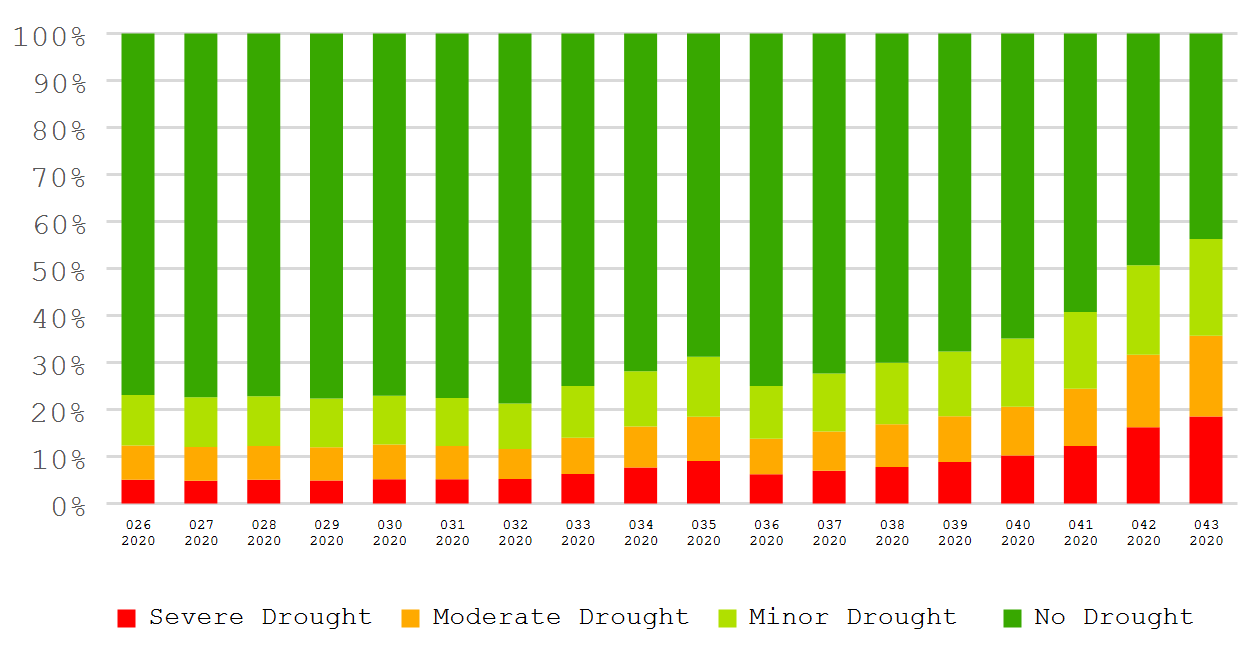
(k) 基于VHI的作物长势分类图
表3.103. 伊朗农业生态分区2020年7月-10月与过去15年(15YA)同期农业气象指标
| 累积降水 | 平均气温 | 光合有效辐射 | 累积潜在生物量 | |||||
| 当前值 (mm) | 距平 (%) | 当前值 (°C) | 距平(°C) | 当前值 (MJ/m2) | 距平 (%) | 当前值 (gDM/m2) | 距平(%) | |
| 西部和北部半干旱至亚热带丘陵区域 | 56 | -13 | 20.3 | -0.7 | 1347 | -5 | 301 | 8 |
| 干旱红海沿海低地和平原区域 | 6 | -48 | 33.0 | 0.1 | 1436 | -2 | 161 | 23 |
表3.104. 伊朗农业生态分区2020年7月-10月与近5年 (5YA)同期农情指标
| 耕地种植比例 | 复种指数 | 最佳植被状况指数 | |||
| 当前值(%) | 距平(%) | 当前值 (%) | 距平(%) | ||
| 西部和北部半干旱至亚热带丘陵区域 | 10 | 60 | 102 | -1 | 0.63 |
| 干旱红海沿海低地和平原区域 | 14 | 22 | 107 | 2 | 0.87 |