Apart from irrigated maize, which is harvested in July, no cereal crops are grown during this monitoring period in Morocco. Sowing of winter wheat starts in November. Precipitation has been below average in recent months, although most rains fall in the November to March period. The cumulative rainfall was 53 mm, it is lower than the 15-year average (15YA) by 39% The average temperature was 23.1 °C (higher than the 15YA by 0.4 °C). The temperature profile fluctuated around the average.
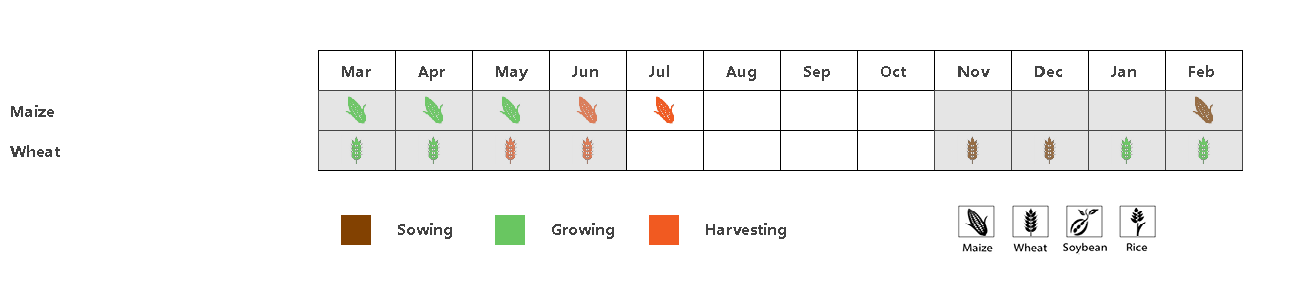
除了在7月收获的玉米外,摩洛哥在此监测期内没有谷物作物的种植, 冬小麦在11月开始播种。 尽管大多数降雨是在11月至3月期间,但近几个月的降雨量一直低于平均水平。 累计降雨量为53毫米,与过去15年同期平均水平相比,降水量偏低39%。平均气温为23.1°C,偏高0.4°C,温度时间过程序列线显示,气温整体与平均水平持平。
Regional analysis
区域分析
CropWatch adopts three agro‐ecological zones (AEZs) relevant for crop production in Morocco: the Sub-humid northern highlands, the Warm semiarid zone, and the Warm sub-humid zone. Both RADPAR and BIOMSS were below the 15YA by 2% and 5%, 1% and 2%, and 1% and 6% respectively for the three zones in their listed order.
根据作物生产,CropWatch将摩洛哥划分为三个农业生态区(AEZs):半湿润的北部山区,温暖的半干旱区和温暖的半湿润区。与过去15年同期平均水平相比,三个农业生态区的光合有效辐射和潜在生物量均低于平均水平,分别偏低2%和5%, 1%和2%, 1%和 6% 。
In the Sub-humid northern highlands and the Warm sub-humid zone, rainfall was below the 15YA by 35% and 39% respectively while the temperature was at the 15YA. The cropped arable land fraction (CALF) was above the 5YA by 11% and 8% respectively. The crop condition development graph based on NDVI indicates average conditions. The maximum VCI value for both zones was 0.62 and 0.61, which confirms the near-average conditions.
在半湿润的北部山区和温暖的半湿润区,与过去15年同期平均水平相比,降水量分别偏低35%和39%,而平均气温与平均水平持平。 与近5年同期平均水平相比,耕地种植比例分别偏高11%和8%。 基于NDVI的作物生长过程线以及两个区域最佳植被状况指数(分别为0.62和0.61),两个农业生态区的作物长势处于平均水平。。
In the Warm semiarid zone, rainfall was below the 15YA by 42% while the temperature was above the 15YA by 1°C. The CALF was below the 5YA by 13%. The crop condition development graph based on NDVI indicates below average conditions. The VCIx was at 0.42.
在温暖的半干旱区,与过去15年同期平均水平相比,降水量偏低42%,而平均气温偏高1°C。与近5年同期平均水平相比,耕地种植比例偏低13%。 基于NDVI的作物生长过程线显示,该区域作物长势低于平均水平。 最佳植被状况指数为0.42。
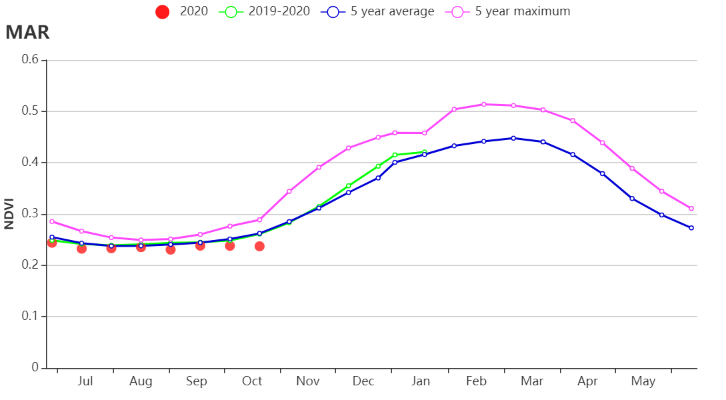
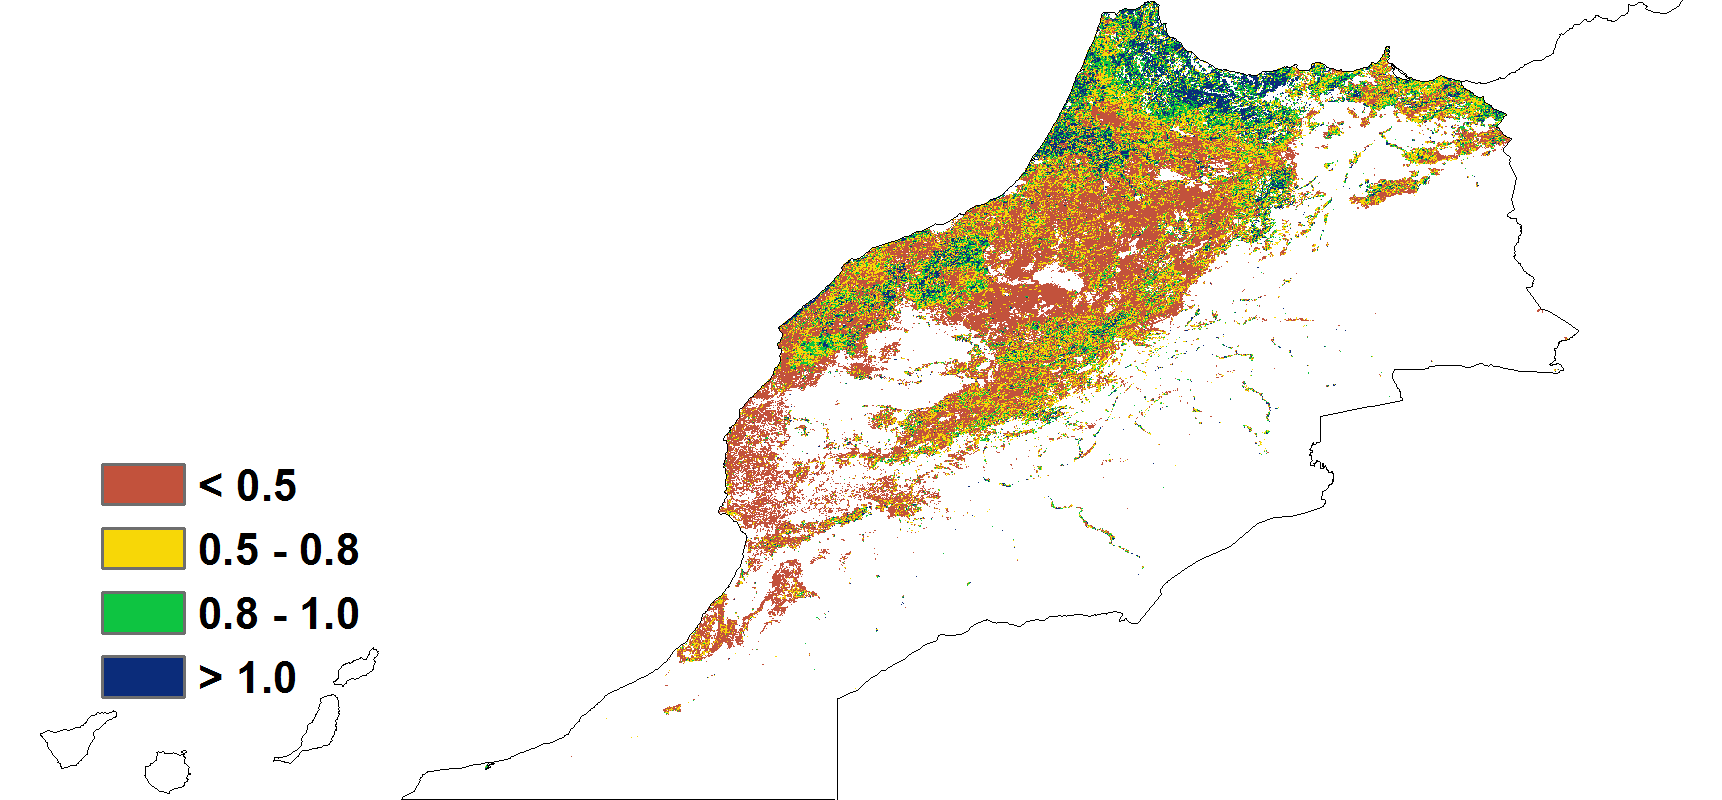
(b) 基于NDVI的作物生长过程线 (c) 最佳植被状况指数
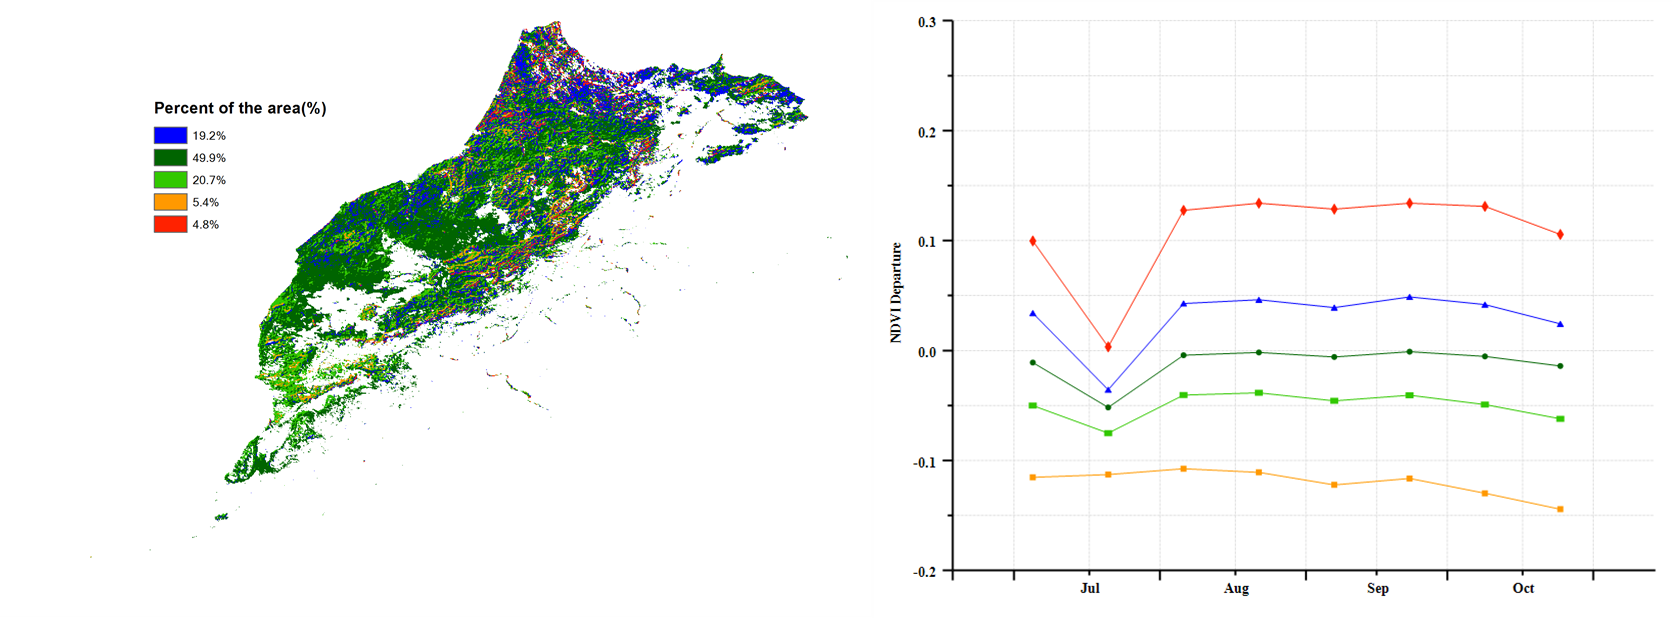
(d) NDVI距平空间聚类图(与5年平均相比) (e) NDVI距平聚类过程线
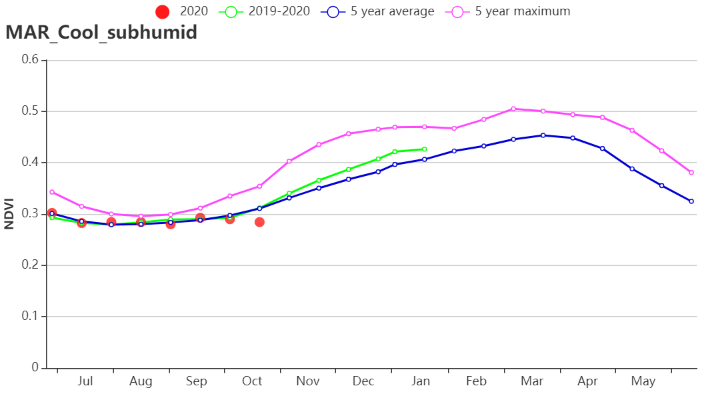
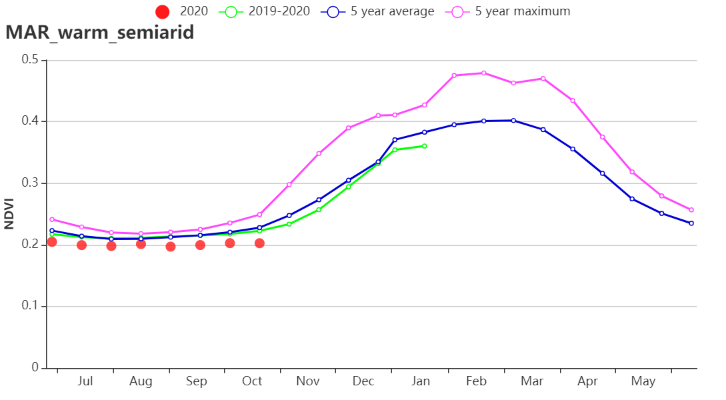
(f). 基于NDVI的作物生长过程线(寒冷半湿润地区(左)与温暖半干旱地区(右))
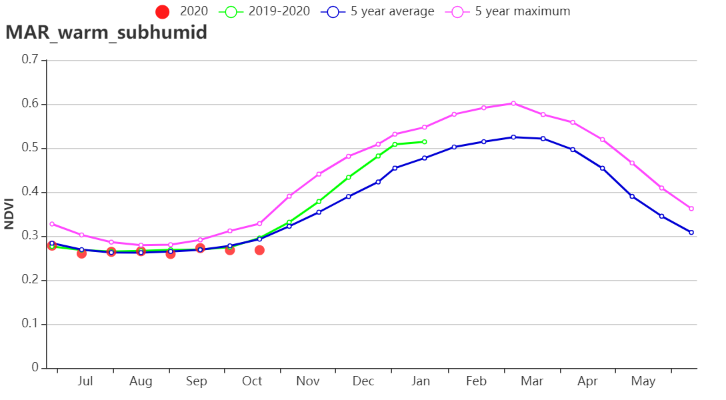
(h) . 基于NDVI的作物生长过程线(温暖半湿润地区)
(i) 降水时间序列过程线 (j)温度时间序列过程线
表3.47摩洛哥农业生态分区2020年7月-10月与过去15年(15YA)同期农业气象指标
累计降水 | 平均气温 | 光合有效辐射 | 潜在生物量 | |||||
区域 | 当前值(mm) | 距平 (%) | 当前值(°C) | 距平 (°C) | 当前值 (MJ/m2) | 距平 (%) | 当前值 (gDM/m2) | 距平 (%) |
半湿润的北部山区 | 68 | -35 | 23.0 | 0.0 | 1340 | -2 | 558 | -5 |
温暖的半干旱区 | 41 | -42 | 24.0 | 1.0 | 1355 | -1 | 587 | -2 |
温暖的半湿润区 | 61 | -39 | 23.0 | 0.0 | 1337 | -1 | 573 | -6 |
表3.48摩洛哥农业生态分区2020年7月-10月与近5年(5YA)同期农情指标
区域 | 耕地种植比例 | 复种指数 | 最佳植被状况指数 | ||
当前值(%) | 距平(%) | 当前值(%) | 距平(%) | 当前值 | |
半湿润的北部山区 | 19 | 11 | 105 | 1.16 | 0.62 |
温暖的半干旱区 | 2 | -13 | 101 | -0.59 | 0.42 |
温暖的半湿润区 | 14 | 8 | 102 | -1.16 | 0.61 |