This report covers the main maize and rice production period. They were harvested in October. It also covers the sowing of winter barley and wheat. Overall, crop conditions were generally favorable from July to October.
该监测期涵盖了玉米和水稻的生长与收获阶段,以及大麦和小麦的播种阶段。7月至10月期间作物长势良好。
RAIN was slightly below average (-2%), together with lower TEMP and RADPAR (-0.3°C and -3% respectively), which resulted in a decrease of BIOMSS (-1%), CropWatch agro-climatic Indicators (CWAIs) were close to average over the 15YA. The overall favorable conditions, together with a high VCIx (0.96) and a significant increase of the fraction of cropped arable land (+12%) indicate favorable production prospects for the summer crops.
与平均水平相比,降水量略偏低2%,气温和光合有效辐射分别偏低0.3°C和3%,潜在生物量偏低1%。CropWatch农气指标接近过去15年平均水平。全国平均最佳植被状况指数为0.97,耕地种植比例显著增加12%,预示着夏粮产量向好。
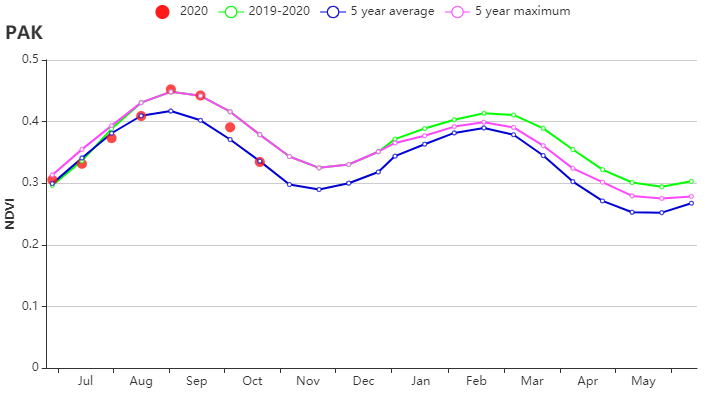
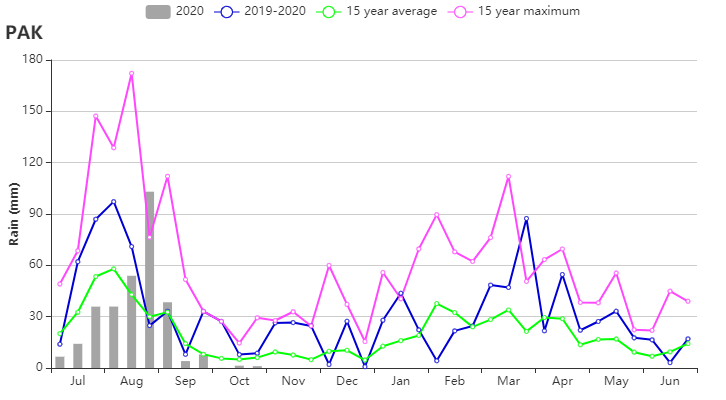
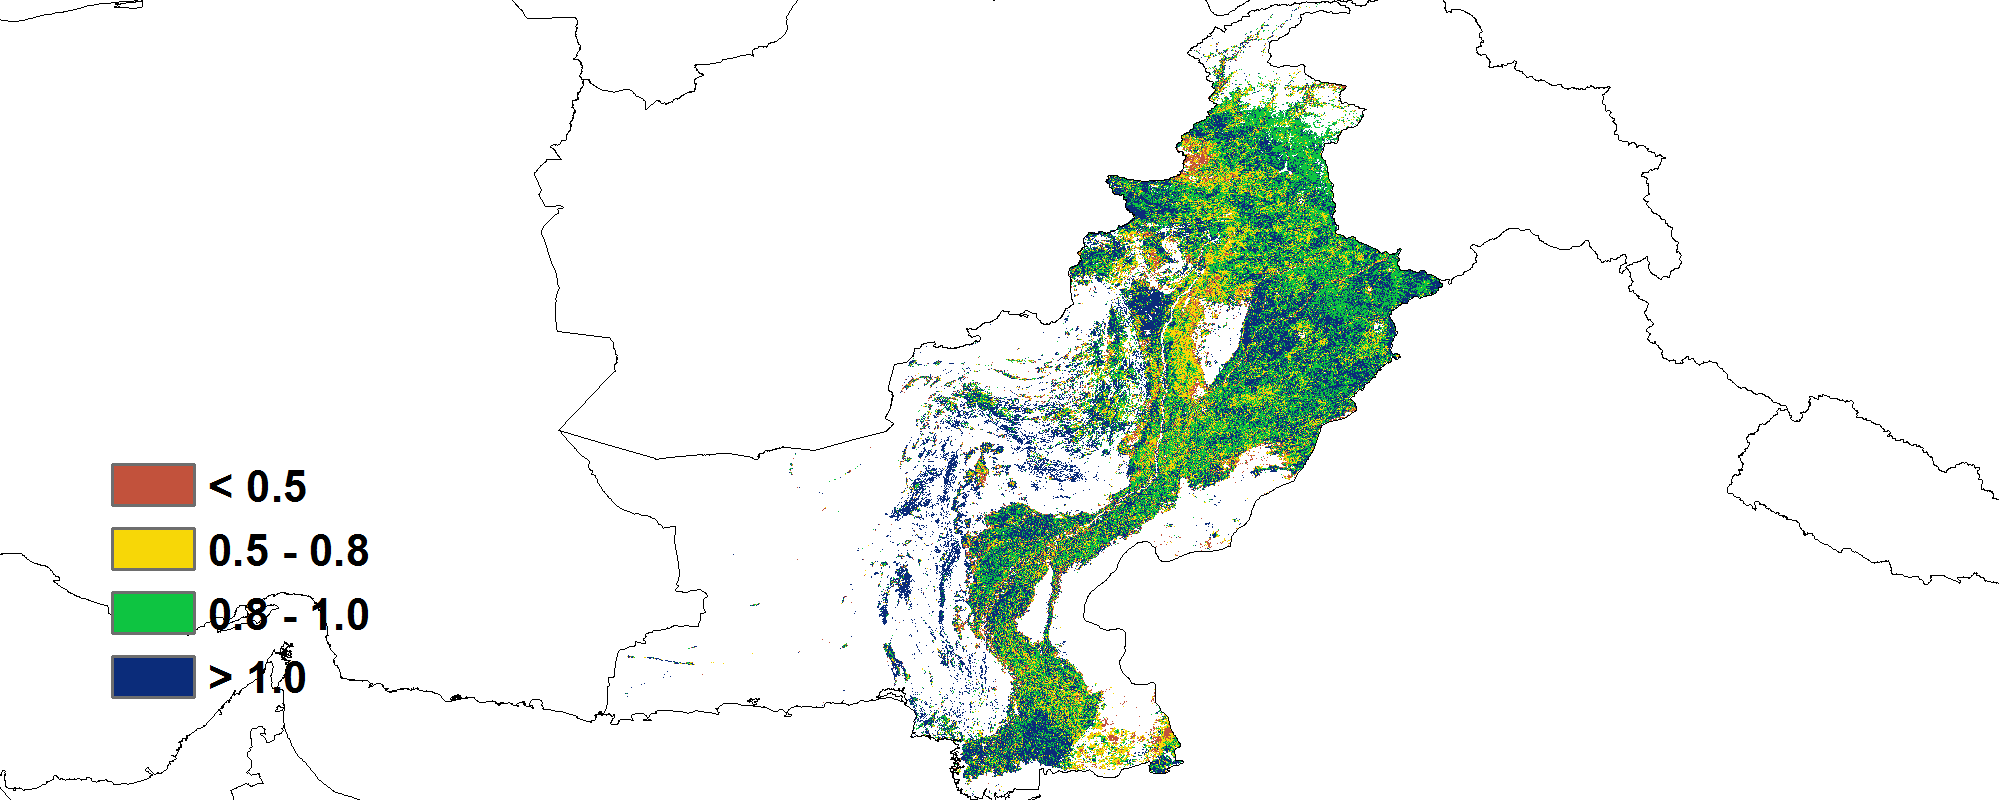
As shown by the nationwide NDVI development graph, crop conditions were close to average in July and August but later reached and even exceeded the maximum of 5YA in September, which was consistent with the time series profile of RAIN. According to the spatial NDVI patterns and profiles, 7.2% of the cropped areas presented continous below average conditions during the reporting period, which were mostly distributed along the rivers. This could be a result of flooding over the areas close to the rivers due to excessive rainfall. About 22.6% of cropland, concentrated in northern Pakistan, northern Multan and eastern Hyderabad, presented slightly below average conditions before August but recovered to average starting in September. Cropping Intensity for the whole country was 95%, which was 27% above average.
如全国NDVI作物生长过程线图所示,7-8月作物长势接近平均水平,随后充沛的降水促使作物生长加速,达到并超过过去5年最佳水平,与降水时间过程线反映的一致。NDVI距平空间聚类图显示,监测期内月约7.2%的耕地区域作物长势始终低于平均水平,主要分布在河流沿岸,这与过量降水造成的河流沿岸作物受淹有关。此外,22.6%的耕地区域(集中于巴基斯坦北部,木尔坦北部和海得拉巴东部)作物长势在8月份之前不及平均水平,但9月份长势逐渐恢复至平均水平。复种指数达到146%,高于平均水平1%。
Regional analysis 区域分析
For a more detailed spatial analysis, CropWatch subdivides Pakistan into three agro-ecological regions based essentially on geography and agroclimatic conditions: the Lower Indusbasin, the Northern highlands, and the Northern Punjab region.
为了更详细的进行空间分析,CropWatch基于地理和农业气候条件将巴基斯坦细分为三个农业生态区:印度河下游流域,北部高地和旁遮普邦北部地区。
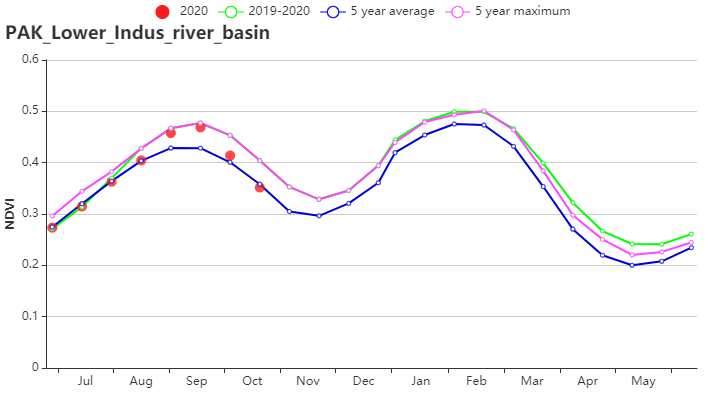
In the Lower Indus basin, RAIN was greatly above average (+80%) ,TEMP and RADPAR were below average by 0.1°C and 4% respectively. The estimated BIOMSS was 4% above average. NDVI was average in July and August, and later markedly above.The CALF value of 66% exceeds the average by 15% and a VCIx of 0.92 also indicates excellent crop conditions. Overall, the situation for the region is assessed as favorable.
在印度河下游流域,降水量显著偏高80%,气温和光合有效辐射分别低于平均值 0.1°C和3%,综合因素导致潜在生物量偏高4%。基于NDVI的作物生长过程线显示,7-8月作物长势低于平均水平,随后作物加速生长,长势超过近5年平均水平。耕地种植比例为66%,较2019年偏高15%,最佳植被状况指数为0.92, 表明作物长势总体优于近5年最佳水平。总体上,该地区的作物长势喜人。
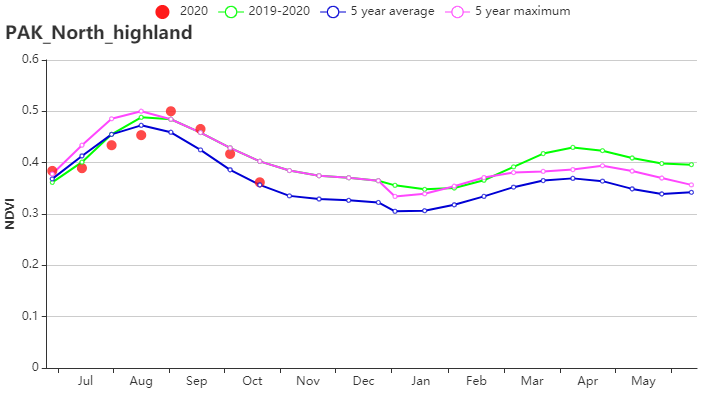
Compared to average, in the northern highland region, RAIN was above average by 5% and RADPAR and TEMP were below (-5% and -0.6°C respectively). BIOMSS decreased by 10%. The region also showed a low CALF of 65%, but still higher than the 5YA by 12%. The NDVI profile stayed below average during July to August and subsequently recovered. Overall, the situation for the region is deemed to be at least average.
北部高原地区的降水量偏高5%,光合有效辐射和气温分别减少5%和0.6°C,潜在生物量偏低10%。该地区的耕地种植比例相对较低,为65%,但仍显著高于过去5年平均水平(+12%)。基于NDVI的作物生长过程线显示,7-8月作物长势低于平均水平,随后逐渐恢复。总体而言,该地区的作物长势至少与平均水平持平。
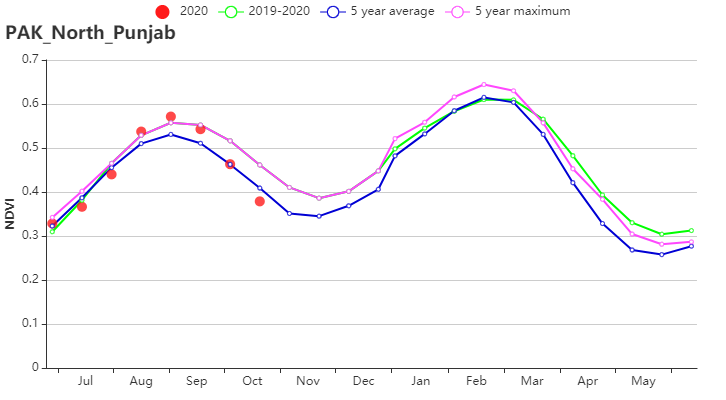
Northern Punjab, the main agricultural region of Pakistan, recorded below average RAIN (-21%). TEMP and RADPAR were below average (-0.2°C and -2% respectively). The resulting BIOMSS was 18% below average. The NDVI profile presented below average conditions during the July to August period, mainly due to a slow start of the monsoon rains. Heavy rainfall in August promoted crop growth and NDVI exceeded the maximum of 5YA from September to early October. In addition, CALF in this area reached 84%, which was up by 7% compared to 2019, and VCIx was at 0.94. Overall, the crop production potential for the region is assessed as favorable.
巴基斯坦主要农业区北部旁遮普邦的降水量显著偏低21%。气温和光合有效辐射分别偏低0.2°C和2%,潜在生物量偏低18%。基于NDVI的作物生长过程线显示,7-8月作物长势低于平均水平,主要由于季风雨季推迟。此外,该地区的耕地种植比例为84%(比2019年偏高7%),最佳植被状况指数达到0.94。总体而言,该地区的作物长势看好。
Figure 3.23. Pakistan crop condition, July - October 2020
图 3.23. 2020 年 7-10月巴基斯坦作物长势
(a) Phenology of major crops 主要作物物候历
(b) Crop condition development graph based on NDVI and time series rainfall profile 基于 NDVI 的作物生长过程线和降水时间过程线
(c) Maximum VCI 最佳植被状况指数
(d) Spatial NDVI patterns compared to 5YA NDVI 距平空间聚类图 (e) NDVI profiles NDVI 距平聚类过程线
(f) Crop condition development graph based on NDVI (Lower Indus River Basin) 基于 NDVI 的作物生长过程线(印度河下游地区)
(g) Crop condition development graph based on NDVI (Northern Highland)基于 NDVI 的作物生长过程线(北部山区)
(h) Crop condition development graph based on NDVI (Northern Punjab) 基于 NDVI 的作物生长过程线(北部旁遮普邦 )
Table 3.56. Pakistan agroclimatic indicators by agro-ecological region, current season's value and departure, July - October 2020
巴基斯坦农业生态分区 2020年 7 -10 月与过去 15 年(15YA)同期农业气象指标
分区 | 累计降水 | 平均气温 | 光合有效辐射 | 潜在生物量 | ||||
当前值(mm) | 距平(%) | 当前值 (°C) | 距平 (°C) | 当前值 (MJ/m2) | 距平 (%) | 当前值 (gDM/m2) | 距平(%) | |
印度下游流域 | 261 | 80 | 32.8 | -0.1 | 1265 | -4 | 591 | 2 |
北部山区 | 375 | 5 | 20.9 | -0.6 | 1309 | -5 | 537 | -10 |
北部旁遮普邦 | 281 | -21 | 30.7 | -0.2 | 1239 | -2 | 611 | -18 |
Table 3.57. Pakistan agronomic indicators by agro-ecological region, current season's value and departure, July - October 2020
巴基斯坦农业生态分区 2020年 7 -10 月与过去 5 年(5YA)同期农情指标
分区 | 耕地种植比例 | 复种指数 | 最佳植被状况指数 | ||
当前值(%) | 距平 (%) | 当前值 (%) | 距平 (%) | 当前值 | |
印度下游流域 | 66 | 15 | 157 | 1 | 0.92 |
北部山区 | 65 | 12 | 132 | 3 | 0.95 |
北部旁遮普邦 | 84 | 7 | 177 | 3 | 0.94 |