This report summarizes the rice production conditions in Vietnam. Summer and autumn rice harvesting has been completed, while late rice is still in its growing season. Precipitation over the nation increased nearly 13% as compared to the 15-year average. South Central Coast (+25%) and Northern Vietnam(+21%) are the two regions received the highest precipitation, which alleviated the drought condtions which were observed during the previous reporting period. Apart from precipitation, temperature (+0.2 °C) and RADPAR (-+%) were slightly above average. 
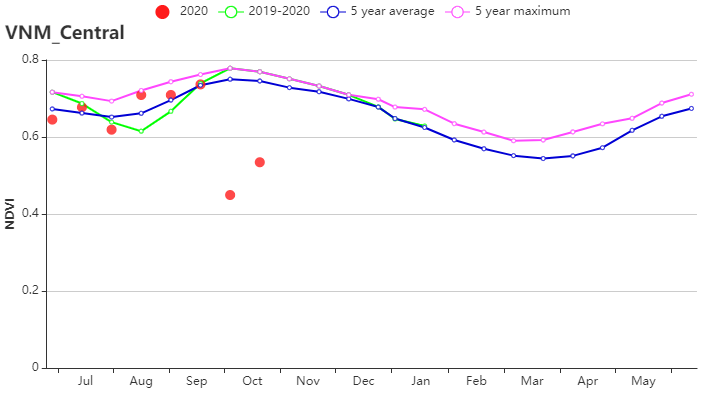
本报告涵盖越南大米的生长状况,监测期内夏秋水稻收割完成,而晚稻仍处于生长期。 与过去15年同期平均水平相比,全国降水量偏高13%, 中南部沿海地区(偏高25%)和越南北部(偏高 21%)为降水最高的地区,这缓解上期报告所述的干旱情况。 除降水量外,平均气温(偏高0.2°C)和光合有效辐射(偏高1%)略高于平均水平。 Crop condition development based on NDVI was significantly lower than the 5YA. Apart from the Red river Delta and the North West region , all the regions had a similar pattern of NDVI, starting close to the average and ending below average in October. VCIx was generally above 0.8, except for the South Central Coast and the coastal provinces of the Mekong Delta where VCIx was low. The CALF was stable as compared to the recent five-year average. Vietnam was hit by a series of typhoons in October. Most of the rice had been harvested by then.Due to slightly unfavorable crop conditions and stable cropped areas, crop outputs are estimated to be slightly below normal 基于NDVI的作物生长过程线明显低于近5年平均水平, 除红河三角洲和西北部外,所有地区NDVI变化趋势均相似,初始期接近平均值随后在10月份低于平均水平。 除中南部沿海地区和湄公河三角洲部分省份(VCIx较低)以外,最佳植被状况指数(VCIx)均高于0.8。 与近5年同期平均水平相比,耕地种植比例保持稳定。十月份越南遭受了一系列台风侵袭,而大部分稻子已经收割完毕。 总体而言,略有不利的作物生长条件以及稳定的作物种植面积使得作物产量略微低于正常水平。 Regional analysis Based on cropping systems, climatic zones and topographic conditions, several agro-ecological zones (AEZ) can be distinguished for Vietnam: North Central Coast (202), North East (203), Red River Delta (204), South East (205), South Central Coast (206), North West (207), Central highlands (208), Mekong River Delta (209). 区域分析 根据种植制度、气候带和地形条件,越南可以划分出几个农业生态区:中部高原区(202)、湄公河三角洲(203)、中北部沿海地区(204)、东北部(205)、西北部(206)、红河三角洲(207)、中南部沿海地区(208)、东南部(209)。 During this reporting period, the rainy season rice crop cultivation in the North Central Coast passed through 3 phases: sowing, growing and harvesting. RAIN was 21% above average, while the temperature was 24.1℃, an increase by 0.5℃ as compared to the 15YA. RADPAR was below average (-2%) and BIOMASS was above average (+ 6%). The crop conditions were below average from July to September. Overall, VCIx was 0.94 and CALF was close to average, indicating moderate conditions in this region. 报告所述期间,中北部沿海地区的雨季水稻历经三个阶段:播种、生长和收获。 与过去15年同期平均水平相比,降水量偏高21%,温度(24.1℃)偏高0.5℃。光合有效辐射偏低2%,潜在生物量偏高 6%, 7月至9月的作物长势低于平均水平。总体而言,最佳植被状况指数为0.94,耕地种植比例接近平均值,表明该地区作物生长条件较为良好。 In the North West, the average rainfall was 21% above average and TEMP was also higer (+0.2℃) as compared to the 15YA. RADPAR was below average (-4%). In general, the climate condition pattern showed a small departure from the 15-year baseline. BIOMSS was above average (+ 2%) and the VCIx was in the range of 0.8 -1. The NDVI profiles in the region showed spatial variations, and the values of this indicator decreased between July and September. The CALF reached 100% and was stable compared the to 5 year average. Generally, the crop condition in the North West would be not good. 与过去15年同期平均水平相比,西北部降水量偏高21%,平均气温偏高 0.2℃。光合有效辐射偏低4%。气候条件与15年基准线相比偏差较小。 潜在生物量偏高 2%,最佳植被状况指数处于0.8 -1的范围内。 基于的NDVI的距平聚类图显示出该区域的NDVI的空间变化,其值在7月至9月之间下降。 耕地种植比例达到100%,与5年平均水平相比稳定。 总的来说西北地区作物生长条件较差。 与过去15年同期平均水平相比,红河三角洲降水量和平均气温分别偏高 9%和0.1℃,最佳植被状况指数为0.92,光合有效辐射偏低6%,潜在生物量偏低6%。基于NDVI的作物生长过程线在0.3到0.7之间波动明显。 耕地种植比例偏高1%。 总体而言该区的作物生长条件较差。 In the South East, total rainfall was 1553 mm, 2% below 15YA. Temperature was 25.4°C (+0.3°C). RADPAR was higher than average (+2%). BIOMSS was above average (+2%) as well. The crop condition graph based on NDVI presented some below-average values. Overall, VCIx (0.95) and CALF (+1%) indicated normal conditions in this region. 与过去15年同期平均水平相比,东南部总降水量约为1553毫米(偏低2%),平均气温为25.4℃(偏高 0.3℃),光合有效辐射偏高 2%,潜在生物量偏高2%。 基于NDVI的作物生长过程线低于平均水平。总体而言,最佳植被状况指数(0.95)和耕地种植比例(偏高1%)表明该地区作物生长条件处于正常水平。 During this reporting period, the summer-autumn rice crop in the South Central Coast reached maturity. Most of the crop was harvested before the typhoons hit the region. RAIN was 25% above average, while TEMP was 23.7°C(0.4°C) and RADPAR (+4%) were above average. BIOMSS was also above average (+4%). The crop conditions were below average from July to September. VCIx (0.89) and CALF (96%), in combination with the other CropWatch indicators, presented generally favorable crop conditions. 报告所述期间中南部沿海地区的夏秋季水稻已成熟,大部分农作物在台风侵袭之前已收割完毕。 与过去15年同期平均水平相比,降水量偏高25%,平均气温为23.7℃(偏高0.4℃),光合有效辐射偏高4%,潜在生物量偏高4%。基于NDVI的作物生长过程线显示 7月至9月作物生长条件低于平均水平。结合最佳植被状况指数(0.89)、耕地种植比例(96%)与其他CropWatch指标,表明该区域作物生长条件良好。 The summer-autumn rice crop in the Central Highlands passed through 2 phases: sowing and growing. RAIN was 3% above average and TEMP was 22.8℃(+0.2℃) as compared to the 15YA. RADPAR was above average (+12%). Despite the big reduction in rainfall, BIOMASS was above average (+9%). The crop conditions were below average . Overall, high VCIx (0.98) and stable CALF(100%) indicated moderate conditions in this region. 中部高原区的夏秋水稻作物历经两个阶段:播种和生长。与过去15年同期平均水平相比,降水量偏高3%,平均气温为22.8℃(偏高 0.2℃)。光合有效辐射偏高12%, 尽管降水量大量减少,但潜在生物量仍偏 9%,作物生长条件低于平均水平。 总体而言,较高的最佳植被状况指数(0.98)和稳定的耕地种植比例(100%)表明该区域作物生长条件处于中等水平。 During this reporting period, the Spring-Winter rice crop in the Mekong River Delta had reached maturity and got harvested in October. RAIN (+7%) and TEMP (+0.1℃) were above average. RADPAR stayed near average (0%) and BIOMSS was slightly below average (-1%). The crop condition graph based on NDVI was below average during the previous monitoring period and stayed below average during this period as well. The poor water supply from the Mekong River continued to have a detrimental effect on rice production in the delta. VCIx (0.88) and CALF (86%) indicated unsatisfactory conditions in this region. 报告所述期间湄公河三角洲的春冬水稻作物已经成熟,并于10月收获。与过去15年同期平均水平相比,降水量和平均气温分别偏高7%和0.1℃,光合有效辐射接近平均水平,潜在生物量略微偏低1% 。基于NDVI的作物生长过程线与在上一个监测期保持一致,均低于平均水平。 湄公河接连的供水不足对三角洲的稻米生产造成不利影响,最佳植被状况指数(0.88)和耕地种植比例(86%)表示该地区作物生长条件不理想。 |
图3.43 2020年7月-10月越南作物长势
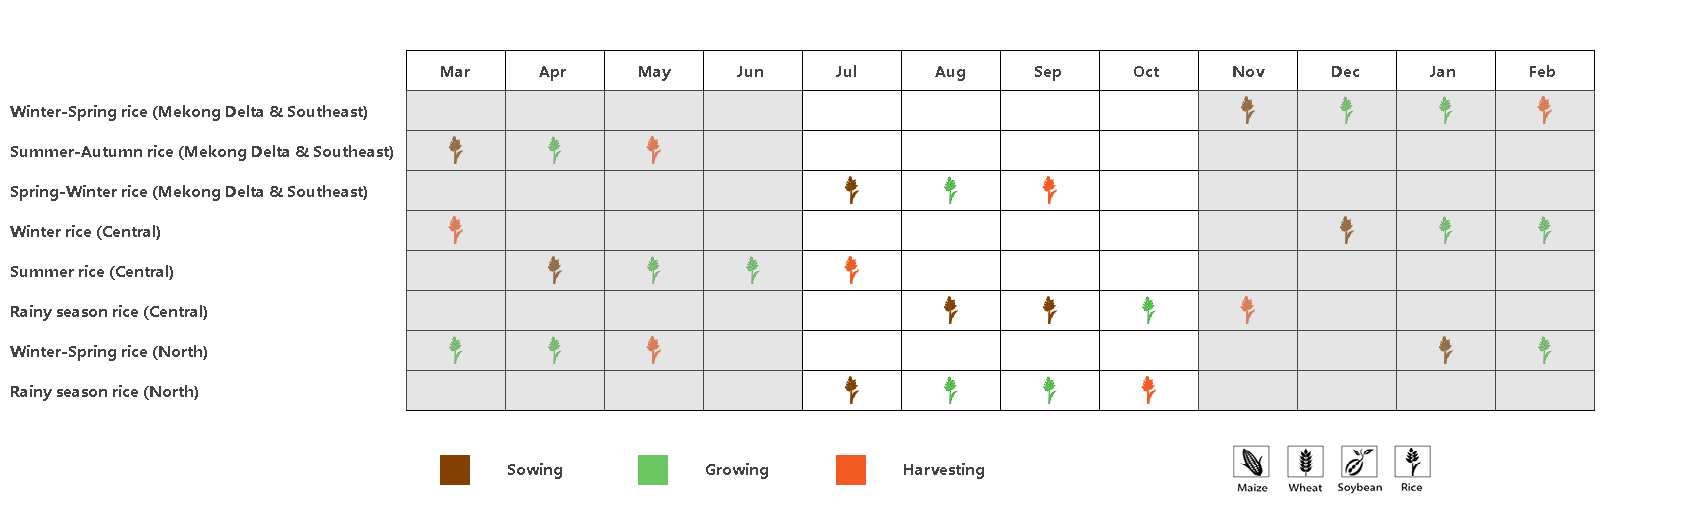
(a). 主要作物物候历
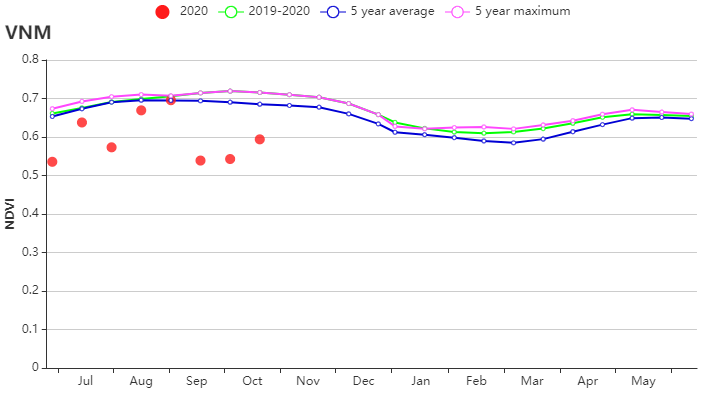
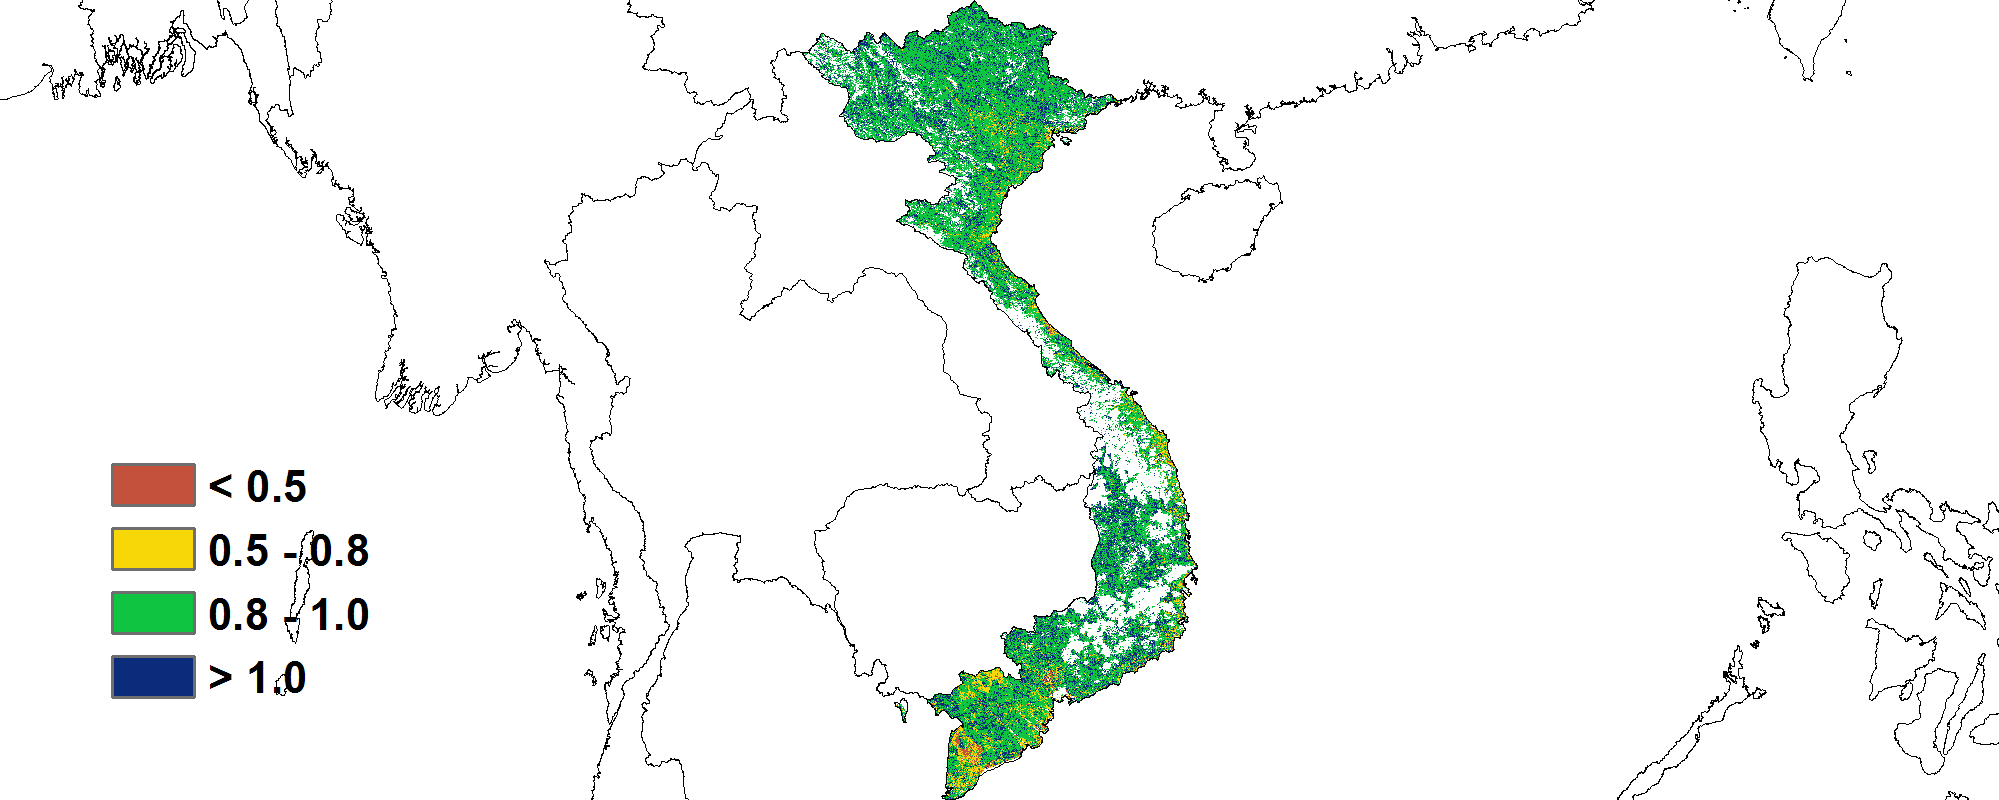
(b) 基于NDVI的作物生长过程线 (c)最佳植被状况指数(VCI)
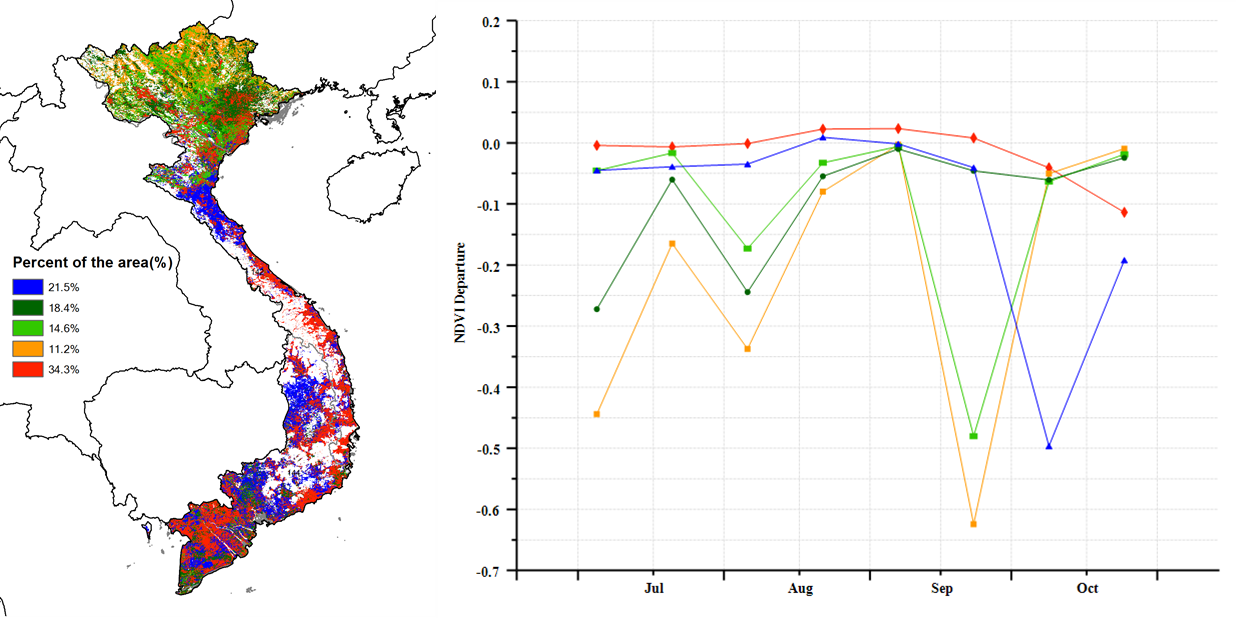
(d)NDVI距平空间聚类图(与5年平均相比) (e) NDVI 距平聚类过程线
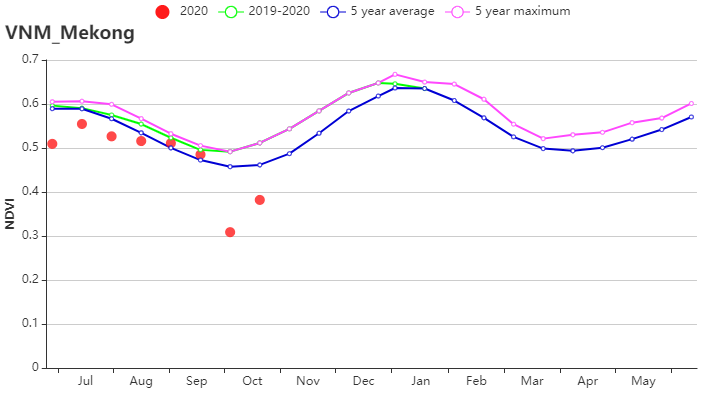
(f) 基于NDVI的作物生长过程线(越南中部高原区(左)和湄公河三角洲(右))
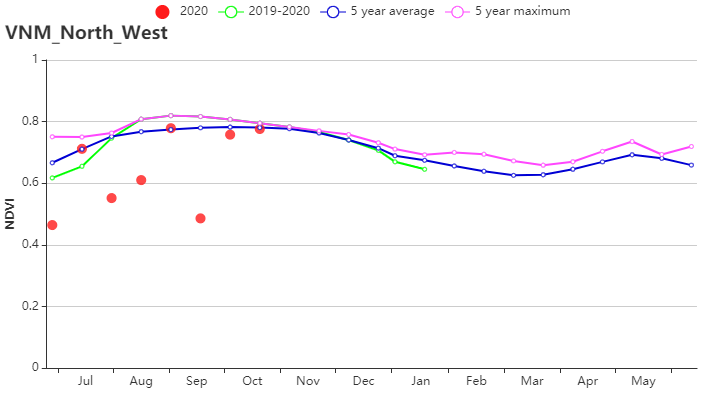
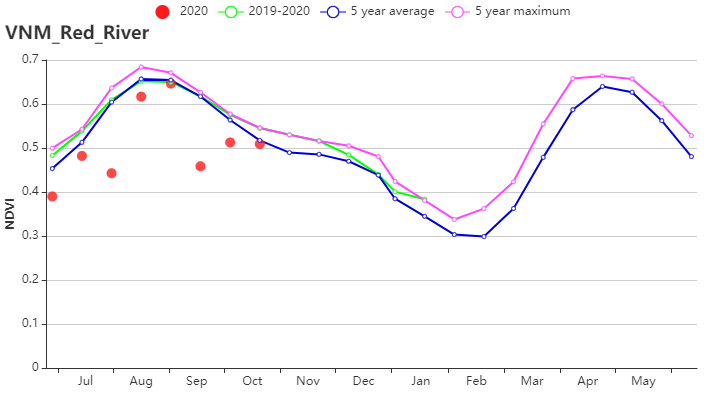
(g) 基于NDVI的作物生长过程线(越南西北部(左)和红河三角洲(右))
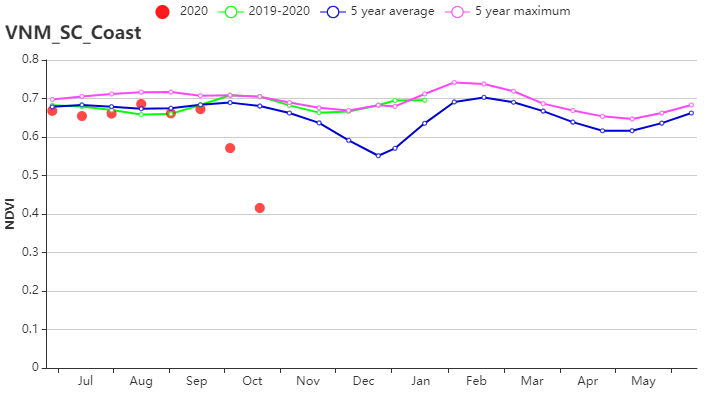
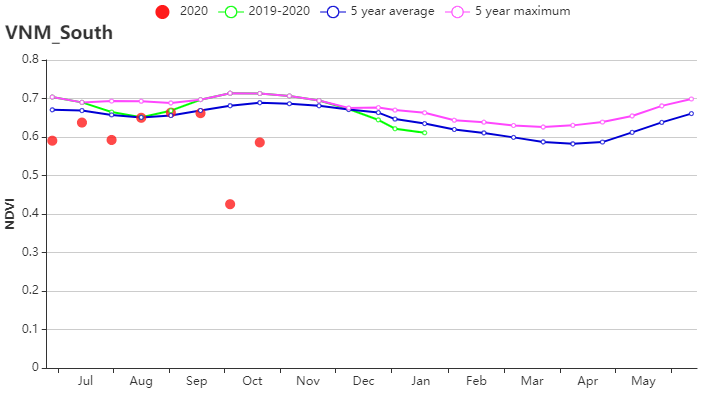
(h) 基于NDVI的作物生长过程线(越南中南部沿海地区(左)和越南东南部(右))
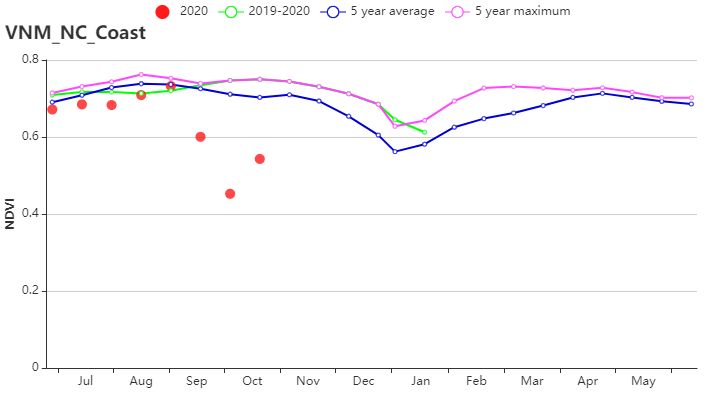
(i) 基于NDVI的作物生长过程线(越南中北部沿海地区)
表3.77 越南农业生态分区2020年7月-10月与过去15年(15YA)同期农业气象指标
累积降水 | 平均气温 | 光合有效辐射 | 潜在生物量 | ||||||||
当前值 (mm) | 距平 (%) | 当前值 (°C) | 距平 (%) | 当前值 (MJ/m2) | 距平 (°C) | 当前值 (gDM/m2) | 距平 (%) | ||||
越南中部高原区 | 1555 | 3 | 22.8 | 0.2 | 1105 | 9 | 685 | 10 | |||
湄公河三角洲 | 1428 | 7 | 26.9 | 0.1 | 1194 | 0 | 818 | -1 | |||
越南中北部沿海地区 | 1689 | 21 | 24.1 | 0.5 | 1041 | -2 | 671 | 0 | |||
越南东北部 | 1784 | 21 | 23.3 | -0.1 | 1014 | -8 | 641 | -7 | |||
越南西北部 | 1490 | 21 | 21.9 | 0.1 | 1016 | -4 | 606 | -3 | |||
红河三角洲 | 1587 | 9 | 26.4 | 0.1 | 1088 | -6 | 735 | -6 | |||
越南中南部沿海地区 | 1579 | 25 | 23.7 | 0.4 | 1097 | 4 | 701 | 4 | |||
越南东南部 | 1553 | -2 | 25.4 | 0.3 | 1160 | 2 | 781 | 2 | |||
表3.78 越南农业生态分区2020年7月-10月与近5年(5YA)同期农情指标
Region | Cropped arable land fraction | Cropping intensity | Maximum VCI | |||
Current | Departure from 5YA (%) | Current(%) | Departure from 5YA(%) | Current | ||
Central Highlands | 100 | 0 | 108 | -15 | 0.98 | |
Mekong River Delta | 86 | -1 | 174 | 2 | 0.88 | |
North Central Coast | 98 | 0 | 131 | -1 | 0.94 | |
North East | 100 | 0 | 138 | 10 | 0.97 | |
North West | 100 | 0 | 112 | -8 | 0.98 | |
Red River Delta | 97 | 1 | 146 | -4 | 0.92 | |
South Central Coast | 96 | 0 | 136 | -4 | 0.89 | |
South East | 96 | 1 | 110 | -16 | 0.95 |