
 English
 中文

Bulletin
CropWatch bulletinMenu
Authors: qinxl,lirui | Edit: Miao
1.1.1 Global Crop Production Index
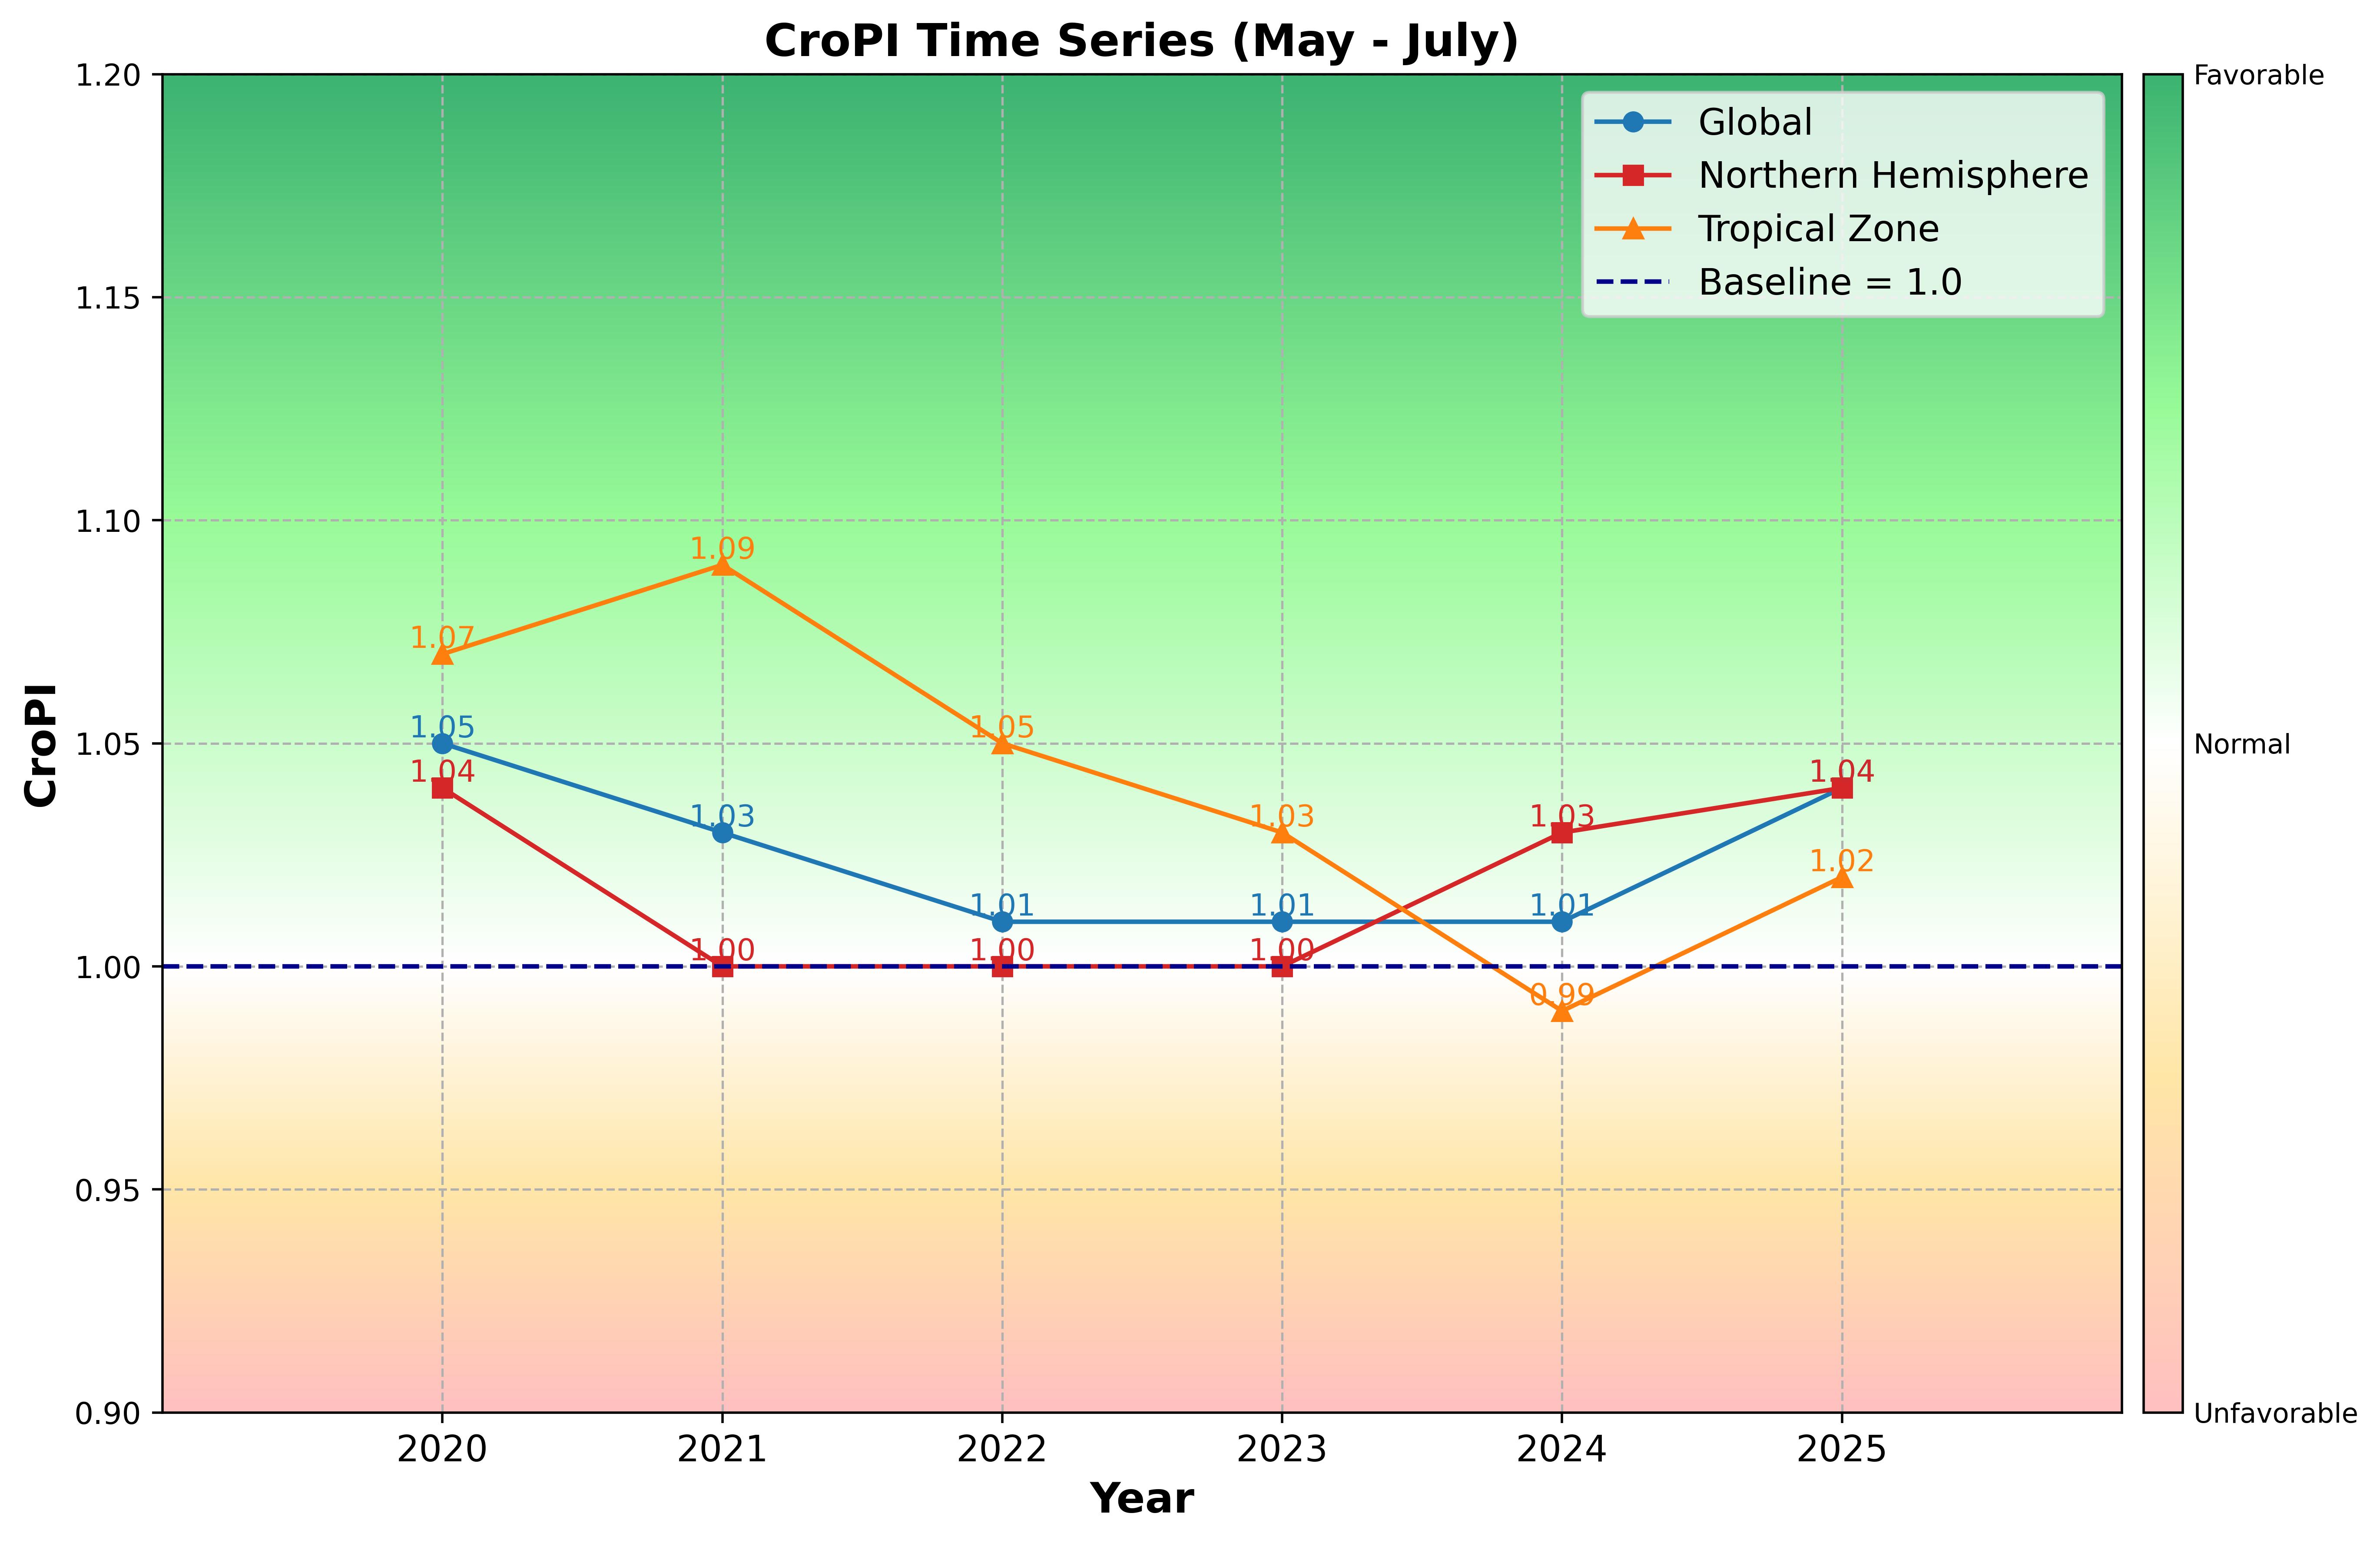
Figure 1.1 Time Series Trends of Regional CroPI, May–July 2020–2025 (This period focuses on the Northern Hemisphere and tropical regions)
From May to July 2025, the main growing and harvesting season for summer crops in the Northern Hemisphere and the rainy season for major staple crops in tropical regions, monitoring focused on agricultural production conditions in the Northern Hemisphere and the tropics, while the Southern Hemisphere was in an off-season. During this period, the Global Crop Production Index (CroPI) reached 1.04, significantly higher than the baseline of 1.0 and marking the highest value in the past five years, second only to the 1.05 recorded in 2020. The CroPI for the Northern Hemisphere was 1.04, a slight increase from 1.01 in the previous year, while the tropical CroPI was 1.02, remaining essentially unchanged from last year. Overall, global conditions were slightly better than average (Figure 1.1).
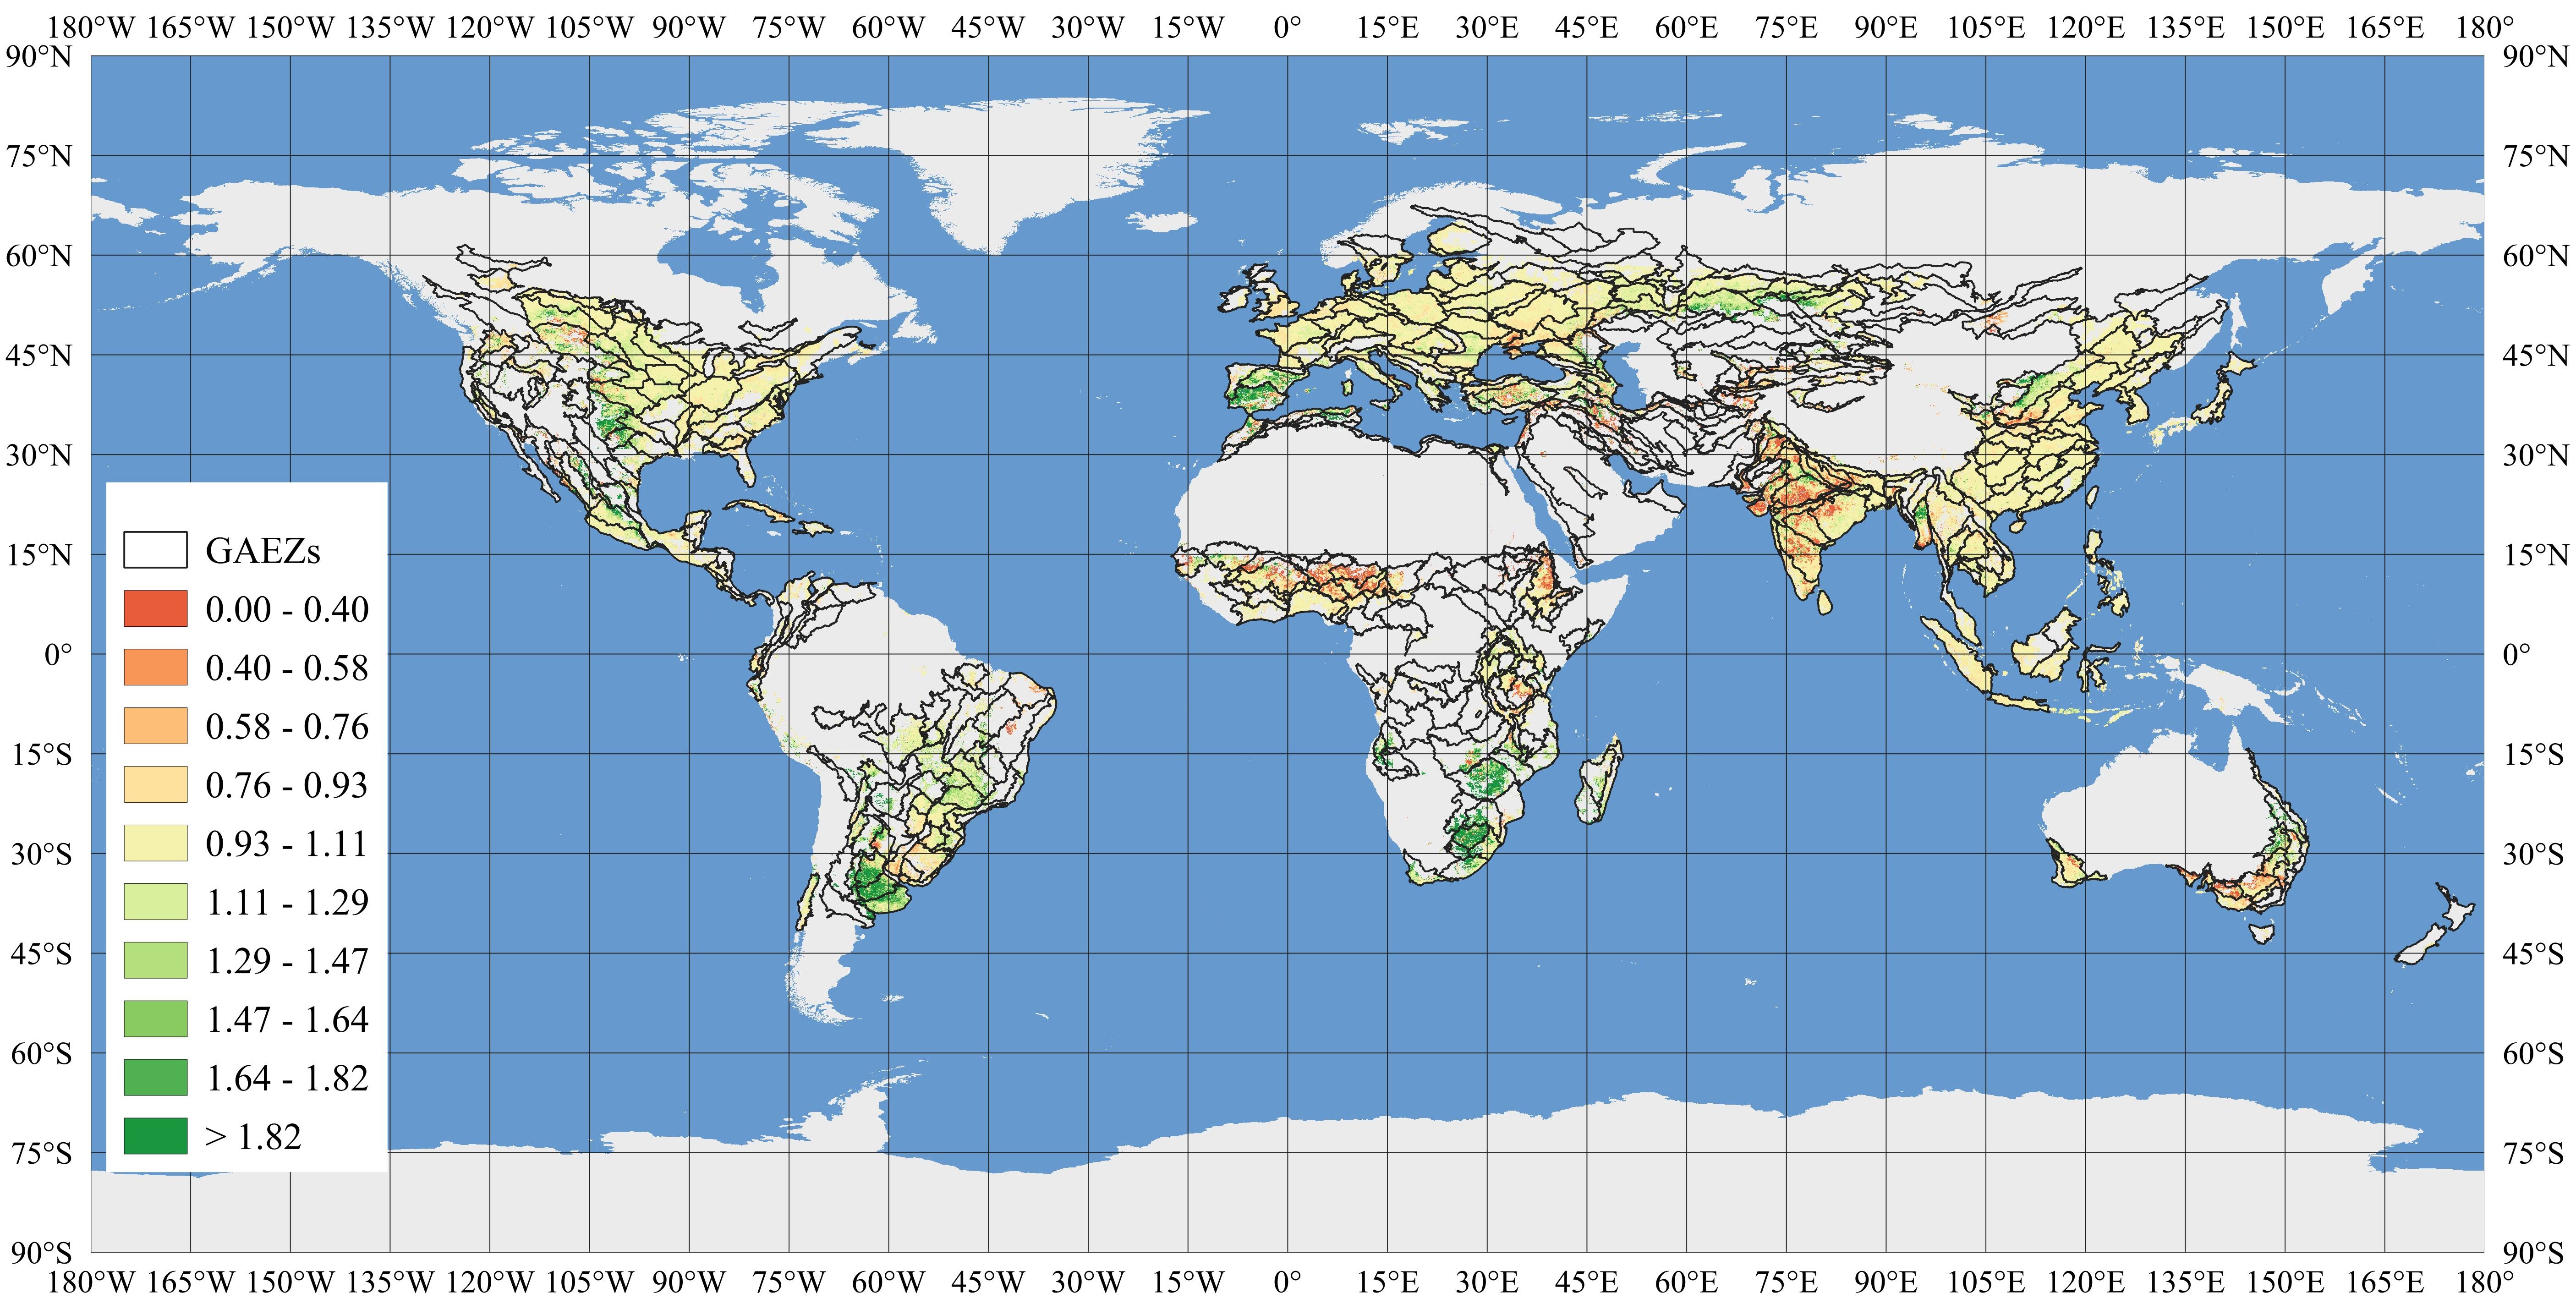
Figure 1.2 Global CroPI Distribution Map, May–July 2025
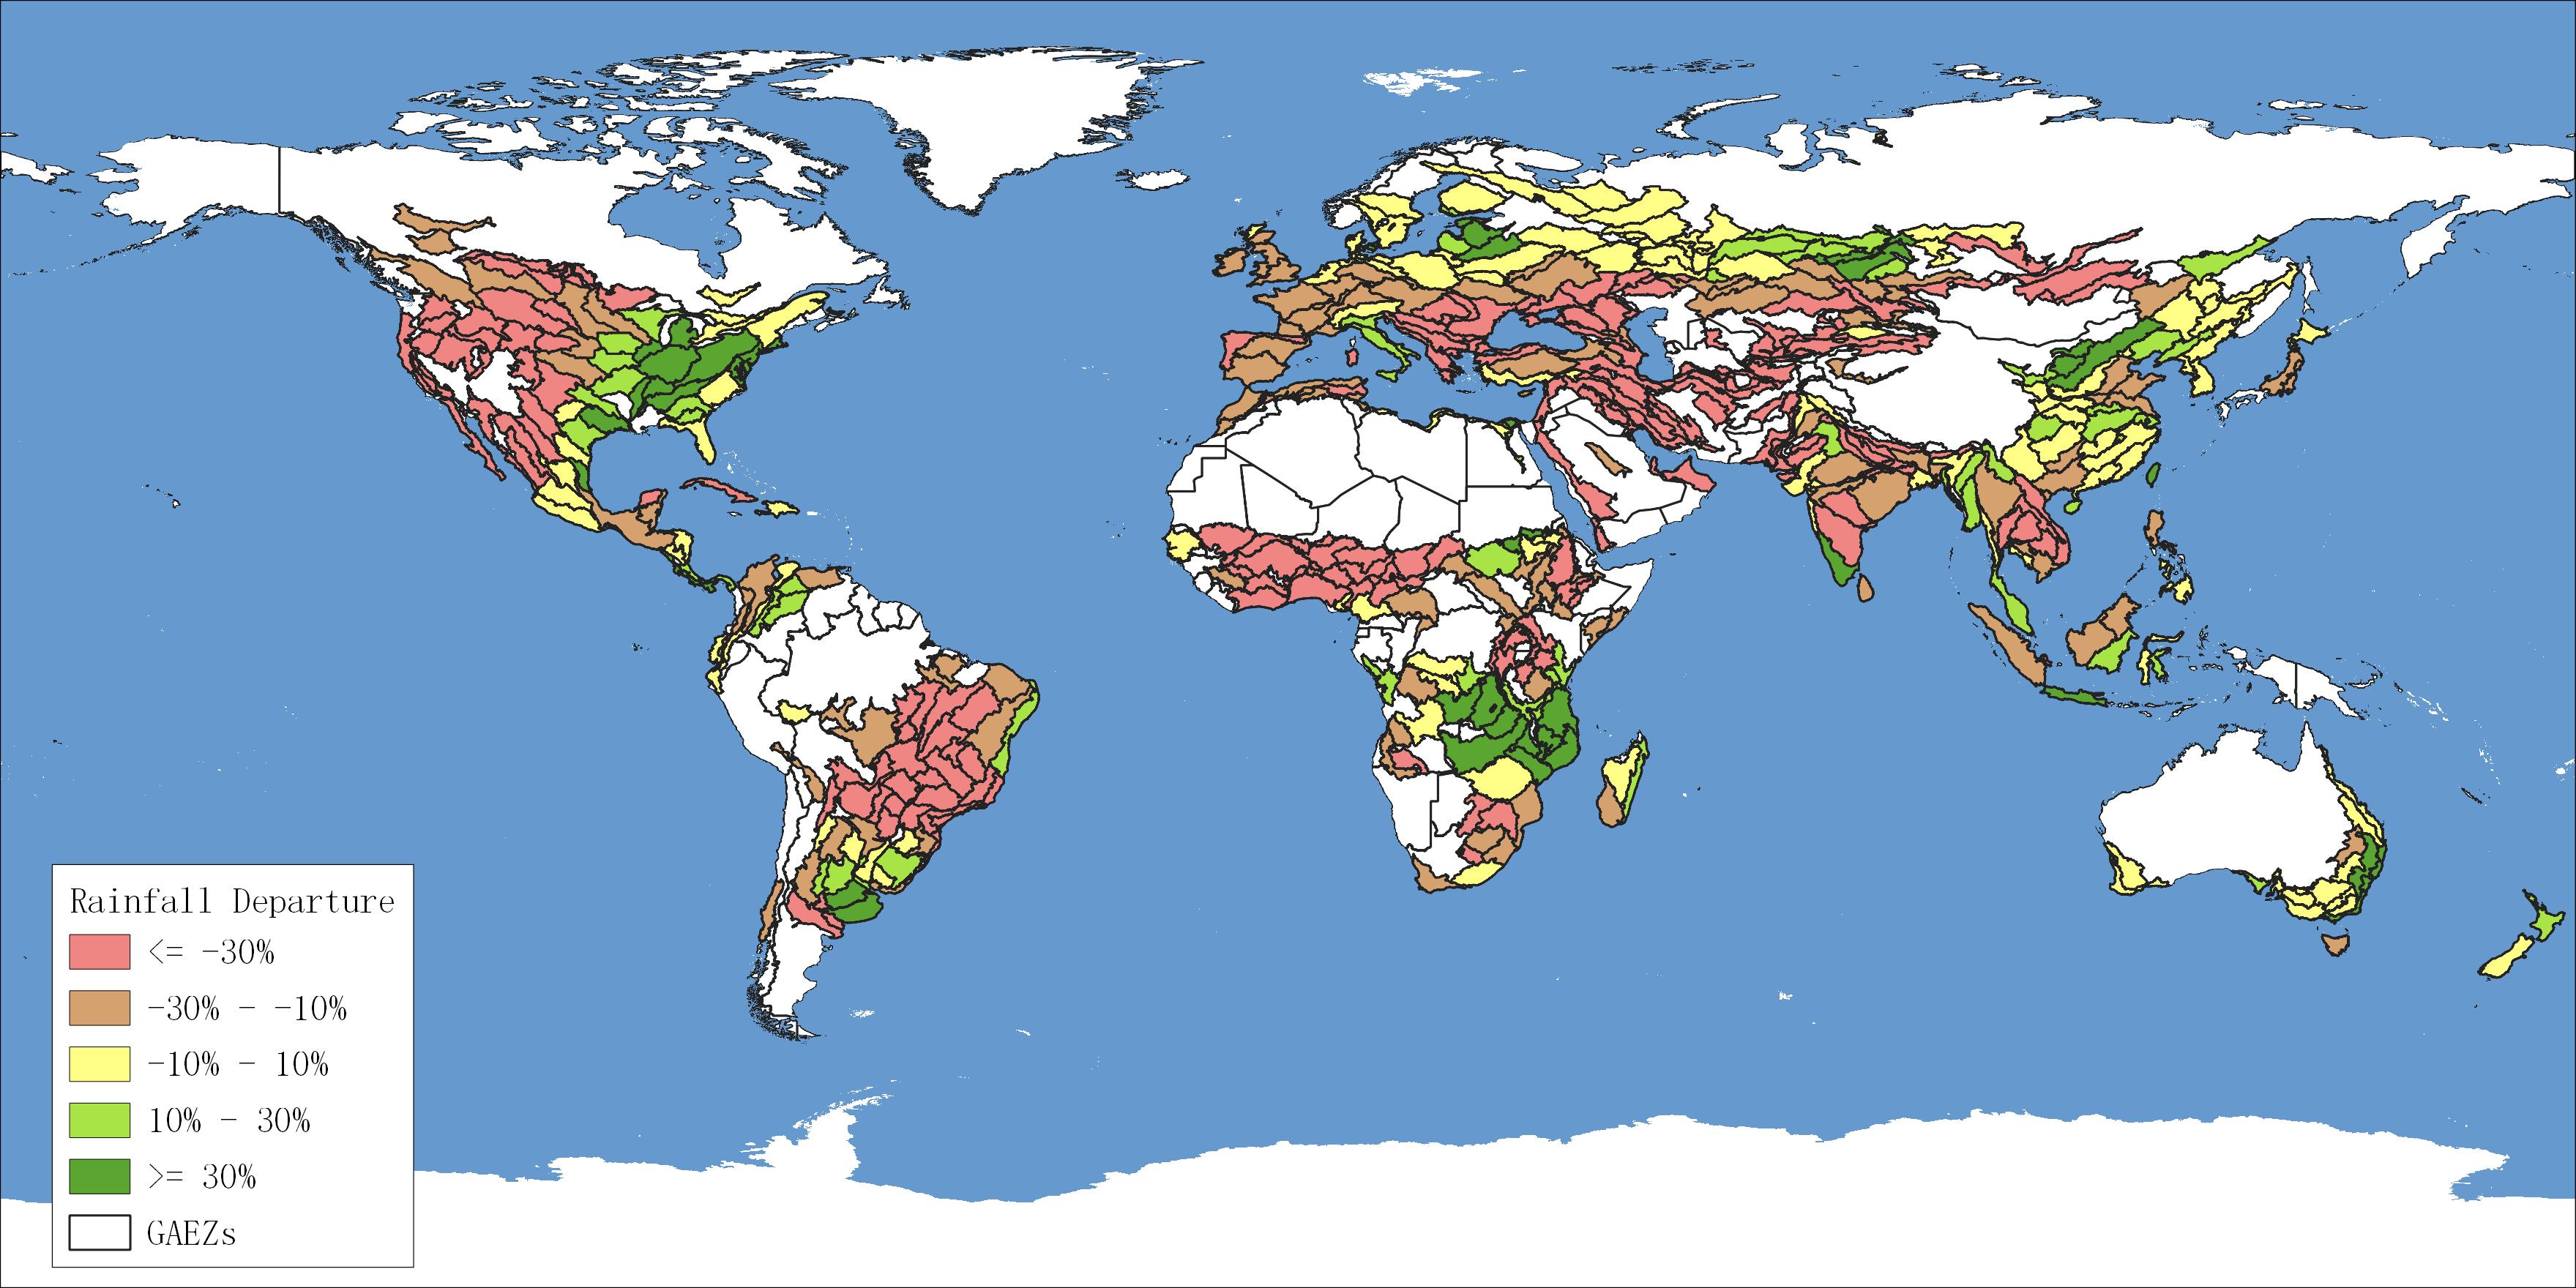
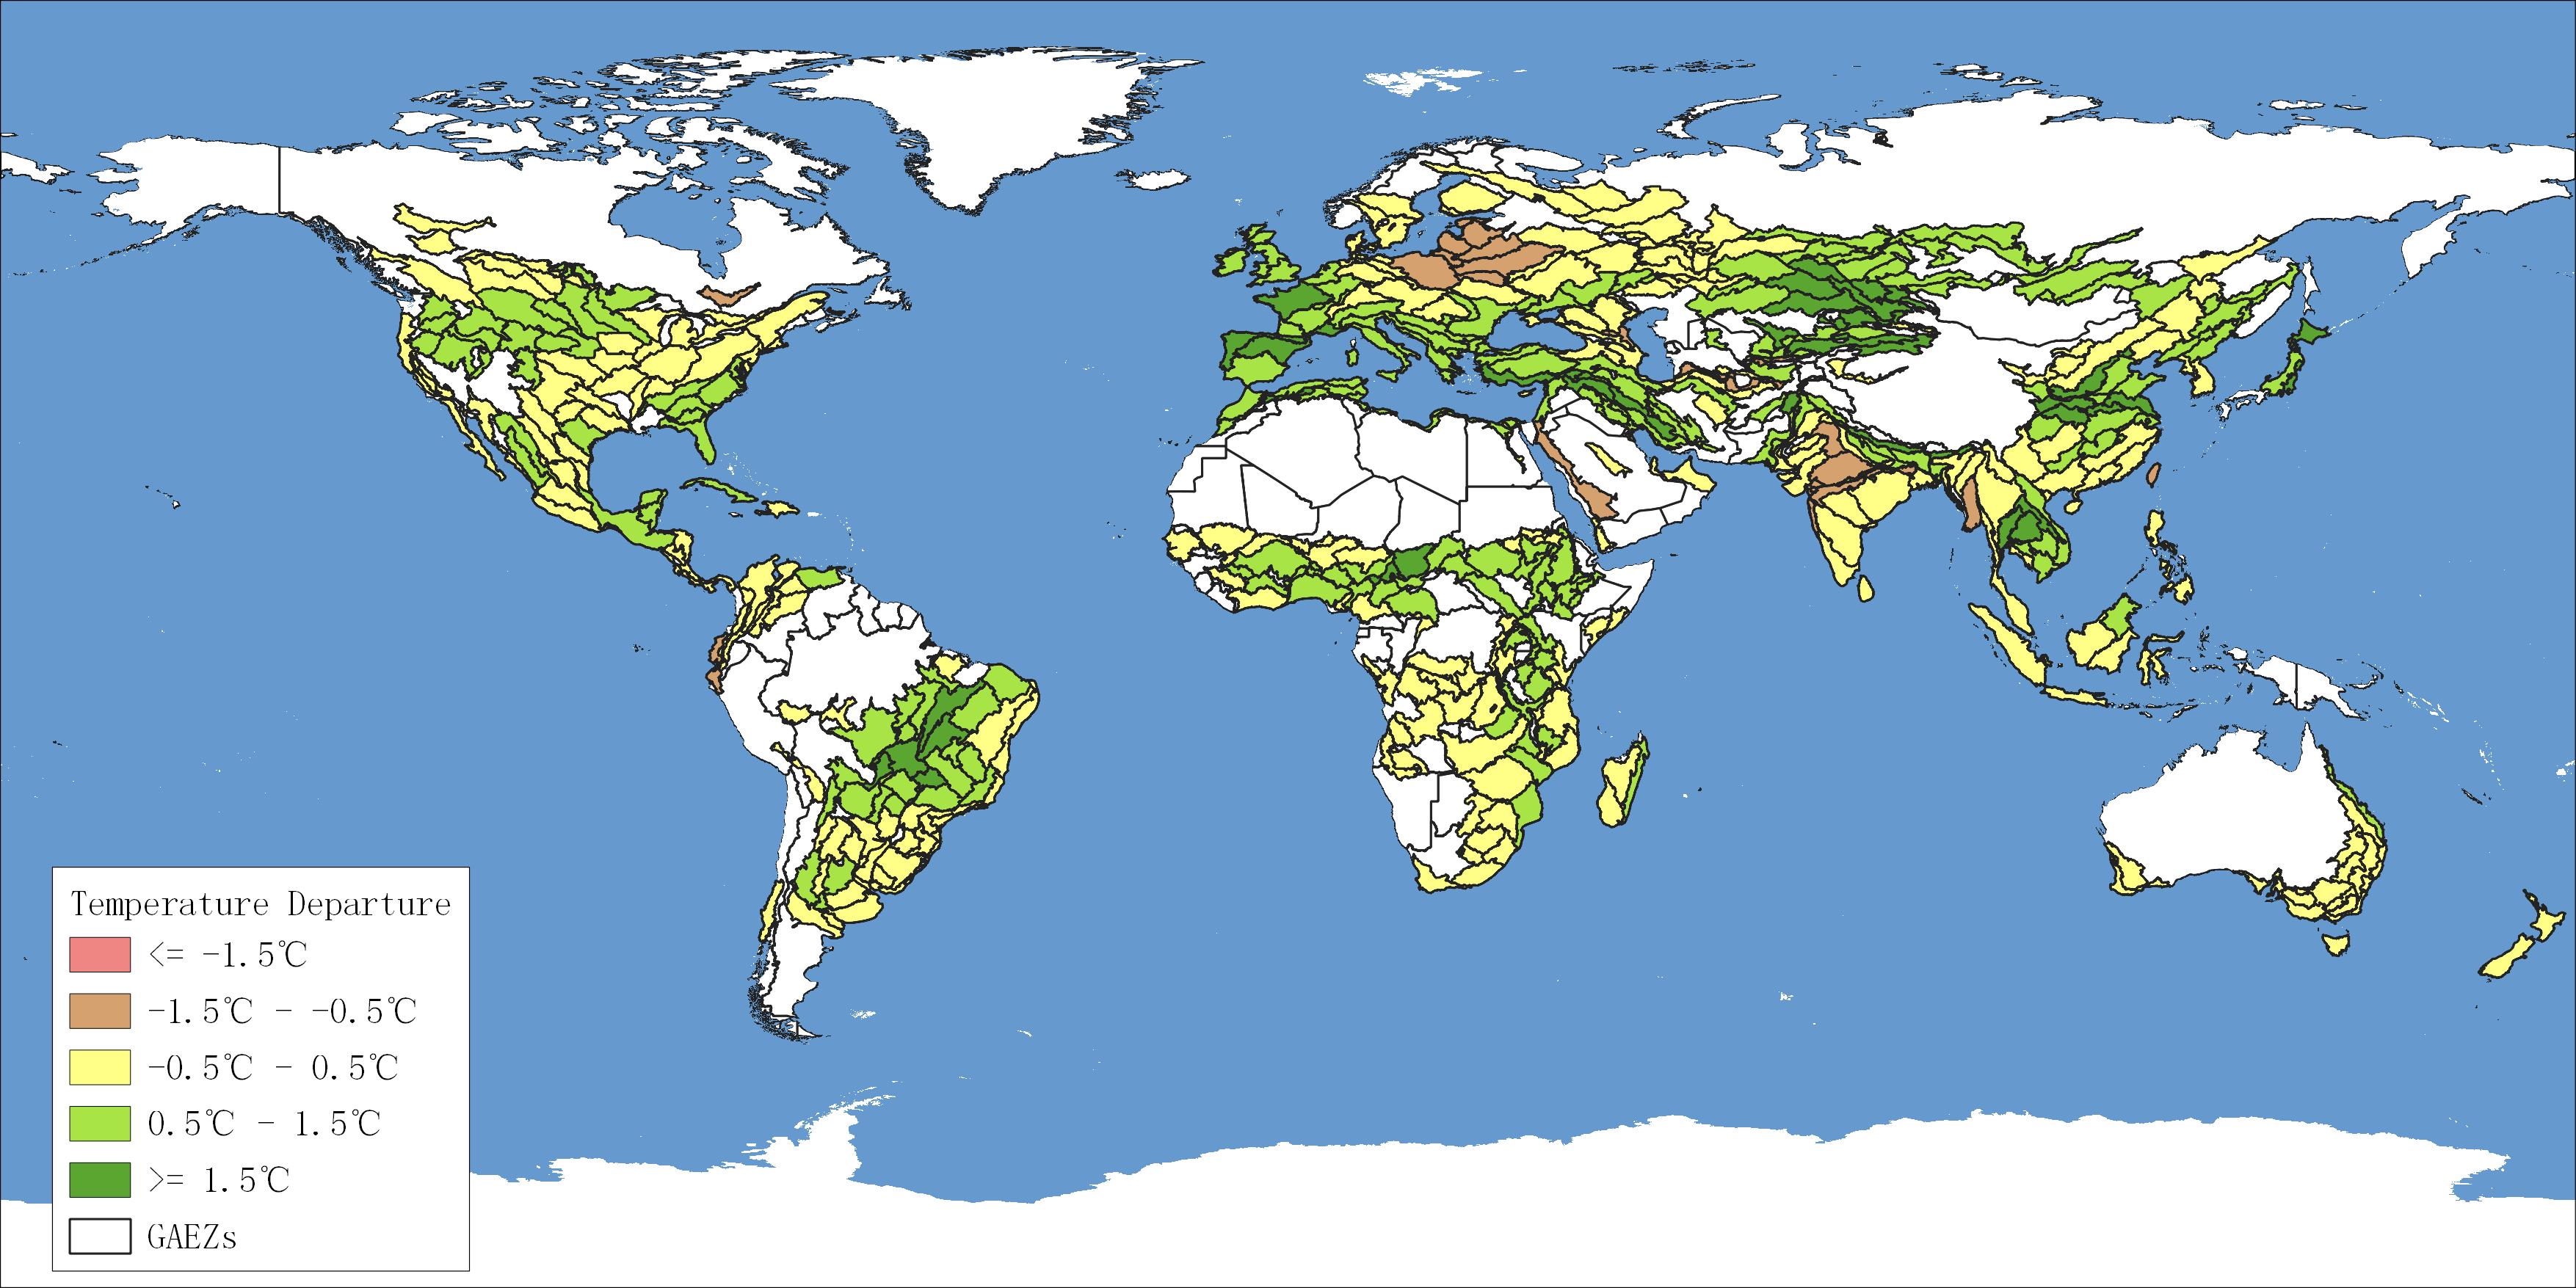
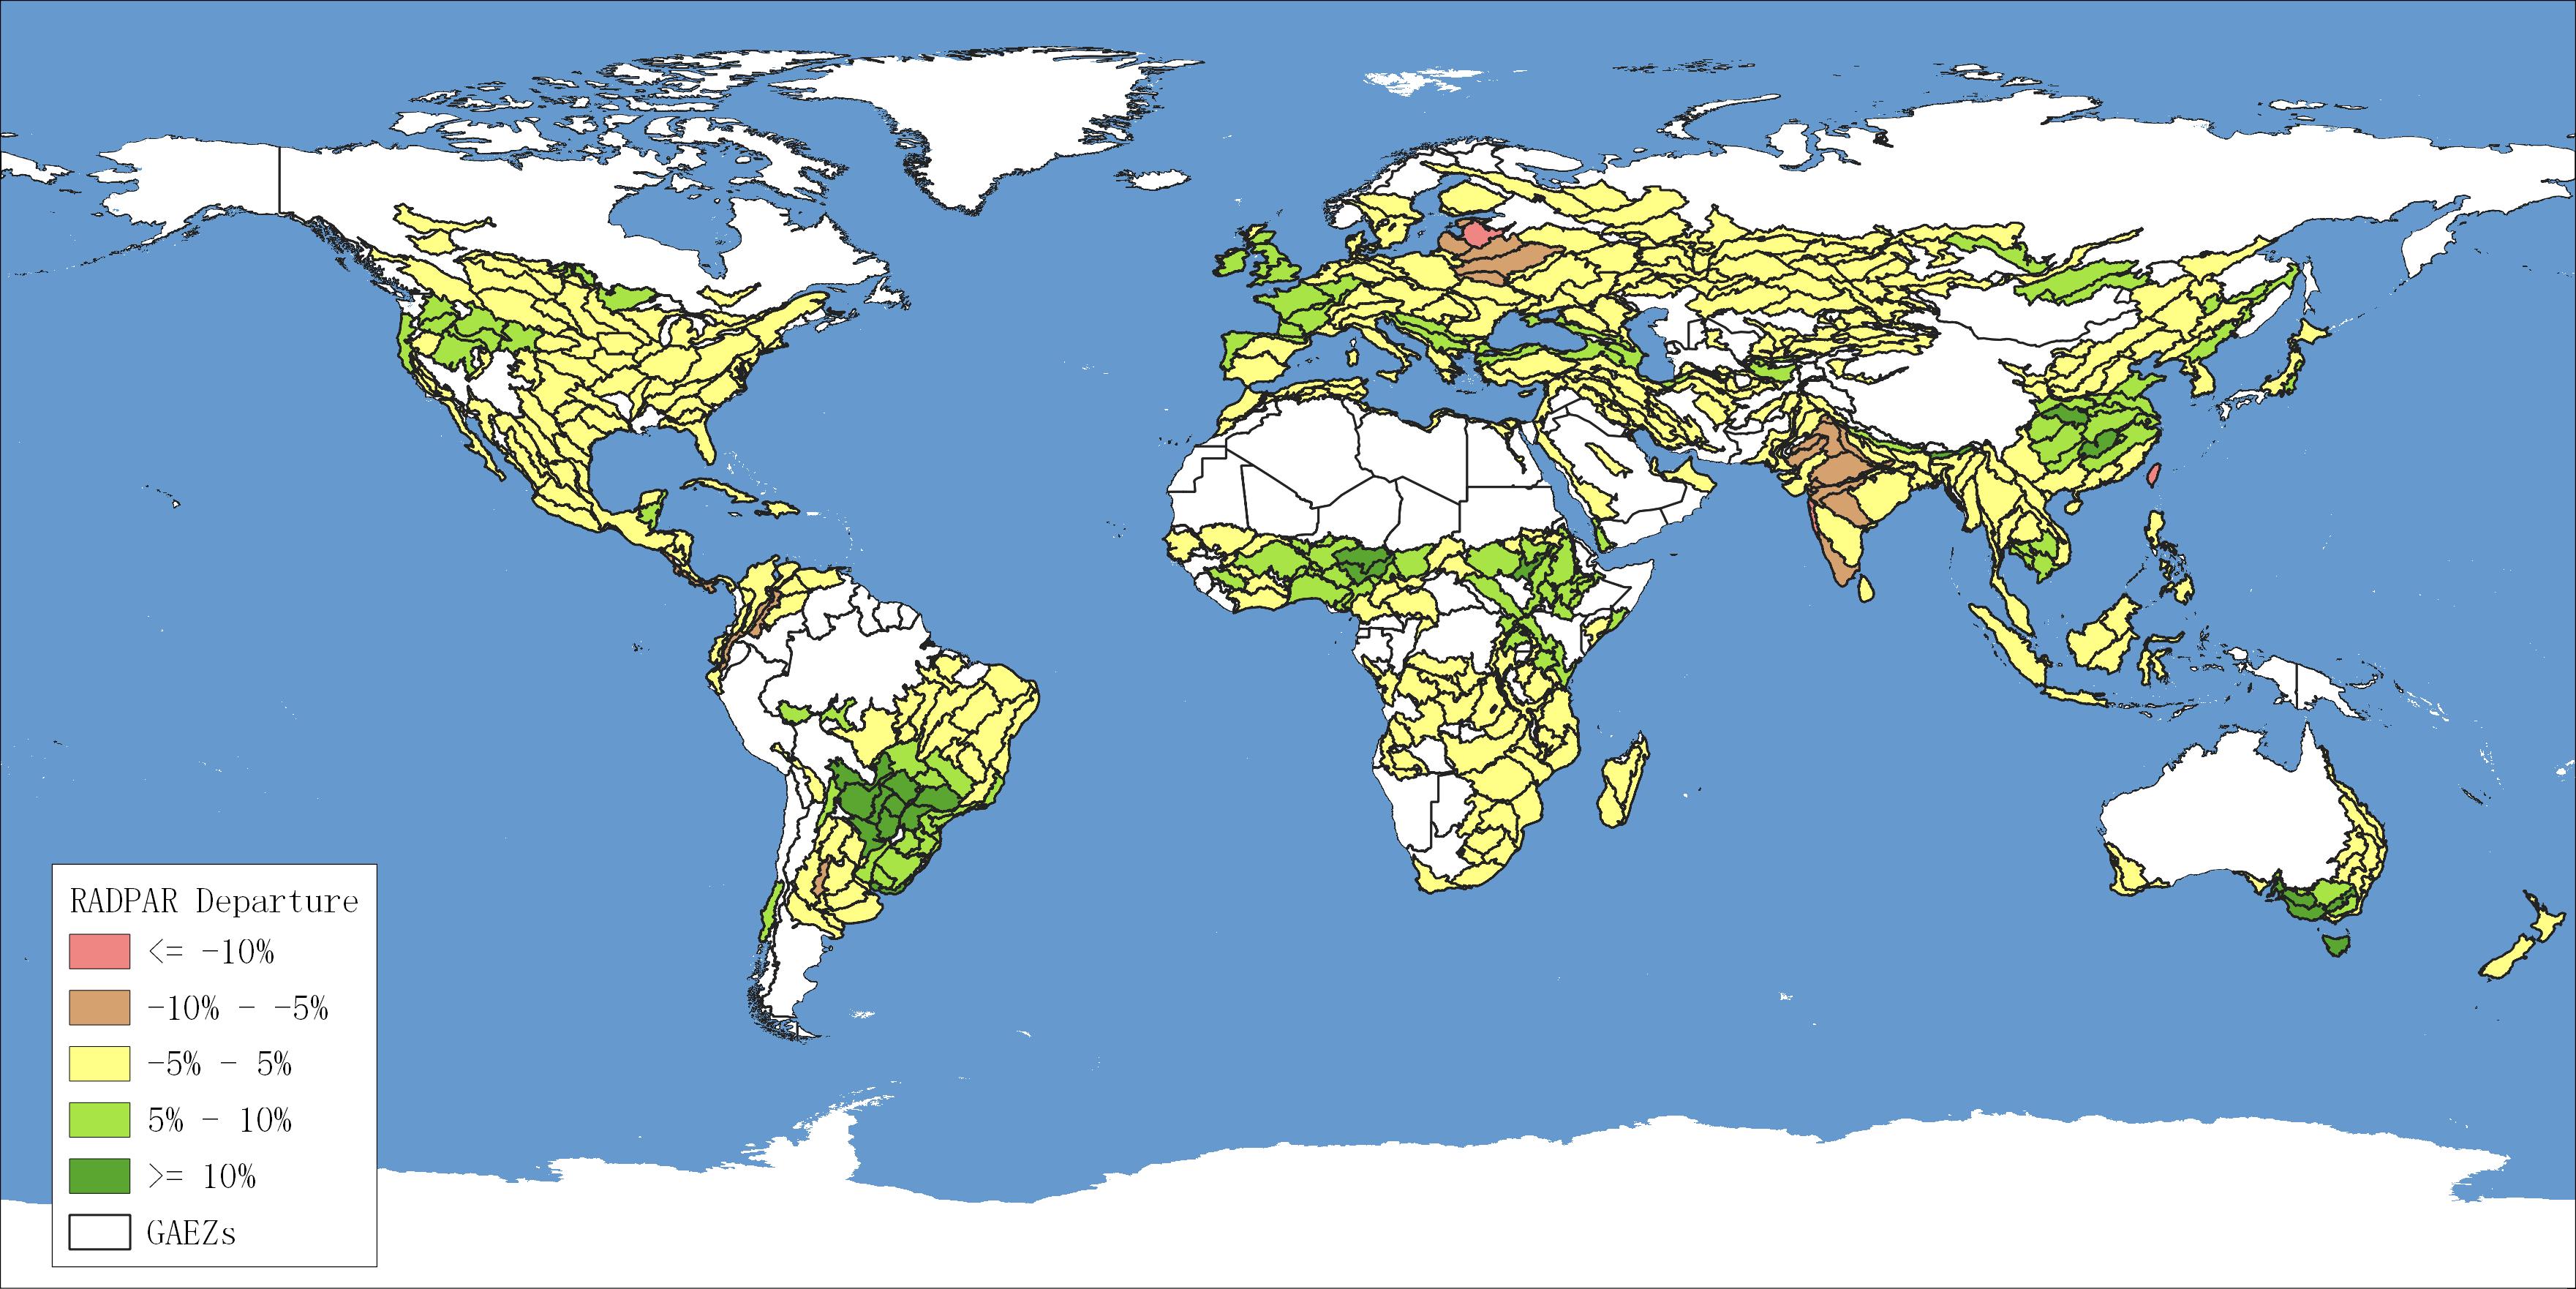
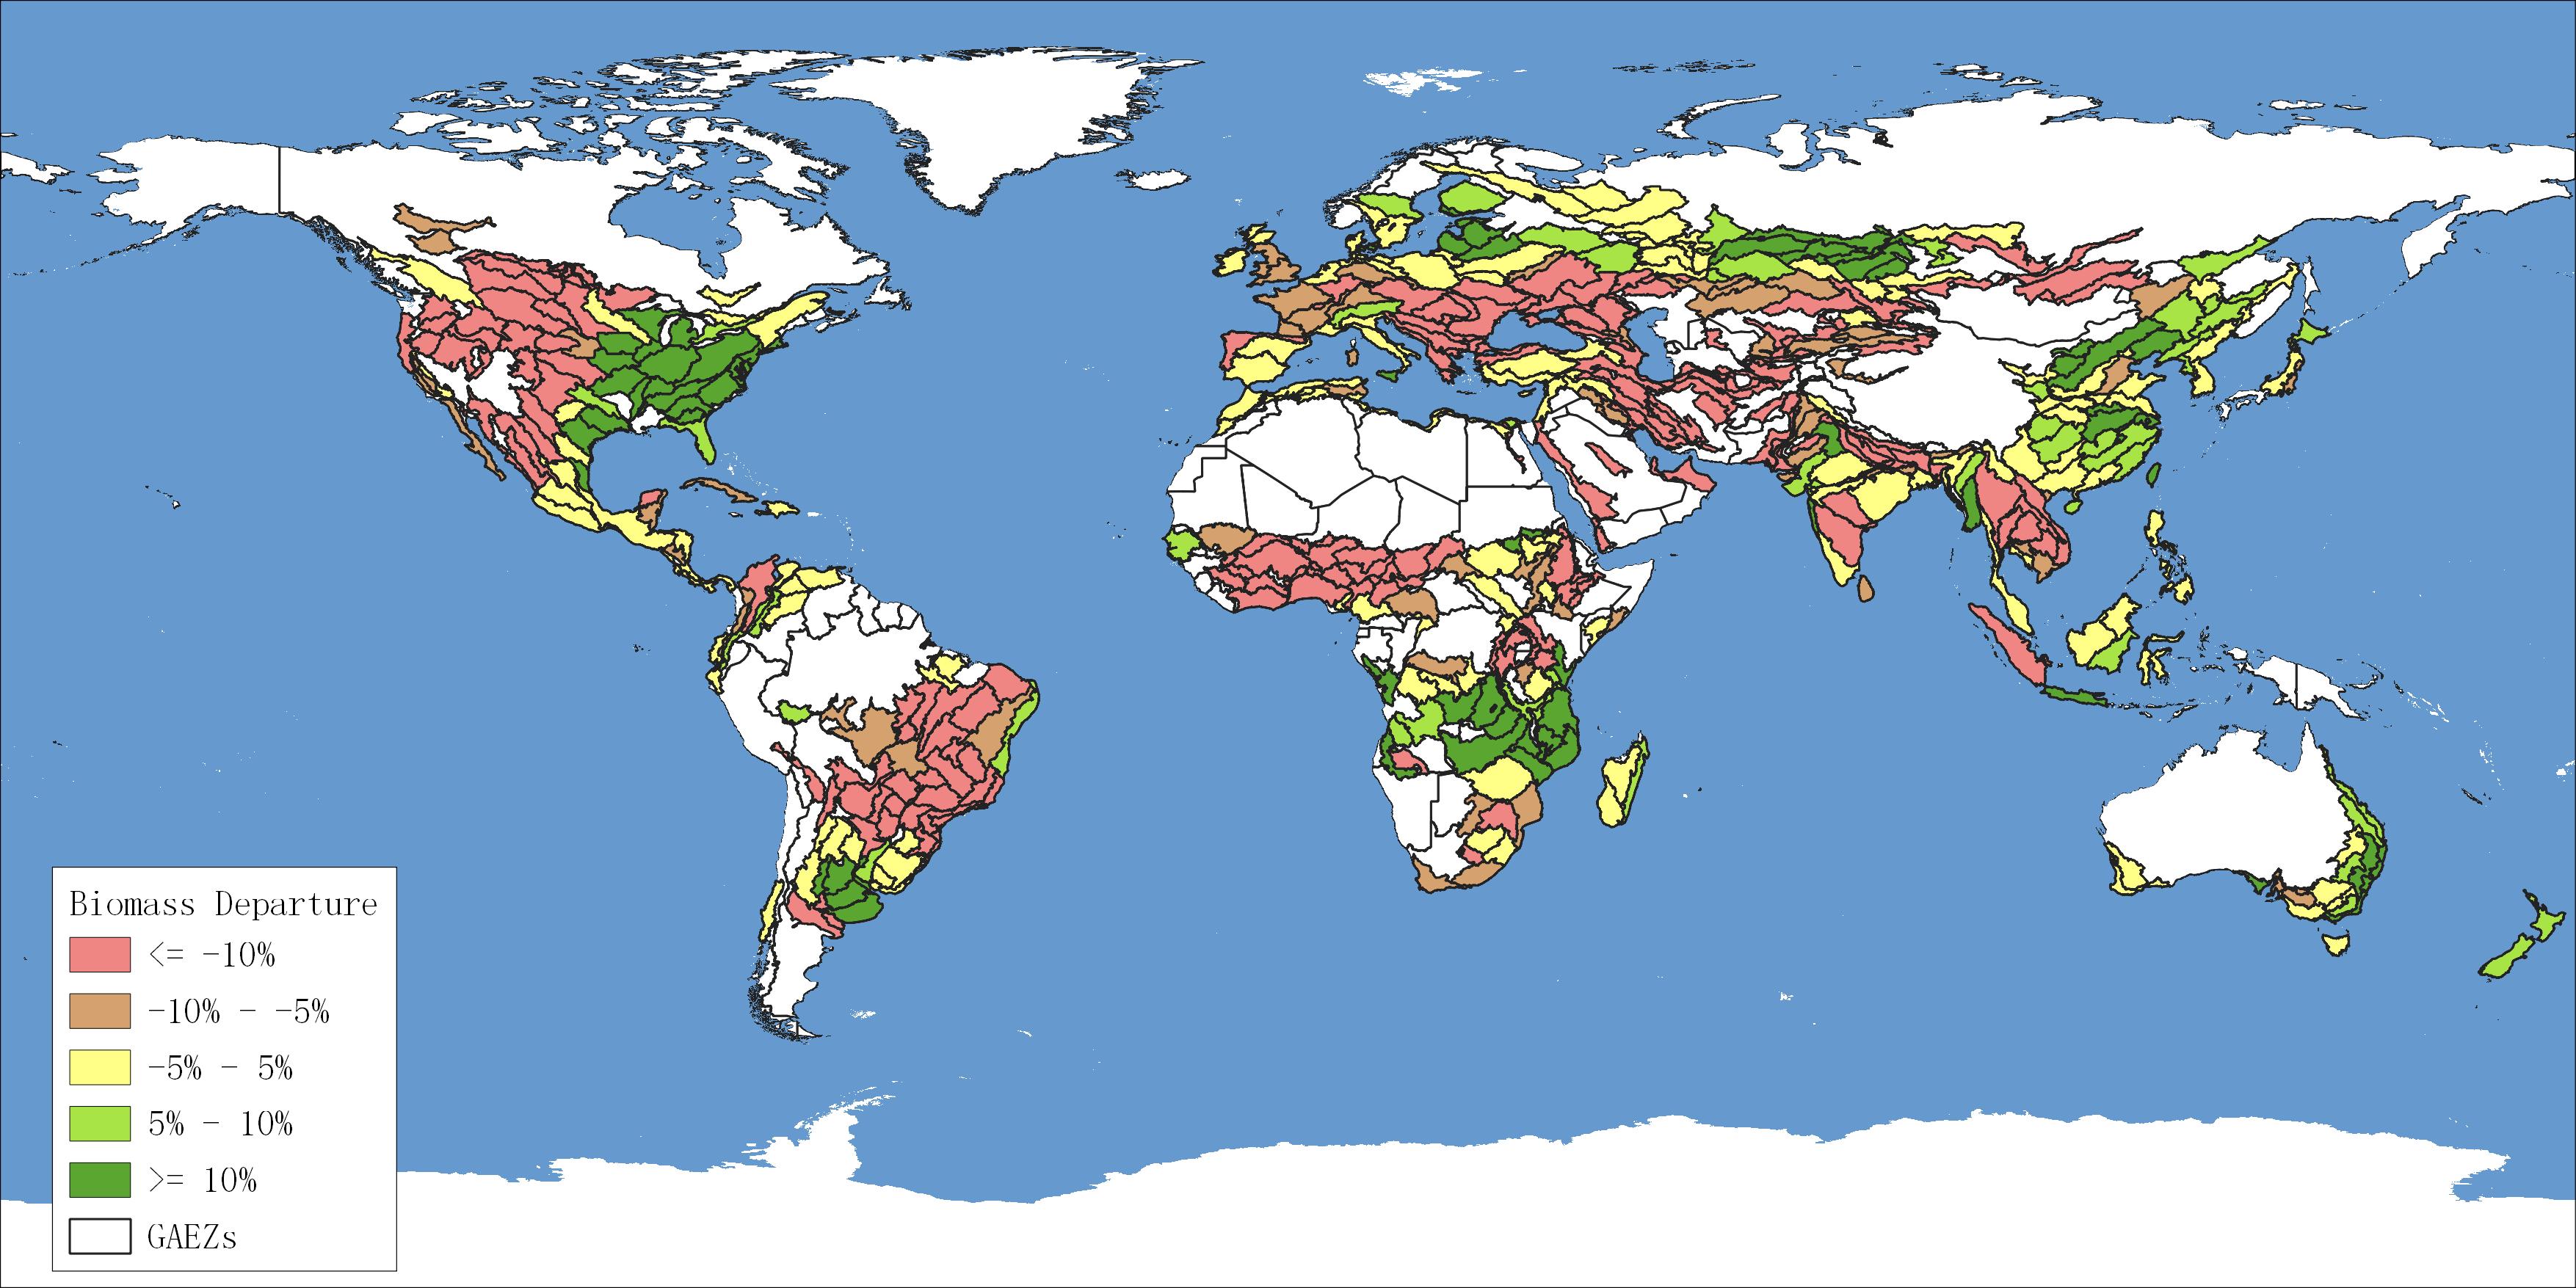
Figure 1.3 Departure Anomalies of Global Agrometeorological Indicators Compared to the 15-year Average, May–July 2025 (Cumulative Precipitation, Average Temperature, Photosynthetically Active Radiation, Potential Biomass)
Overall, the global CroPI for May–July 2025 remained above the baseline, with steady improvement in the Northern Hemisphere and a slight uptick in tropical regions (Figure 1.2). Spatial variation in precipitation, temperature, and photosynthetically active radiation (PAR) was the main driver of regional differences in production conditions (Figure 1.3). In areas with favorable climates, crop photosynthetic capacity and yield potential increased, whereas unfavorable zones faced risks from drought and heat stress.
North America: Central Stable, West Dry, South Hot
In the central United States and parts of Canada, CroPI values mostly ranged from 0.93 to 1.11, indicating normal production levels supported by adequate rainfall and mild temperatures. Advanced farming technologies and management practices also contributed to stable yield potential. However, the western region experienced significantly below-normal precipitation and severe drought in some areas, likely affecting yields of wheat, maize, and other crops. Across the U.S. Midwest and South, temperature anomalies of +0.5°C to +1.5°C may accelerate crop maturation and lead to earlier harvests. Overall, the outlook for summer crops such as maize and soybeans is moderate, with close attention needed in drought-affected areas.
Western Europe: Generally Stable, Local Biomass Declines
In Western and Central Europe, CroPI values were mostly between 0.93 and 1.11, indicating stable production conditions. However, potential cumulative biomass anomalies were negative in certain areas, possibly due to heatwaves or insufficient rainfall, posing a threat to yields of wheat, barley, and other cereals
Eastern Europe: Strong in the North, Weak in the South
Overall crop production conditions in Eastern Europe were favorable, but with marked regional variation. A “north-high, south-low” pattern prevailed, with normal agrometeorological conditions and CroPI values mostly above the baseline in the north. In contrast, southern Eastern Europe—particularly areas along the north coast of the Black Sea—suffered from combined high temperatures and inadequate rainfall, leading to lower CroPI values and heightened yield reduction risks.
Africa: Restricted in the North, Local Improvement in the East
North Africa’s CroPI generally fell below 0.93, with agricultural production limited by water scarcity and extreme weather. In equatorial regions of sub-Saharan Africa, potential biomass anomalies were mixed: in some areas, abundant rainfall and suitable temperatures supported healthy crop growth, while in others—particularly in the Sahel and parts of East Africa—positive PAR anomalies aided growth but persistent rainfall deficits continued to constrain yields. Overall, drought-tolerant crops such as millet and sorghum have a moderate outlook.
Asia (Tropical and Temperate): Weak in South Asia; Local Stress in Southeast Asia and China
In South Asia, insufficient rainfall and sunlight, coupled with lower-than-normal temperatures, resulted in generally low CroPI values, unfavorable for rice and wheat production. In Southeast Asia and parts of China, CroPI values ranged from 0.93 to 1.11, with generally higher-than-normal temperatures. However, both Southeast Asia and North China experienced below-normal rainfall, intensifying water stress and causing significantly lower potential cumulative biomass, which could threaten rice and wheat production.
Looking ahead, it is essential to continue strengthening climate–crop monitoring and promoting advanced agricultural technologies, while implementing targeted management measures to mitigate the impacts of climate variability. Such actions will be crucial to cushioning agricultural systems against climate-related fluctuations and ensuring global food security.
1.1.2 Global Production of Major Grain and Oil Crops
From May to July 2025, global surface temperatures reached a new historical high. Intensified global warming has led to increasingly frequent extreme weather events such as heatwaves, droughts, and floods. The spatial distribution of the global best vegetation condition index indicates that during May to July 2025, the condition of summer crops in the Northern Hemisphere was generally favorable. Crop growth in most agricultural regions of North America, Eurasia, and southern China was better than the average of the past five years. However, some areas in North China, the northern Black Sea coast, and parts of South Asia experienced below-average crop conditions due to drought, flooding, or insufficient photosynthetically active radiation (Figure 1.4).
CropWatch monitoring indicates that the impact of extreme weather events on the production of major grain and oil crops in 2025 was less severe than in the previous year. Based on multi-source satellite remote sensing data up to August 15, 2025, the global total production of major grain and oil crops is forecasted to be 3,204.53 million tons, an increase of 19.65 million tons compared to the previous year, representing a growth of approximately 0.6% (Appendix A.1). Specifically:
Global wheat production is estimated at 808.63 million tons, a decrease of 4.46 million tons year-on-year, down by 0.5%; Global maize production is projected to reach 1,159.88 million tons, an increase of 2.08 million tons year-on-year, up by 0.2%; Global rice production is expected to total 800.27 million tons, an increase of 10.31 million tons year-on-year, rising by 1.3%; Global soybean production is forecasted to be 435.76 million tons, an increase of 11.72 million tons year-on-year, growing by 2.8%.
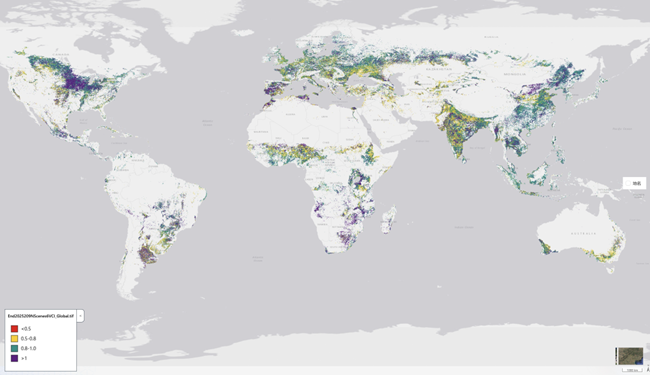
Figure 1.4 Seasonal maximum Vegetation Condition Index (May to July 2025)
1.1.3 Global Impact Assessment of Extreme Events
(1) Dryer cropland compared with the previous years
CropWatch Monitoring in the late July 2025 show that the global soil moisture maintained a complex pattern of "local improvement while overall weakness" (Figure 1.5a). Compared with June, soil moisture increased in regions such as Russia, central India, the northwestern United States, and Argentina (Figure 1.5b). However, during the June–July period, soil moisture in more than half of the global farmland was lower than that in the same period of previous years; the soil moisture situation was severe in areas including Shandong and Henan Provinces of China, and the southwestern coastal regions of India. Currently, it is the critical growth stage of autumn-harvest crops, and the low soil moisture poses severe challenges to local agricultural production.
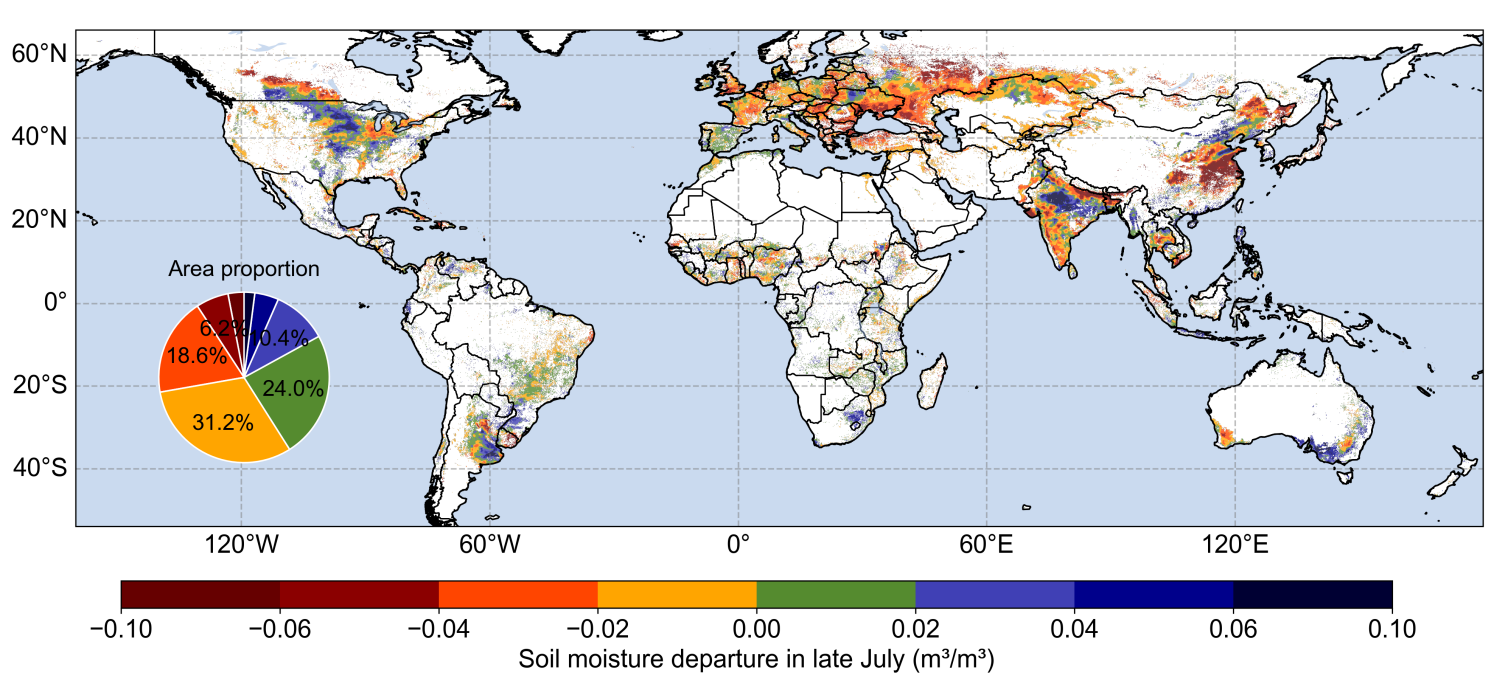
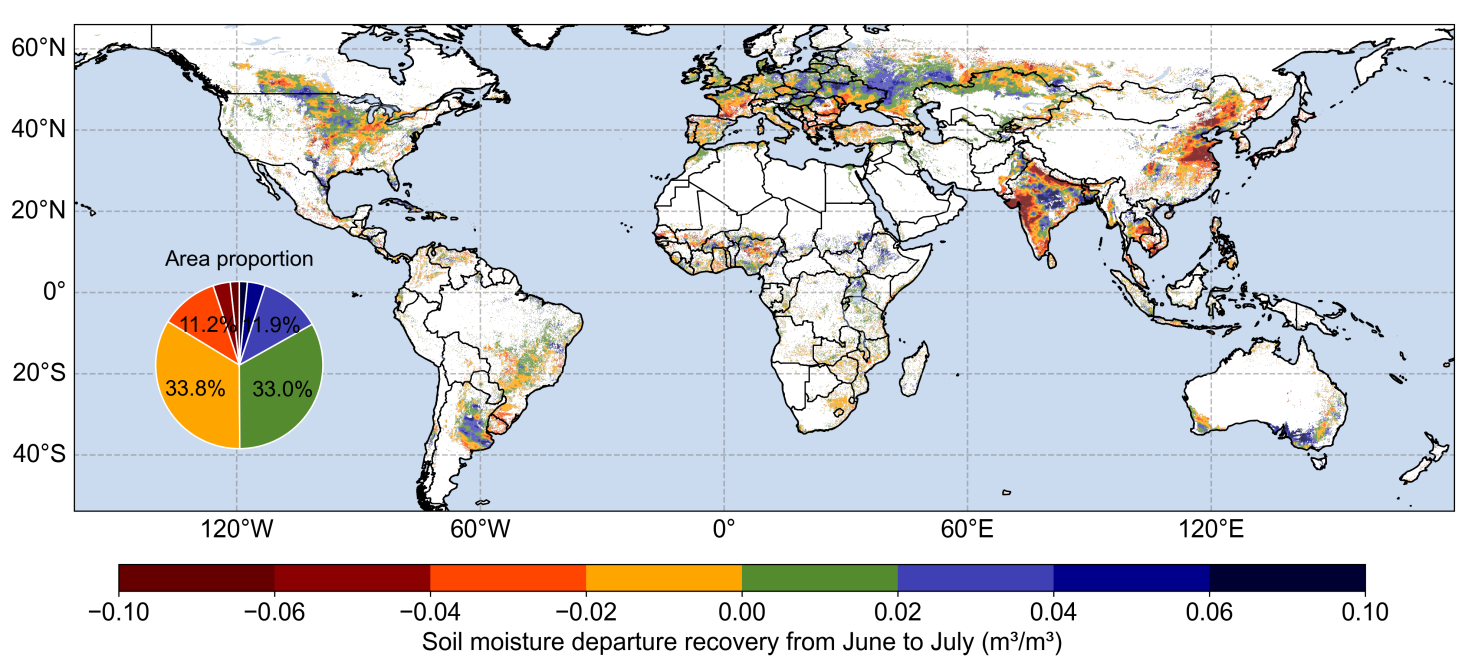
Figure1.5 Anomalies of Root-Zone Soil Moisture in Croplands in Late July 2025 (a) and June–July 2025 (b) (Data Source: SMAP Satellite)
From May to July 2025, the global farmland water stress risk generally showed a trend of "rising and then falling". The proportion of areas with a once - in - five - year or more severe risk increased from 21.2% in May to 27.55% in June, and then decreased to 22.4% in July. In mid - May, the high - risk areas were mainly concentrated in central North America (such as parts of the Midwest United States), southeastern South America, Western Asia, Central Asia, and parts of East Malaysia and its adjacent areas in Indonesia; the medium - risk areas covered the corn - growing areas in the Midwest United States, most of Western Europe, Central Asia, Amazon Rainforest in Brazil, Argentina, and the central and eastern regions of China; the low - risk areas included North America, Eastern Europe, the northeast and south China, the Ganges Plain in India, and southern Africa (Figure 1.6). In mid - June, the Sahel region in Africa, Southeast Europe, northern Madagascar in the Southern Hemisphere, and southeastern Australia experienced a once - in - ten - year drought (Figure 1.7). In mid - July, the drought in the Sahel region in Africa alleviated. However, the once - in - ten - year drought in Southeast Europe continued, as did the once - in - five - year or more severe drought in Shandong and Henan in China, and the water stress risk in southeastern India increased (Figure 1.8).
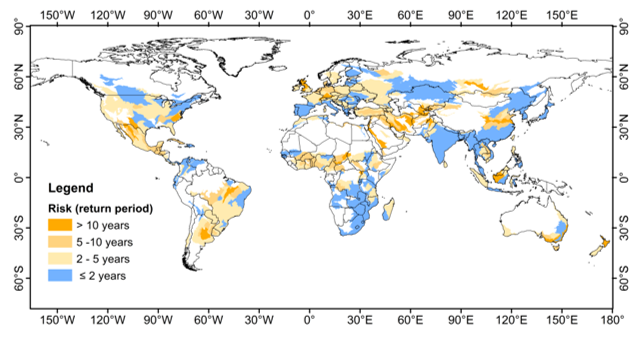
Figure 1.6 Risk of Water Stress Drought Index in Global Agro-Ecological Zones, May 2025
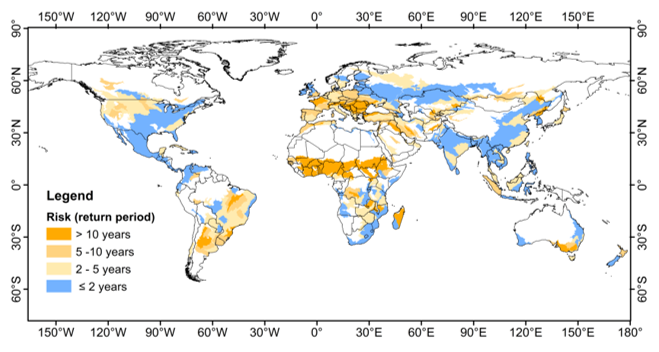
Figure 1.7 Risk of Water Stress Drought Index in Global Agro-Ecological Zones, June 2025
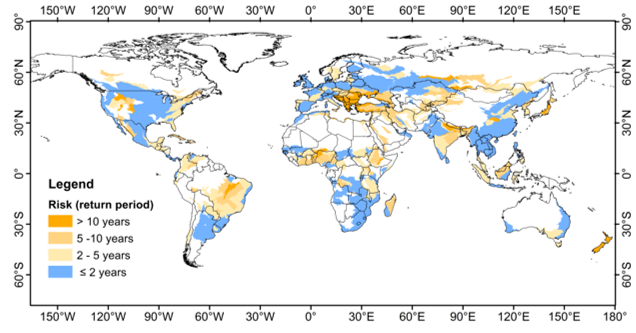
Figure 1.8 Risk of Water Stress Drought Index in Global Agro-Ecological Zones, July 2025
Following the conclusion of the global La Niña event in April, the spatial pattern of crop water stress risk across countries remained relatively stable from May to July 2025. Based on the 8-day interval monitoring data of crop water stress risk from January to July 2025, 167 countries worldwide can be clustered into three risk-characteristic groups (Figure 1.9): The 47 high-risk countries, mainly distributed in North Africa, South Asia, South-Central Asia, and Australia, saw a brief alleviation of risk from February to April, followed by a sharp surge after April, with intensified intra-group differentiation in July. The 56 low-risk countries, concentrated along the equator and in Northwestern Europe, experienced a significant rise in risk from February to April, which then gradually declined after April. The 64 medium-risk countries, including China, Russia, North America, Brazil, and Argentina, maintained a stable national-scale risk probability from January to July, with slight fluctuations within the range of 0.4 to 0.6.
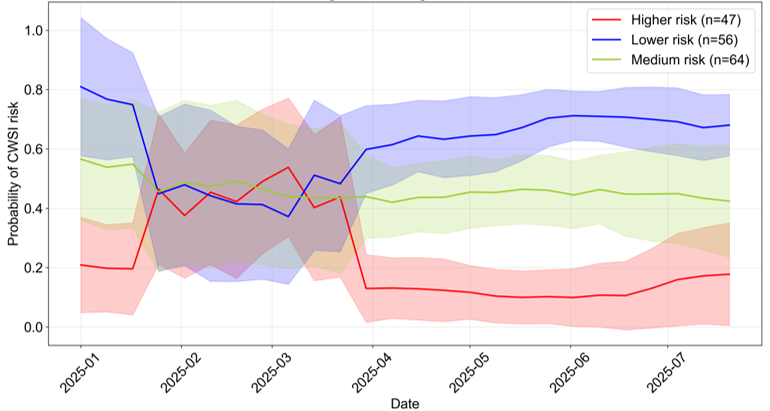
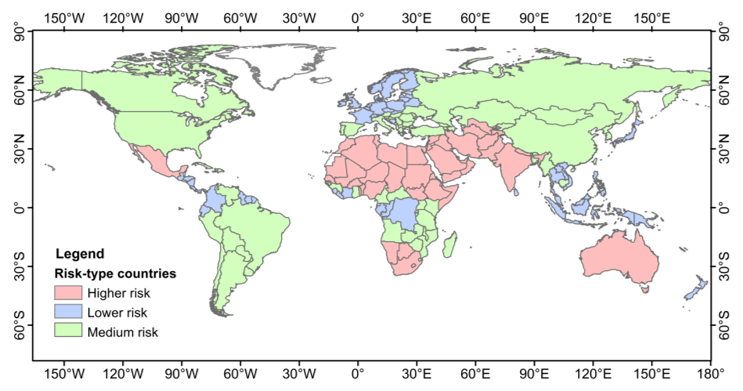
Figure 1.9 Cluster Analysis of 8-Day Farmland Water Stress Risk Trends Across 167 Global Countries (January–July 2025) (a) and Map of Crop Water Stress Risk Status by Country (b)
(2) Abnormal high temperatures in mid-to-high latitude regions and potential risks to the growth of corn and soybeans.
CropWatch land surface temperature remote sensing monitoring reveals rare climate anomalies across multiple regions worldwide. In July, persistent heatwaves affected central North America, the region stretching from Eastern Europe to Western Asia, as well as western India and Pakistan (Figure 1.10). Among these areas, the major corn and soybean producing regions in North America— which are vital to global food supply— and certain corn and potato cultivation belts in northern Eastern Europe and Western Asia are confronting high-temperature stress risks of at least a once-in-five-year magnitude. This has exerted a certain impact on the growth and development of regional crops and the stability of their yields.
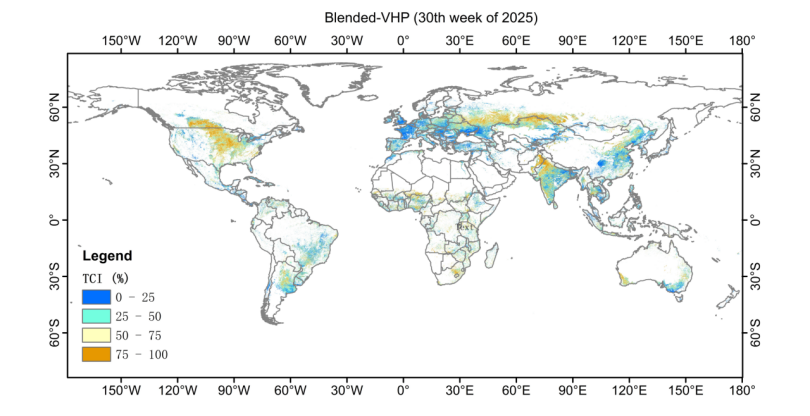
Figure 1.10 Global Temperature Condition Index (30th week of 2025)
(3) Severe Situation of Rainstorm and Waterlogging Disasters in Eastern Asia
According to CropWatch’s monitoring of the maximum daily precipitation in global farmland, from May to July 2025, South Asia (including India and Bangladesh) and the Jianghuai Region of China were hit by torrential rains with a daily precipitation exceeding 50 mm (Figure 1.11). In July, the precipitation pattern in East Asia showed a "rainy north and south, dry central" distribution: the precipitation in the Jianghuai Region of China was more than 100 mm below the normal level. However, the precipitation in the southeastern coastal areas of China and the central part of Inner Mongolia increased significantly compared with previous years, while the precipitation in central-northern India, the Philippines, and other regions was more than 100 mm higher than that in previous years.

Figure 1.11 Global Maximum Daily Precipitation (May–July 2025)