
 English
 中文

Bulletin
CropWatch bulletinMenu
Authors: tianfuyou | Edit: Miao
Wheat is the most widely cultivated crop globally, grown in over 120 countries and regions. This report utilizes multi-source, medium-to-high resolution satellite remote sensing data covering the entire growth period of wheat, focusing on monitoring wheat planting areas and verifying wheat yields in six major wheat-producing countries in the Northern Hemisphere (China, Russia, France, Canada, the United States, and Ukraine) (Figure 1.12, Table 1.1). The latest remote sensing monitoring indicates significant divergence in wheat production conditions among these major producers. In 2025, the wheat planting area in these six countries is projected to be 90,672 thousand hectares, an increase of 1.5% compared to 2024. However, due to adverse weather conditions such as drought and high temperatures during the grain filling period in several major production areas, and continuous rain during the flowering period in some regions, the average yield is expected to decrease by 2.1% year-on-year, dropping to 4,572 kg/ha. Against the backdrop of expanded planting areas but declining yields, the total wheat production in these six countries is projected to be 414.5 million tons, a slight decrease of 0.6% from the previous year, with a production decline of 2.4 million tons.
Ukraine’s sown area increased significantly by 8.2%, driving a 5.8% year-on-year growth in total production. The increase in wheat production is expected to enhance its export supply capacity to some extent. However, due to damaged infrastructure and unresolved drought conditions in the south, there remains uncertainty in future transportation and export schedules, which could pose risks to international grain prices.
In Russia, although yield decreased by 4.1% due to drought in the Volga region and rainy weather during the flowering period, the sown area expanded by 2.9%, partially offsetting the impact of the yield decline, resulting in a slight 1.3% decrease in total production.
In China, the overall light, temperature, and water conditions in major wheat-producing areas were well-matched, with a 4% increase in photosynthetically active radiation. However, severe drought during the grain filling period in parts of the Huang-Huai-Hai region led to a decrease in thousand-kernel weight, resulting in a 1.6% year-on-year decline in yield. Thanks to a 2.1% year-on-year increase in winter wheat planting area, total wheat production saw a slight 0.4% increase.
In France and Canada, wheat yields generally declined year-on-year due to the impact of high temperatures and drought. Wheat planting areas in Canada and the United States decreased by 1.2% and 3.1% year-on-year, respectively, leading to a decline in wheat production in all three countries.
Overall, while wheat production in major Northern Hemisphere producing countries is expected to decline slightly in 2025, the absolute volume remains at historically high levels. The global wheat market is generally well-supplied, and the contraction of North American exports provides opportunities for Australia and Argentina to expand into the Asia-Pacific market. Adjustments in export regional structures and redistribution will be major factors influencing international price trends in the second half of the year. Attention should be focused on the stability of Ukrainian port logistics and adjustments in Russian export tariff policies.
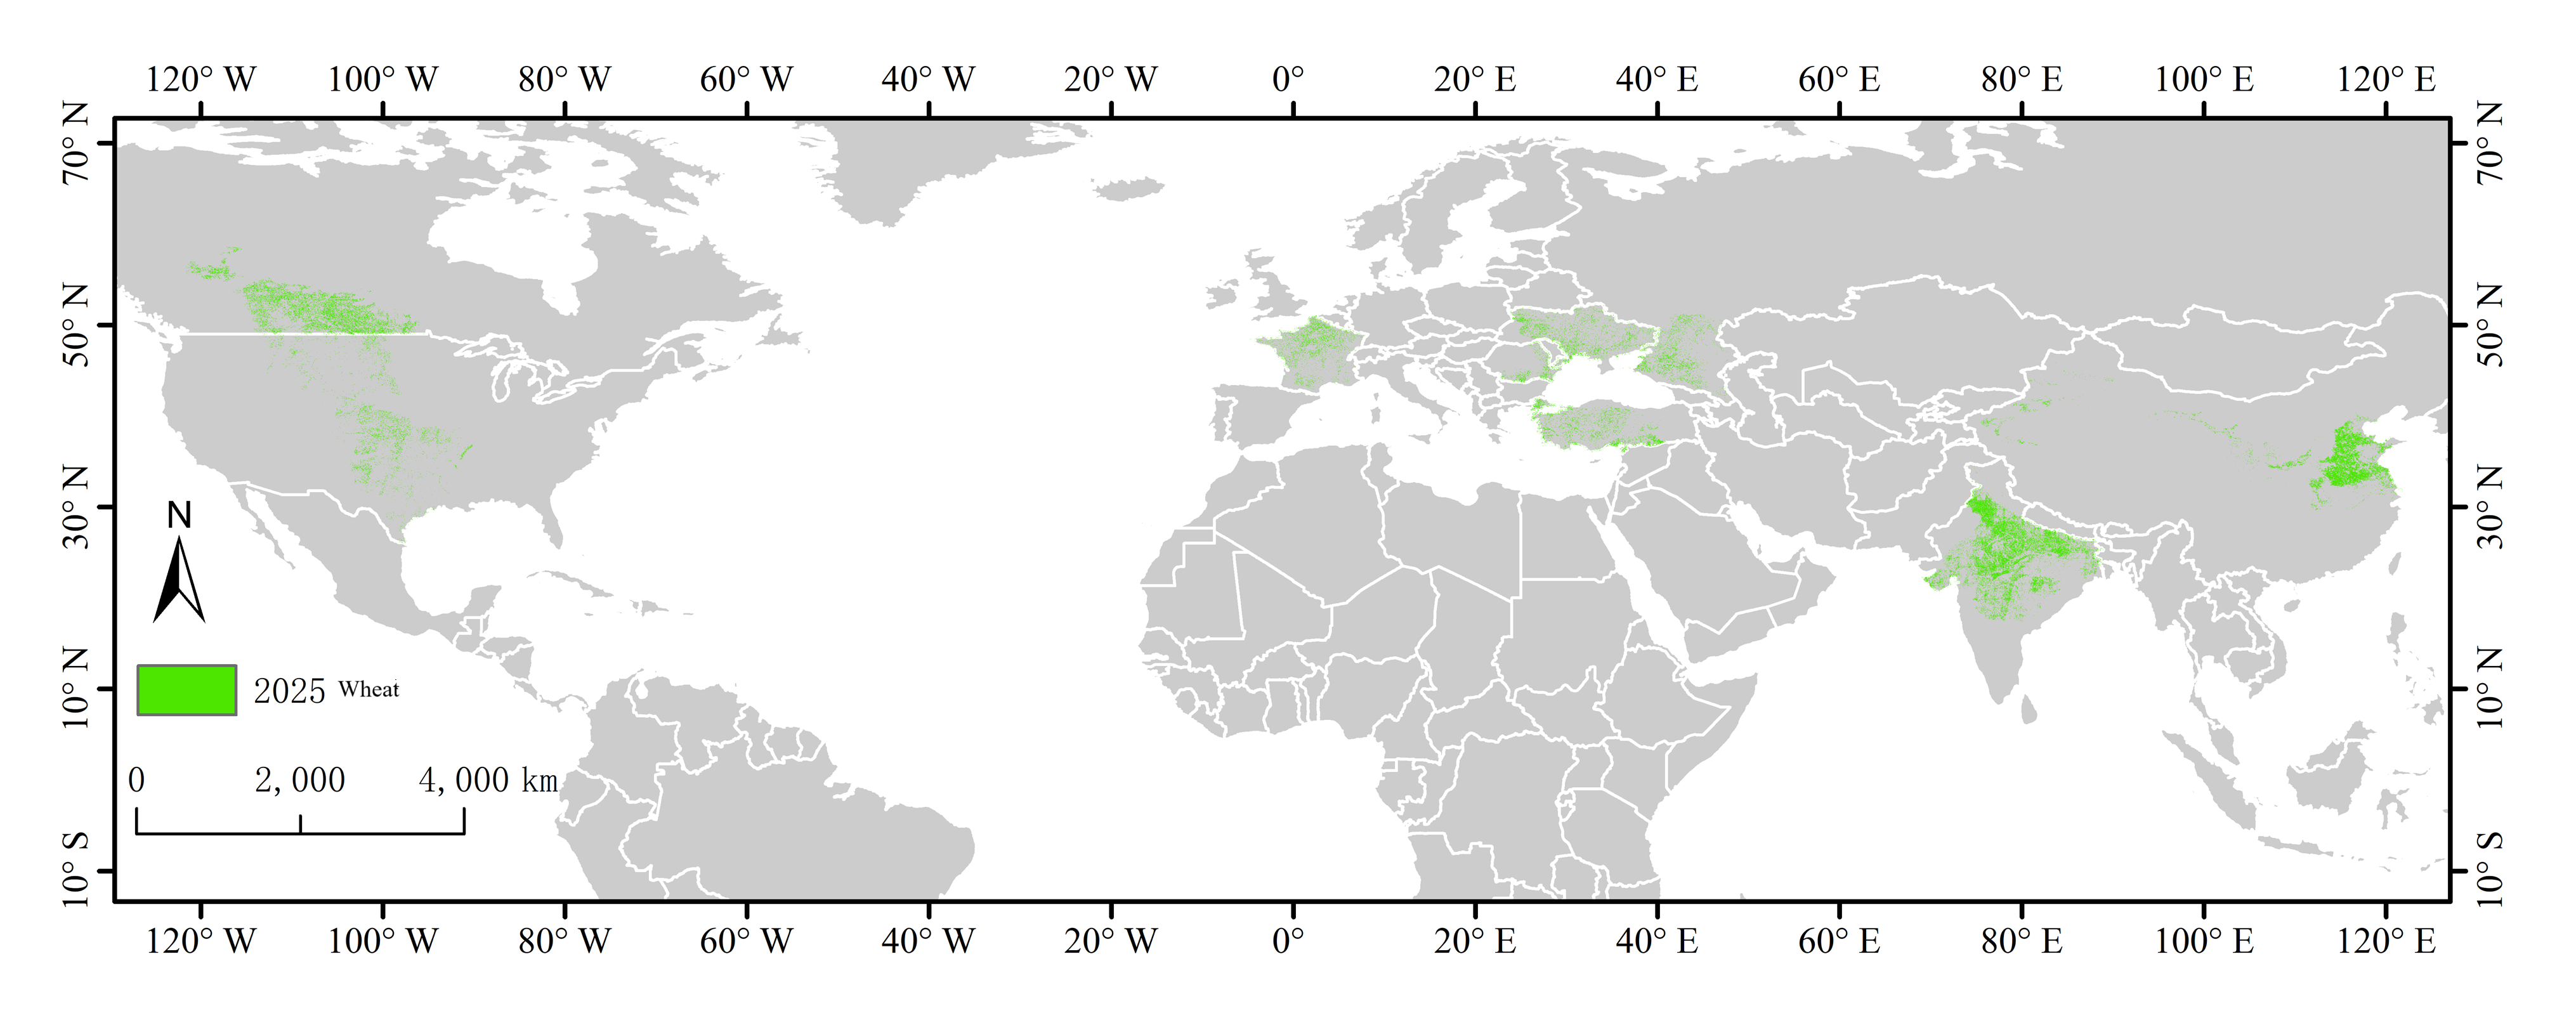
Figure 1.12 Distribution Map of Winter Wheat Planting in Eight Major Wheat-Producing Regions of the Northern Hemisphere in 2025
Table 1.1 Recalibration of 2025 Winter Wheat Production for Six Major Producing Countries in the Northern Hemisphere
| Yield (ton/ha) | Production (million tones) | |||||||
2024 | 2025 | Change | 2024 | 2025 | Change | 2024 | 2025 | Change | |
Canada | 10.00 | 9.89 | –1.2 % | 4.15 | 4.05 | –2.4 % | 41.53 | 40.08 | –3.5 % |
China | 25.10 | 25.62 | 2.1 % | 5.47 | 5.38 | –1.6 % | 137.15 | 137.74 | 0.4 % |
France | 5.59 | 5.64 | 0.8 % | 7.80 | 7.72 | –1.1 % | 43.61 | 43.48 | –0.3 % |
Russia | 29.37 | 30.23 | 2.9 % | 3.25 | 3.12 | –4.1 % | 95.41 | 94.17 | –1.3 % |
Ukraine | 5.75 | 6.22 | 8.2 % | 4.28 | 4.19 | –2.2 % | 24.61 | 26.03 | 5.8 % |
USA | 13.50 | 13.08 | –3.1 % | 5.53 | 5.58 | 1.0 % | 74.61 | 73.04 | –2.1 % |
Total | 89.30 | 90.67 | 1.5 % | 4.67 | 4.57 | –2.1 % | 416.93 | 414.53 | –0.6 % |