
 English
 中文

Bulletin
CropWatch bulletinMenu
Authors: Miao,limengxiao,fan,MH18174088459 | Edit: Miao
Based on nationwide 10-meter resolution cropland parcel data and massive ground truth samples collected via the GVG smartphone application, this report integrated artificial intelligence methods such as random forest and transfer learning, remote sensing-based biomass-harvest index crop yield prediction models, the latest agro-meteorological information, and multi-source remote sensing data covering the entire growing season to review the production of winter crops, and early rice. Data up to August 15, 2025 were used to monitor and predict the yields of rice, maize, soybeans, summer crops, and total annual grain production. The total annual crop output for 2025 is forecasted to be 655.94 million metric tons, an increase of 2.10 million tons year-on-year, up by 0.7%. This includes winter crops output of 145.16 million tons, a year-on-year increase of 0.19 million tons, up by 0.1%; early rice output of 28.32 million tons, a year-on-year increase of 0.97 million tons, up by 3.5%; and summer crops output is forecasted at 482.46 million tons, a year-on-year increase of 0.94 million tons, up by 0.2%.
2.1.1 Wheat and winter crops production estimation
(1)Revision of wheat production
In 2025, the national winter wheat planted area is expected to reach 24,298 thousand hectares, representing a year-on-year increase of 2.2% (as shown in Table 2.1 and Figure 2.1). The average yield is projected to be 5,431 kg/ha, marking a slight year-on-year decrease of 1.6%. Despite the decline in yield, the expansion in planted area is expected to support a slight increase in total production, estimated at 131.96 million tons, a marginal year-on-year increase of 0.5%.
The core status of the main producing provinces has been further consolidated, with the combined planted area of 11 major winter wheat producing provinces, including Henan and Shandong, expected to reach 21,999 thousand hectares, a year-on-year increase of 2.2%, accounting for 90.5% of the national total winter wheat planted area. As the core winter wheat production region, the Huang-Huai-Hai area (comprising the provinces of Hebei, Jiangsu, Anhui, Shandong, and Henan) accounts for approximately 73.9% of the national total. However, there are significant differences in planted area changes among the provinces within the region: Anhui’s winter wheat planted area is expected to increase significantly by 6.7% to 3,134 thousand hectares, reversing the downward trend of 2024. The planted areas in Shandong and Hebei provinces increased by 4.1% and 5.9% year-on-year, respectively, and Shaanxi’s planted area increased by 5.2% year-on-year, reaching 818 thousand hectares. In contrast, the winter wheat planted area in Jiangsu, and the winter-spring wheat planted area in Xinjiang decreased compared to 2024, with year-on-year reductions of 2.7% and 3.0%, respectively. Gansu’s planted area saw a slight year-on-year decrease of 0.1%, and the situation in Sichuan and Gansu is similar, with both maintaining stable overall planting levels.
Among the main producing provinces, Hebei stands out, with both its winter wheat planted area and yield achieving year-on-year growth, leading to a total production increase of 0.84 million tons, a growth rate of 6.6%, ranking first among the main producing provinces in terms of both production increase and growth rate. Shandong experienced the most severe drought during the wheat growing period; although the planted area increased, it was far from offsetting the impact of a yield decline (-5.6%), resulting in a year-on-year production decrease of 1.7%. Shanxi’s total winter wheat production remained flat year-on-year. In Gansu, the yield increased by 1.4% year-on-year, leading to a total production increase of 1.3%. Sichuan’s winter wheat yield decreased by 2.7% year-on-year, resulting in a production decrease of 50,000 tons. Both Hubei and Jiangsu experienced declines in winter wheat yield and planted area, with these combined factors leading to year-on-year production decreases of 2.9% and 3.9%, respectively.
The persistent drought in the main winter wheat producing areas in 2025 posed severe challenges to wheat production in several major provinces. Scientific guidance and precise management measures alleviated some adverse conditions to a certain extent, but yield declines still occurred. However, thanks to the increase in planted area, total wheat production was able to remain stable.
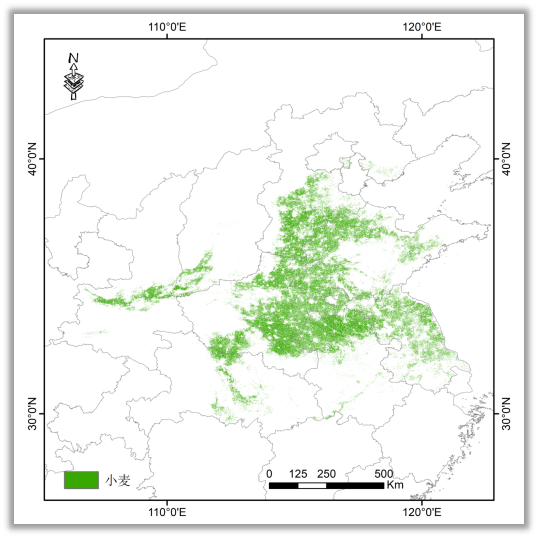
Figure 2.1 Spatial Distribution of Winter Wheat in North China and Huang-Huai-Hai Wheat Region in 2025
Table 2.1 Winter Wheat Planted area, Yield, and Production Forecast for Major Producing Provinces, China, 2025
Province | Planted areas(Thousand Hectares) | Yield(Kg/Hectare) | Production (Million Tons) | ||||
2025 | Change(%) | 2025 | Change(%) | 2025 | Changes | Change(%) | |
Hebei | 2258 | 5.9 | 5968 | 0.7 | 13.48 | 84 | 6.6 |
Shanxi | 422 | -1.7 | 5483 | 0.2 | 2.31 | -4 | -1.5 |
Jiangsu | 2679 | -2.7 | 5068 | -1.3 | 13.58 | -56 | -3.9 |
Anhui | 3134 | 6.7 | 4788 | -1.3 | 15.00 | 76 | 5.3 |
Shandong | 4412 | 4.1 | 6179 | -5.6 | 27.26 | -48 | -1.7 |
Henan | 5472 | 0.8 | 6126 | -0.2 | 33.52 | 20 | 0.6 |
Hubei | 1139 | 0.4 | 3860 | -3.2 | 4.40 | -13 | -2.9 |
Sichuan | 480 | 0 | 3865 | -2.7 | 1.86 | -5 | -2.7 |
Shaanxi | 818 | 5.2 | 3721 | -1.3 | 3.04 | 11 | 3.9 |
Gansu | 533 | -0.1 | 4309 | 1.4 | 2.30 | 3 | 1.3 |
Xinjiang | 652 | -3 | 5666 | -0.5 | 3.69 | -13 | -3.5 |
Subtotal | 21999 | 2.2 | 5475 | -1.7 | 120.44 | 55 | 0.5 |
Other provinces | 2299 | 1.8 | 5009 | -0.6 | 11.52 | 13 | 1.2 |
China | 24298 | 2.2 | 5431 | -1.6 | 131.96 | 68 | 0.5 |
(2) Revison of winter crops production
In 2025, the total national winter crops production reached 145.16 million tons, an increase of 0.19 million tons year-on-year, with a growth rate of 0.1%. This is a significant narrowing compared to the predicted growth rate in June and a noticeable slowdown compared to the 2.1% growth rate in 2024. The main producing provinces achieved a winter crops production of 131.05 million tons, an increase of 0.34 million tons year-on-year (a growth rate of 0.3%), while production in non-main producing provinces decreased by 0.8% (a reduction of 0.12 million tons). Despite a 2.0% year-on-year decline in national winter crops yield, the total winter crops production still achieved a year-on-year increase, thanks to a 2.2% growth in planted area.
During this year’s main rainy season (June to August), China experienced significant regional and periodic droughts and floods. Shandong Province continued to be affected by drought; although the winter crops planted area increased, the decline in yield exceeded the growth in area, resulting in a 1.7% year-on-year decrease in winter crops production. In Henan Province, there was a rapid shift between drought and flooding, with previously drought-affected areas experiencing heavy rainfall. This alleviated the drought but also led to localized flooding in some areas, although the overall affected area was limited. The winter crops yield in Hebei, Henan, and other regions improved compared to earlier forecasts. Regions such as Huanghuai and Jianghuai faced high temperatures and low rainfall, with drought conditions causing moisture deficits in some farmlands in Anhui, Jiangsu, Shandong, and Sichuan, leading to a decline in winter crops yield. However, in Anhui and Shaanxi, the increase in winter crops planted area year-on-year effectively offset the adverse effects of yield decline, resulting in a year-on-year increase in winter crops production.
Table 2.2 Winter Crops Yield and Production for Major Producing Provinces in 2025, China
Province | Production in 2024 (million ton) | 2025 | ||||
∆Area (%) | ∆Yield (%) | Production (million ton) | Production change (million ton) | ∆Production (%) | ||
Hebei | 1301 | 5.9 | 0.7 | 13.87 | 86 | 6.6 |
Shanxi | 237 | -1.7 | 0.2 | 2.33 | -4 | -1.7 |
Jiangsu | 1428 | -1.6 | -1.3 | 13.87 | -41 | -2.9 |
Anhui | 1484 | 6 | -1.2 | 15.54 | 70 | 4.7 |
Shandong | 2808 | 4.1 | -5.6 | 27.59 | -49 | -1.7 |
Henan | 3347 | 0.8 | -0.2 | 33.67 | 20 | 0.6 |
Hubei | 604 | 0.4 | -3 | 5.88 | -16 | -2.6 |
Sichuan | 571 | -0.2 | -2.9 | 5.53 | -18 | -3.2 |
Shaanxi | 386 | 5.2 | -1.5 | 4.00 | 14 | 3.6 |
Gansu | 332 | -0.1 | 0.3 | 3.33 | 1 | 0.3 |
Xinjiang | 573 | -3 | -2.2 | 5.44 | -29 | -5.1 |
Subtotal | 13071 | 131.05 | 34 | 0.3 | ||
Other provinces | 1426 | 14.11 | -15 | -1.1 | ||
China | 14497 | 2.2 | -2 | 145.16 | 19 | 0.1 |
2.1.2 Early Rice Production Estimation
Remote sensing monitoring and yield verification show that the national early rice planted area in 2025 is 5.246 million hectares, remaining stable above 5.2 million hectares for six consecutive years. Among these, the eight southern provinces of China saw a stable yet growing early rice production, with a total output of 28.03 million tons, an increase of 1.19 million tons (4.4%) compared to the previous year. The planted area was 5.094 million hectares, a year-on-year increase of 0.5%, while the average yield was 5,503 kg/hectare, up 4.0% year-on-year. The growth in yield per hectare became the primary driver of the total output increase. Since the beginning of this year's early rice sowing, the light, temperature, and water conditions in the main production areas of Jiangnan and South China have been well-matched. Common abnormal weather conditions for early rice, such as "spring frost", floods, and the impact of rainfall on rice panicles at anthesis, as well as pest and disease occurrences, have been lighter than in previous years. Overall, these factors have been favorable for early rice growth and yield formation. After entering the maturation and harvest period, the weather in the main production areas has been mostly sunny, which is conducive to the grain-filling and maturing of early rice. The yield per hectare increased by 2.9% year-on-year, driving a 3.5% year-on-year growth in total national early rice output, reaching 28.32 million tons, with a production increase of 0.97 million tons (Table 2.3).
Compared to the continuous heavy rainfall during the heading, flowering, and grain-filling periods of 2024, which affected key yield-forming stages, early rice in Jiangxi in 2025 benefited from favorable light, temperature, and water conditions during critical growth periods, resulting in a significant yield increase of 10.0%. This led to a 0.63 million ton increase in early rice output, a year-on-year growth of 11%. In Hunan, the largest early rice-producing province, the planted area decreased by 1.9%, but the yield per hectare increased by 1.1%, partly offsetting the negative impact of the reduced planted area. The province's early rice output reached 8.73 million tons, a decrease of 0.8% compared to the previous year.
Table 2.3 Early Rice Production for China, 2025
Province | Area (Thousand Hectares) | Yield (Kg/Hectare) | production (Million Tons) | ||||
2025 | Change (%) | 2025 | Change (%) | 2025 | Change | Change (%) | |
Anhui | 188 | -1.5% | 5725 | -7.6% | 1.08 | -0.11 | -9.0% |
Hubei | 139 | -5.1% | 5309 | -7.2% | 0.74 | -0.1 | -11.9% |
Hunan | 1515 | -1.9% | 5761 | 1.1% | 8.73 | -0.07 | -0.8% |
Jiangxi | 1155 | 0.9% | 5451 | 10.0% | 6.3 | 0.63 | 11.0% |
Zhejiang | 109 | 1.8% | 5371 | 3.6% | 0.59 | 0.03 | 5.5% |
Guangdong | 890 | 7.1% | 5186 | 2.8% | 4.62 | 0.43 | 10.1% |
Guangxi | 934 | -1.5% | 5483 | 10.2% | 5.12 | 0.41 | 8.6% |
Fujian | 163 | 3.0% | 5319 | -5.4% | 0.87 | -0.02 | -2.5% |
Subtotal | 5094 | 0.5% | 5503 | 4.0% | 28.03 | 0.12 | 4.4% |
China | 5246 | 0.7% | 5399 | 2.9% | 28.32 | 0.97 | 3.5% |
2.1.3 Single Rice / Semi-late Rice Production Prediction
The overall production situation for medium rice/first-season rice in China in 2025 is unfavorable, with significant regional differences. CropWatch monitoring shows that the total area for medium rice nationwide is 21.601 million hectares, a 1.3% decrease year-on-year. The average yield is 6,263 kg/hectare, down 0.6% from the previous year. The total output is 135.28 million tons, a decrease of 2.62 million tons (1.9%) compared to last year. This result contrasts with earlier predictions, mainly due to the reduction in the area of the main production regions in the northeast and the decline in yield in the middle and lower reaches of the Yangtze River. However, some local areas have achieved significant yield increases through climate adaptation management.
Table 2.4 Single Rice / Semi-late Rice Production Prediciton for China, 2025
Province | Area (Thousand Hectares) | Yield (Kg/Hectare) | production (Million Tons) | ||||
2025 | Change | 2025 | Change | 2025 | Change | Change | |
Anhui | 1942 | -0.8% | 6676 | -4.8% | 12.97 | -0.76 | -5.5% |
Chongqing | 768 | 1.9% | 6239 | 3.6% | 4.79 | 0.25 | 5.5% |
Guizhou | 765 | -1.0% | 7529 | 9.3% | 5.76 | 0.44 | 8.2% |
Heilongjiang | 4660 | -4.5% | 4931 | 3.5% | 22.98 | -0.27 | -1.2% |
Henan | 620 | 0.0% | 6145 | -0.5% | 3.81 | -0.02 | -0.5% |
Hubei | 1359 | 0.5% | 7566 | -7.9% | 10.28 | -0.82 | -7.4% |
Hunan | 1279 | 0.3% | 6818 | 3.9% | 8.72 | 0.35 | 4.2% |
Jiangsu | 2446 | 5.0% | 6234 | -8.3% | 15.25 | -0.59 | -3.7% |
Jiangxi | 467 | 1.8% | 6390 | 0.2% | 2.99 | 0.06 | 2.1% |
Jilin | 915 | -2.8% | 6307 | 3.5% | 5.77 | 0.03 | 0.6% |
Liaoning | 772 | 6.9% | 6213 | 1.5% | 4.8 | 0.38 | 8.5% |
Ningxia | 86 | 18.9% | 7593 | 5.3% | 0.65 | 0.13 | 25.1% |
Shaanxi | 162 | -0.2% | 6167 | -3.6% | 1.00 | -0.04 | -3.7% |
Sichuan | 2162 | 0.1% | 7333 | 5.9% | 15.86 | 0.90 | 6.0% |
Yunnan | 889 | 1.8% | 6781 | 5.3% | 6.03 | 0.41 | 7.3% |
Zhejiang | 743 | 14.3% | 7996 | 3.6% | 5.94 | 0.92 | 18.4% |
Sub total | 20035 | 0.3% | 6368 | 0.8% | 127.58 | 137 | 1.1% |
China | 21601 | -1.3% | 6263 | -0.6% | 135.28 | -2.62 | -1.9% |
Zhejiang has become the province with the largest increase in the country. CropWatch shows that its early rice area expansion mainly comes from replanting abandoned farmland, combined with a 3.6% increase in yield (7,996 kg/hectare), resulting in a total output of 5.94 million tons, a year-on-year increase of 18.4%. Ningxia, relying on good irrigation facilities, saw both rice yield and planted area increase simultaneously, with a total rice output of 0.65 million tons, a remarkable growth of 25.1%.
The southwest production area has seen steady progress. Sichuan achieved a significant 5.9% increase in yield (7,333 kg/hectare), with total output growing by 6.0% to 15.86 million tons, while CropWatch shows that the NDVI peak in its basin area is higher than usual. Yunnan's rice yield increased by 5.3%, reaching a total output of 6.03 million tons, up 7.3%. Chongqing saw both an increase in planted area and yield, achieving a 5.5% growth in total output.
The middle and lower reaches of the Yangtze River experienced climate impacts. While Jiangsu's rice planted area expanded by 5.0% year-on-year to 2.446 million hectares, continuous heavy rainfall led to insufficient photosynthetically active radiation during the grain-filling period, causing a decline in yield by 8.3%. The total output is expected to be 15.25 million tons, a decrease of 3.7% year-on-year. In Hubei and Anhui, rice yields declined, and production is lower than in 2024 due to the drop in yield.
The northeast production area has undergone structural adjustments. As the largest medium rice-producing region, Heilongjiang saw a 3.5% increase in first-season rice yield. However, due to a reduction in planted area, the province's first-season rice output decreased to 22.98 million tons, down by 1.2%. In Liaoning, rice planted area expanded by 6.9%, with yield increasing by 1.5%, resulting in an 8.5% increase in total output.
In the coming month, the middle and lower reaches of the Yangtze River may be affected by typhoons, so proper field drainage measures should be taken to restore soil aeration. The southwest region needs to guard against the impact of stage-specific droughts on grain filling and manage irrigation water use appropriately.
2.1.4 Maize Production Prediction
In 2025, China's maize production exhibited a trend of reduced planted area, increased yield per hectare, and steady growth in total output. The national maize planted area reached 41,139 thousand hectares, a slight decrease of 0.4% year-on-year (Figure 2.2). Meanwhile, the average national yield rose to 6,121 kg/ha, an increase of 1.6%, largely attributable to generally favorable agro-meteorological conditions in major maize-producing regions. The total maize output is projected to reach 251.82 million tons, reflecting a 1.1% growth compared to 2024.
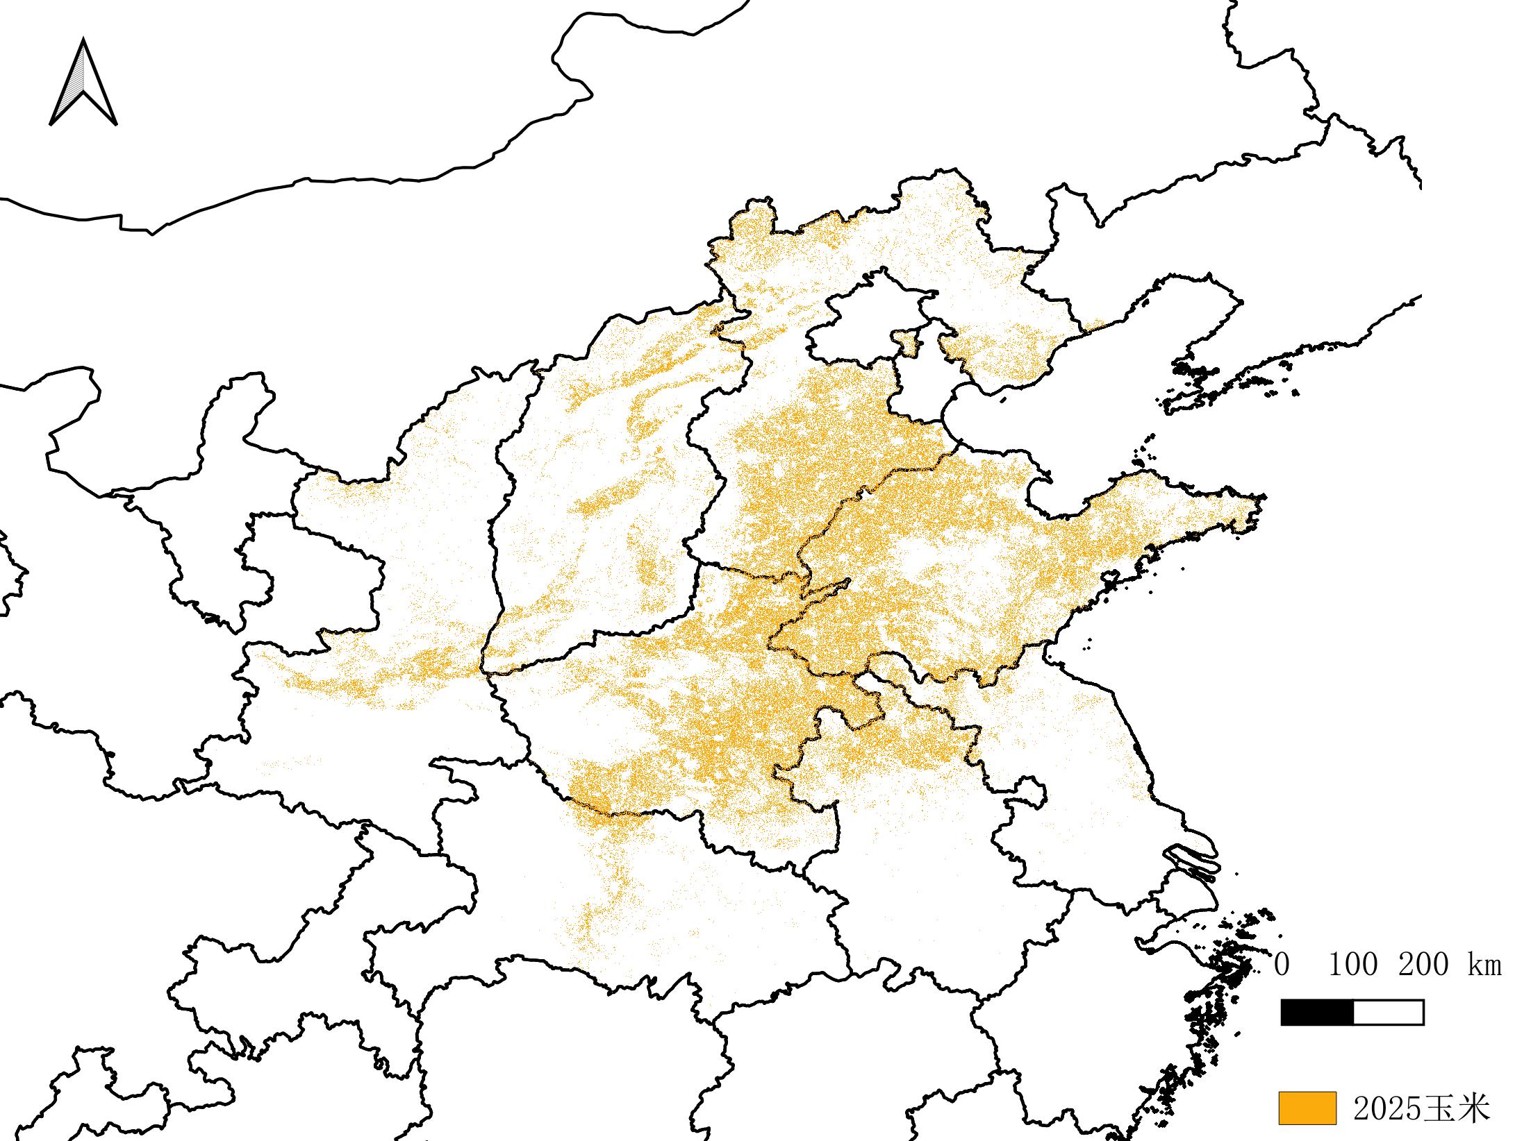
Figure 2.2 Spatial Distribution of Maize in North China in 2025
Table 2.4 Maize Production Prediciton for China, 2025
Province | Area (Thousand Hectares) | Yield (Kg/Hectare) | production (Million Tons) | ||||
2025 | Change (%) | 2025 | Change (%) | 2025 | Change | Change (%) | |
Anhui | 841 | -1.0% | 5021 | -5.0% | 4.22 | -27 | -6.0% |
Chongqing | 434 | 0.4% | 4555 | 0.3% | 1.98 | 1 | 0.7% |
Gansu | 970 | -5.2% | 5511 | 0.8% | 5.34 | -25 | -4.5% |
Guizhou | 1057 | -1.5% | 4630 | -0.8% | 4.89 | -11 | -2.3% |
Hebei | 2968 | -5.0% | 6389 | 6.0% | 18.96 | 13 | 0.7% |
Heilongjiang | 6838 | 2.4% | 7140 | 5.6% | 48.82 | 367 | 8.1% |
Henan | 3087 | 5.0% | 5499 | -3.0% | 16.97 | 31 | 1.8% |
Hubei | 821 | -4.0% | 6177 | 1.0% | 5.07 | -16 | -3.0% |
Inner Mongolia | 4411 | 1.6% | 5544 | 4.0% | 24.46 | 130 | 5.6% |
Jiangsu | 455 | 4.0% | 5255 | -2.0% | 2.39 | 5 | 1.9% |
Jilin | 5079 | 5.6% | 7437 | 4.0% | 37.77 | 338 | 9.8% |
Liaoning | 2301 | -5.3% | 6615 | 4.3% | 15.22 | -19 | -1.2% |
Ningxia | 254 | 11.8% | 8052 | 5.1% | 2.04 | 30 | 17.5% |
Shaanxi | 872 | 9.0% | 5962 | 0.0% | 5.20 | 43 | 9.0% |
Shandong | 3435 | 7.0% | 5867 | -1.0% | 20.15 | 113 | 5.9% |
Shanxi | 1550 | 2.0% | 6459 | 1.0% | 10.01 | 29 | 3.0% |
Sichuan | 1339 | 0.1% | 4791 | -1.9% | 6.42 | -11 | -1.8% |
Xinjiang | 1293 | 10.3% | 7592 | -0.1% | 9.82 | 90 | 10.1% |
Yunnan | 1471 | -3.0% | 4361 | -0.5% | 6.41 | -23 | -3.5% |
Subtotal | 39474 | 1.8% | 6236 | 2.6% | 246.16 | 1059 | 4.5% |
China | 41139 | -0.4% | 6121 | 1.6% | 251.82 | 285 | 1.1% |
The distribution of maize production exhibited a "growing in the North, stable in the South" pattern. Northeast and Northwest China saw strong output growth, with Xinjiang recording a 10.3% increase in planted area and a 10.1% rise in production, resulting in an output increase of 0.9 million tons. Jilin achieved a 9.8% growth in output, driven by a 5.6% expansion in planted area and a 4.0% improvement in yield per hectare. Heilongjiang, the largest maize-producing province, reported a 5.6% year-on-year increase in planted area. Favorable weather conditions during the growing season led to a 2.4% rise in average yield compared to 2024, bringing total output to 48.82 million tons—an increase of 3.67 million tons, or 8.1%. In contrast, Liaoning experienced a 5.3% reduction in planted area, which offset gains from higher yields, leading to a 1.2% decline in output. Ningxia stood out with a remarkable 17.5% growth in production.
On the other hand, some southern provinces saw a decrease in output. Anhui reported a 7.0% year-on-year decline in production due to reduced yield and planted area. In Hubei, maize planted area fell by approximately 4.0%, and although yield per hectare increased by 1.0%, total output still decreased by 160,000 tons.
This regional divergence stems from variations in climate conditions, policy guidance, and technology adoption. The suitable light and temperature conditions in the Northeast and Northwest, coupled with effective large-scale farming and technology extension, contributed to the growth. In contrast, some southern regions were affected by unfavorable weather and adjustments in crop planting structure. Overall, the increase in northern production effectively compensated for the decline in the South, ensuring sufficient national maize supply and providing a solid foundation for China’s food security.
2.1.5 Soybean Production Prediction
China's soybean production is projected to reach 19.16 million tons in 2025, marking a 2.7% increase compared to 2024. The output exhibits a distinct regional pattern of "growth in the north and decline in the south." The northeastern producing regions emerged as the main driver of this growth, with Heilongjiang (+4.3%), Inner Mongolia (+4.9%), Jilin (+7.8%), and Liaoning (+12.0%) all recording significant gains. This expansion was largely attributed to favorable weather conditions, expanded planted area (Figure 2.3), increased accumulated temperatures, and the adoption of high-yielding soybean varieties.

Figure 2.3 Spatial Distribution of maize crops in Northeast China in 2025
(Green for maize, Organge for soybean and blue for rice; a, Northeast China for 2024;b, Northeast China for 2025;c,Zoom in map of Jiamusi 2024;d,Zoom in map of Jiamusi 2025;e,Zoom in map of Heihe 2024;f,Zoom in map of Heihe 2025)
In contrast, the Huang-Huai-Hai region experienced widespread production declines. Provinces such as Shanxi (-9.0%), Jiangsu (-7.9%), Shandong (-5.6%), and Henan (-4.2%) were notably affected by persistent drought and localized flooding. This regional divergence underscores the further consolidation of Northeast China's role as the "ballast stone" of the country's soybean supply, while also highlighting the growing challenges posed by climate change to traditional soybean-producing areas.
Table 2.4 Soybean Yield Forecast for China
Province | production (Thousand Tons) | |||
2024 | 2025 | Change | Change (%) | |
Anhui | 100.2 | 99.9 | -0.3 | -0.3 |
Hebei | 20.3 | 19.7 | -0.6 | -3.2 |
Heilongjiang | 690.3 | 719.9 | 29.6 | 4.3 |
Henan | 86.2 | 82.6 | -3.6 | -4.2 |
Inner Mongolia | 186.1 | 195.1 | 9 | 4.9 |
Jiangsu | 84.1 | 77.5 | -6.6 | -7.9 |
Jilin | 76.2 | 82.1 | 5.9 | 7.8 |
Liaoning | 45.8 | 51.3 | 5.5 | 12 |
Shandong | 72.3 | 68.2 | -4.1 | -5.6 |
Shanxi | 15.8 | 14.4 | -1.4 | -9 |
Subtotal | 1377.3 | 1410.7 | 33.5 | 2.4 |
Other Regions | 487.7 | 505.3 | 18 | 3.7 |
China | 1865 | 1916 | 51 | 2.7 |