
 English
 中文

Bulletin
CropWatch bulletinMenu
Authors: air_panqc | Edit: Miao
From May to July 2025, India entered the concentrated sowing period of the Kharif (monsoon) season for major crops, including main-season rice, maize, and soybean.
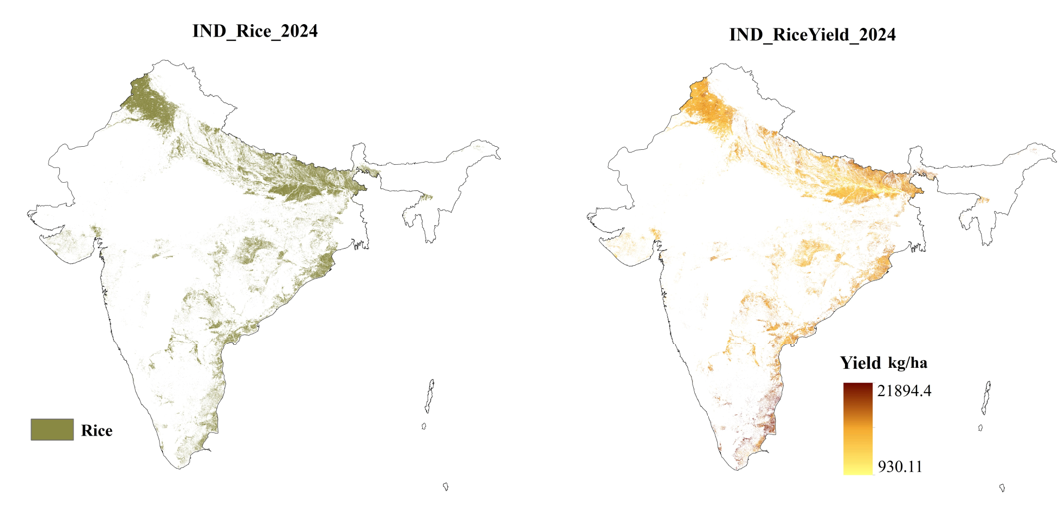
Figure2.6 Rice distribution and yield levels in India in 2024
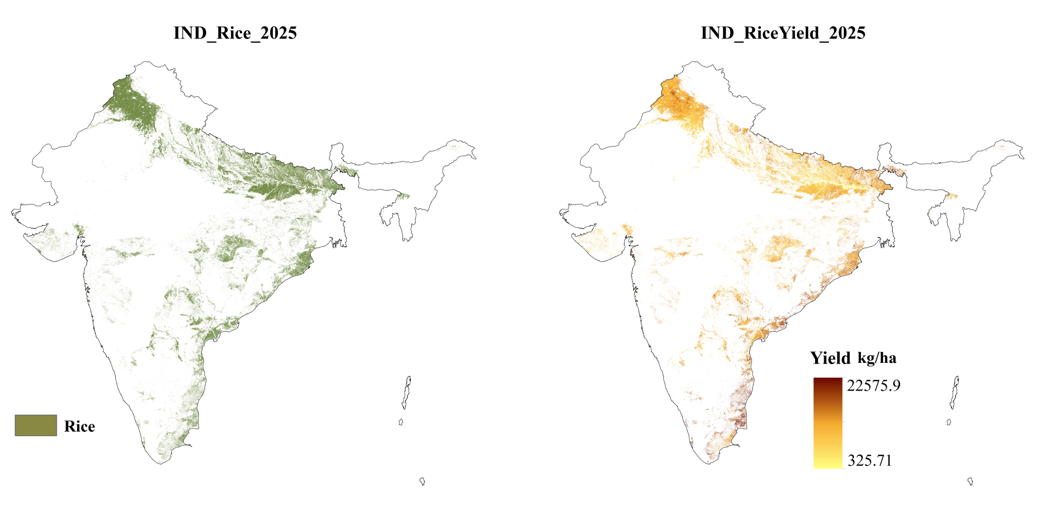
Figure2.7 Rice distribution and yield levels in India in 2025
CropWatch monitoring indicated that the spatial distribution of rice in 2025 was generally similar to that of the previous year, with enhanced vegetation signals observed in Punjab and Haryana in the north, and Odisha and Andhra Pradesh along the eastern coast, reflecting localized area expansion or improved crop conditions. Yields increased significantly in high-yield irrigated rice areas and some rainfed regions, with an expansion of high-yield zones, although yield bottlenecks persisted in parts of the southern coastal low-yield areas. The maize cultivation belt shifted slightly compared to last year, with increases in sown area in Odisha, Bihar, and Assam in the east, and slight reductions in some southern regions. According to agro-climatic indicators, the CALF was only 70%, 13 percentage points below the 5-year average, suggesting that some land was not planted in time due to climatic constraints or cropping structure adjustments.
In terms of yields, increases were observed in some high-yield areas in the east and south. However, declines occurred in parts of the central and western rainfed zones due to insufficient rainfall and delayed sowing. Agro-climatic analysis showed that the national cumulative RAIN from May to July averaged 561 mm, 21% below the 15-year average, with the monsoon rainfall slightly inadequate, constraining sowing and emergence in the central and western coastal rainfed zones. The VCIx stood at 0.87, and the CroPI at 0.88, both at moderate levels, while the PDSI (1.98) and CWSI (1.39) indicated localized drought, without severe nationwide impacts.
CropWatch results showed that the national rice sown area was 44,255 thousand hectares, down 1.2% from last year, but yield increased by 3.3% to 4,853 kg/ha, bringing total output to 214.75 million tonnes, a year-on-year increase of 2.1%. The maize sown area was 11,907 thousand hectares, up 2.4%, but yield decreased by 3.1% to 3,684 kg/ha, with total output of 43.86 million tonnes, a year-on-year decrease of 0.8%. At the agro-ecological zone (AEZ) level, rice production growth was concentrated in the central region, northeastern India, and the Rajasthan–Gujarat zone, where both sown area and yield increased significantly, resulting in total output growth of 12%–26%. In contrast, the western arid zone and western Himalaya zone experienced reductions of more than 14% in total rice output due to decreases in sown area or yield. For maize, output increases were notable in the eastern coastal zone, the Rajasthan–Gujarat zone, and the western arid zone, with the latter seeing a remarkable 74.2% increase in total output; however, the central and western coastal zones recorded substantial declines of 14.1% and 24.9%, respectively.
Overall, rice production in India during this period remained stable with a slight increase, as yield improvements in high-yield irrigated areas and some rainfed regions offset the reduction in sown area. Maize production showed structural divergence, with significant area expansion in some zones, but the combination of drought and uneven rainfall distribution led to a slight national decline in total output. The spatial variability of climatic conditions had a pronounced impact on rainfed crops, while regions with adequate irrigation demonstrated greater yield resilience. The final Kharif season output will still depend on the continuity and uniformity of monsoon rainfall, and if rainfall conditions improve, the yield potential in low-yield areas is expected to further recover.
Table 2.8 Rice and maize sown area, yield, and total output in India, 2024–2025
India | Area (thousand hectares) | Yield (kg/ha) | Total Output (10,000 tonnes) | ||||||
Crop | 2024 | 2025 | Inter-annual Change | 2024 | 2025 | Inter-annual Change | 2024 | 2025 | Inter-annual Change |
Rice | 44799 | 44255 | -1.2% | 4696 | 4853 | 3.3% | 21037 | 21475 | 2.1% |
Maize | 11630 | 11907 | 2.4% | 3800 | 3684 | -3.1% | 4420 | 4386 | -0.8% |
Area (thousand hectares) | Yield (kg/ha) | Total Output (10,000 tonnes) | |||||||
AEZ | 2024 | 2025 | Inter-annual Change | 2024 | 2025 | Inter-annual Change | 2024 | 2025 | Inter-annual Change |
Central | 3612 | 4044 | 12.0% | 3997 | 4508 | 12.8% | 1444 | 1823 | 26.3% |
East_coast | 6942 | 6752 | -2.7% | 6160 | 6936 | 12.6% | 4277 | 4683 | 9.5% |
Gangatic_plain | 19873 | 19802 | -0.4% | 3801 | 3842 | 1.1% | 7554 | 7607 | 0.7% |
NE | 504 | 493 | -2.2% | 6104 | 7014 | 14.9% | 308 | 346 | 12.3% |
Rajastan_Gujarat | 839 | 914 | 9.0% | 3299 | 3722 | 12.8% | 277 | 340 | 23.0% |
West_coast | 714 | 882 | 23.5% | 5982 | 6054 | 1.2% | 427 | 534 | 25.0% |
West_dry | 151 | 151 | 0.1% | 2688 | 2283 | -15.0% | 40 | 34 | -14.9% |
West_Himalayan | 174 | 173 | -0.3% | 5616 | 4727 | -15.8% | 98 | 82 | -16.1% |
Area (thousand hectares) | Yield (kg/ha) | Total Output (10,000 tonnes) | |||||||
AEZ | 2024 | 2025 | Change | 2024 | 2025 | Change | 2024 | 2025 | Change |
Central | 1844 | 1674 | -9.2% | 3735 | 3532 | -5.4% | 689 | 591 | -14.1% |
East_coast | 3660 | 4455 | 21.7% | 3801 | 3931 | 3.4% | 1391 | 1751 | 25.9% |
Gangatic_plain | 2130 | 2455 | 15.2% | 3728 | 3417 | -8.3% | 794 | 839 | 5.6% |
NE | 1087 | 704 | -35.2% | 4298 | 4042 | -6.0% | 467 | 285 | -39.1% |
Rajastan_Gujarat | 467 | 661 | 41.4% | 3189 | 3278 | 2.8% | 149 | 217 | 45.3% |
West_coast | 2371 | 1879 | -20.8% | 3869 | 3669 | -5.2% | 917 | 689 | -24.9% |
West_dry | 20 | 32 | 58.1% | 2924 | 3221 | 10.2% | 6 | 10 | 74.2% |
West_Himalayan | 17 | 16 | -5.3% | 4124 | 3904 | -5.3% | 7 | 6 | -10.4% |