
 English
 中文

Bulletin
CropWatch bulletinMenu
Authors: Miao | Edit: Miao
CropWatch covers more than 95 countries around the world with large areas of cultivated land and monitors a wide range of crop growth-related indicators. These monitoring data support agricultural decision-making and forecasting, helping countries to understand crop growth, agronomic conditions and agricultural production. Specifically, CropWatch provides the following types of charts and tables for each country to analyze. Through these charts and tables, the CropWatch team provides comprehensive and accurate data to support agricultural monitoring, helping countries to understand trends in crop growth and climate conditions in a timely manner, thus providing an important basis for agricultural decision-making.
l Major crop phenology charts: The phenology charts of major crops show the growth cycle of a crop from sowing to maturity. These charts help to analyze the growth stage and growth cycle of the crop and provide important information on the developmental process of the crop.
l NDVI-based Crop Growth Process Lines: These charts are based on Normalized Vegetation Index (NDVI) data and show the changes in vegetation cover of a crop at different growth stages, providing a clear picture of the crop's growth status and health.
l Seasonal Maximum Vegetation Condition Index (VCIx): This chart shows the vegetation condition in different areas, reflecting the growth of the crop and the optimum conditions for vegetation cover through the NDVI values. This provides a basis for assessing the potential for crop growth and the overall production situation.
l NDVI distance level spatial clustering map (compared with 5-year average): This map shows the deviation of crop growth conditions from the average NDVI value for the same period in the past five years, which helps to analyze whether there is any anomaly in crop growth in a certain area and further identify possible risks of agricultural conditions.
l NDVI distance level clustered process line: Through the NDVI distance level process line, we can observe the time series change of crop growth and its deviation from historical data, and then assess whether the crop growth is in a normal or abnormal state.
l Precipitation time-series process line: This time-series map shows the trend of precipitation in a certain area. It provides visual data for analyzing changes in water resources in agricultural production and helps predict the impact of moisture conditions on crop growth.
l Temperature Time Series Process Line: The time series process line for temperature shows fluctuations in regional temperature. By comparing historical and current temperature trends, agriculture departments can better assess the impact of temperature changes on crop growth.
l NDVI-based Crop Growth Process Lines by Agro-ecological Sub-region: This map shows the crop growth in different agro-ecological sub-regions. Combined with the NDVI data, it reflects the spatial distribution and differences of crop growth in each region.
l Crop Production Situation Index (CPI) Time Series Map: This map shows the crop production situation index through a time series, which helps decision makers to track the trend of agricultural production and identify potential production problems in time.
l Agrometeorological Indicator Tables for the Same Period as the Past 15 Years (15YA): These tables summarize data on agrometeorological indicators for the same period as the past 15 years, including cumulative precipitation, average air temperature, photosynthetically active radiation (PAR), and potential cumulative biomass. These indicators help to understand the long-term impact of climatic conditions on agricultural production.
l Table of Agricultural Situation Indicators for the Same Period as the Last 5 Years (5YA): this table shows the agricultural situation indicators for the same period of the last five years, including the percentage of cultivated land under cultivation, the index of optimal vegetation condition, and the index of crop production situation. These indicators help to analyze the trends and changes in agricultural production in recent years, especially when compared with the same period in the past, and can effectively reveal normal fluctuations and abnormalities in the agricultural situation.
Through these charts and tables, the CropWatch team provides comprehensive and precise data support for agricultural monitoring. For more details, visit:
http://cloud.cropwatch.com.cn/web/report/graphlist?id=310
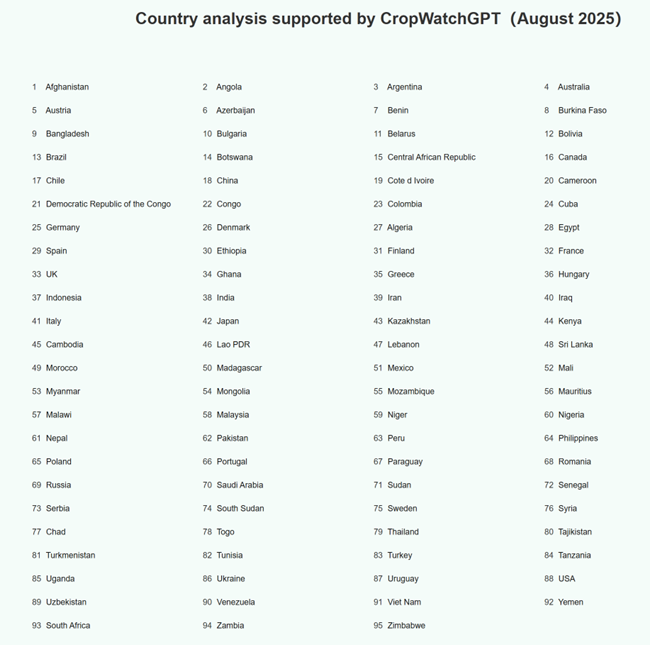
Figure 3.1 The list of 95 monitored countries