
 English
 中文

Bulletin
CropWatch bulletinMenu
Authors: qinxl,lirui | Edit: zenghongwei
1.1.1 Global Crop Production Index
From July to September 2025, the Global Crop Production Index (CroPI) reached 1.06, significantly higher than the baseline of 1.0 and marking the second‑highest value in the past five years, second only to 1.08 observed in 2020. This indicates that global agricultural production conditions were generally better than average, with agricultural systems showing strong resilience and adaptability under complex climatic conditions (Figure 1.1).
In the 2020-2025 time series, the global CroPI followed a "decline followed by recovery" pattern: after bottoming out during 2021- 2023, it began to rebound in 2024 and maintained a steady upward trend through 2025.
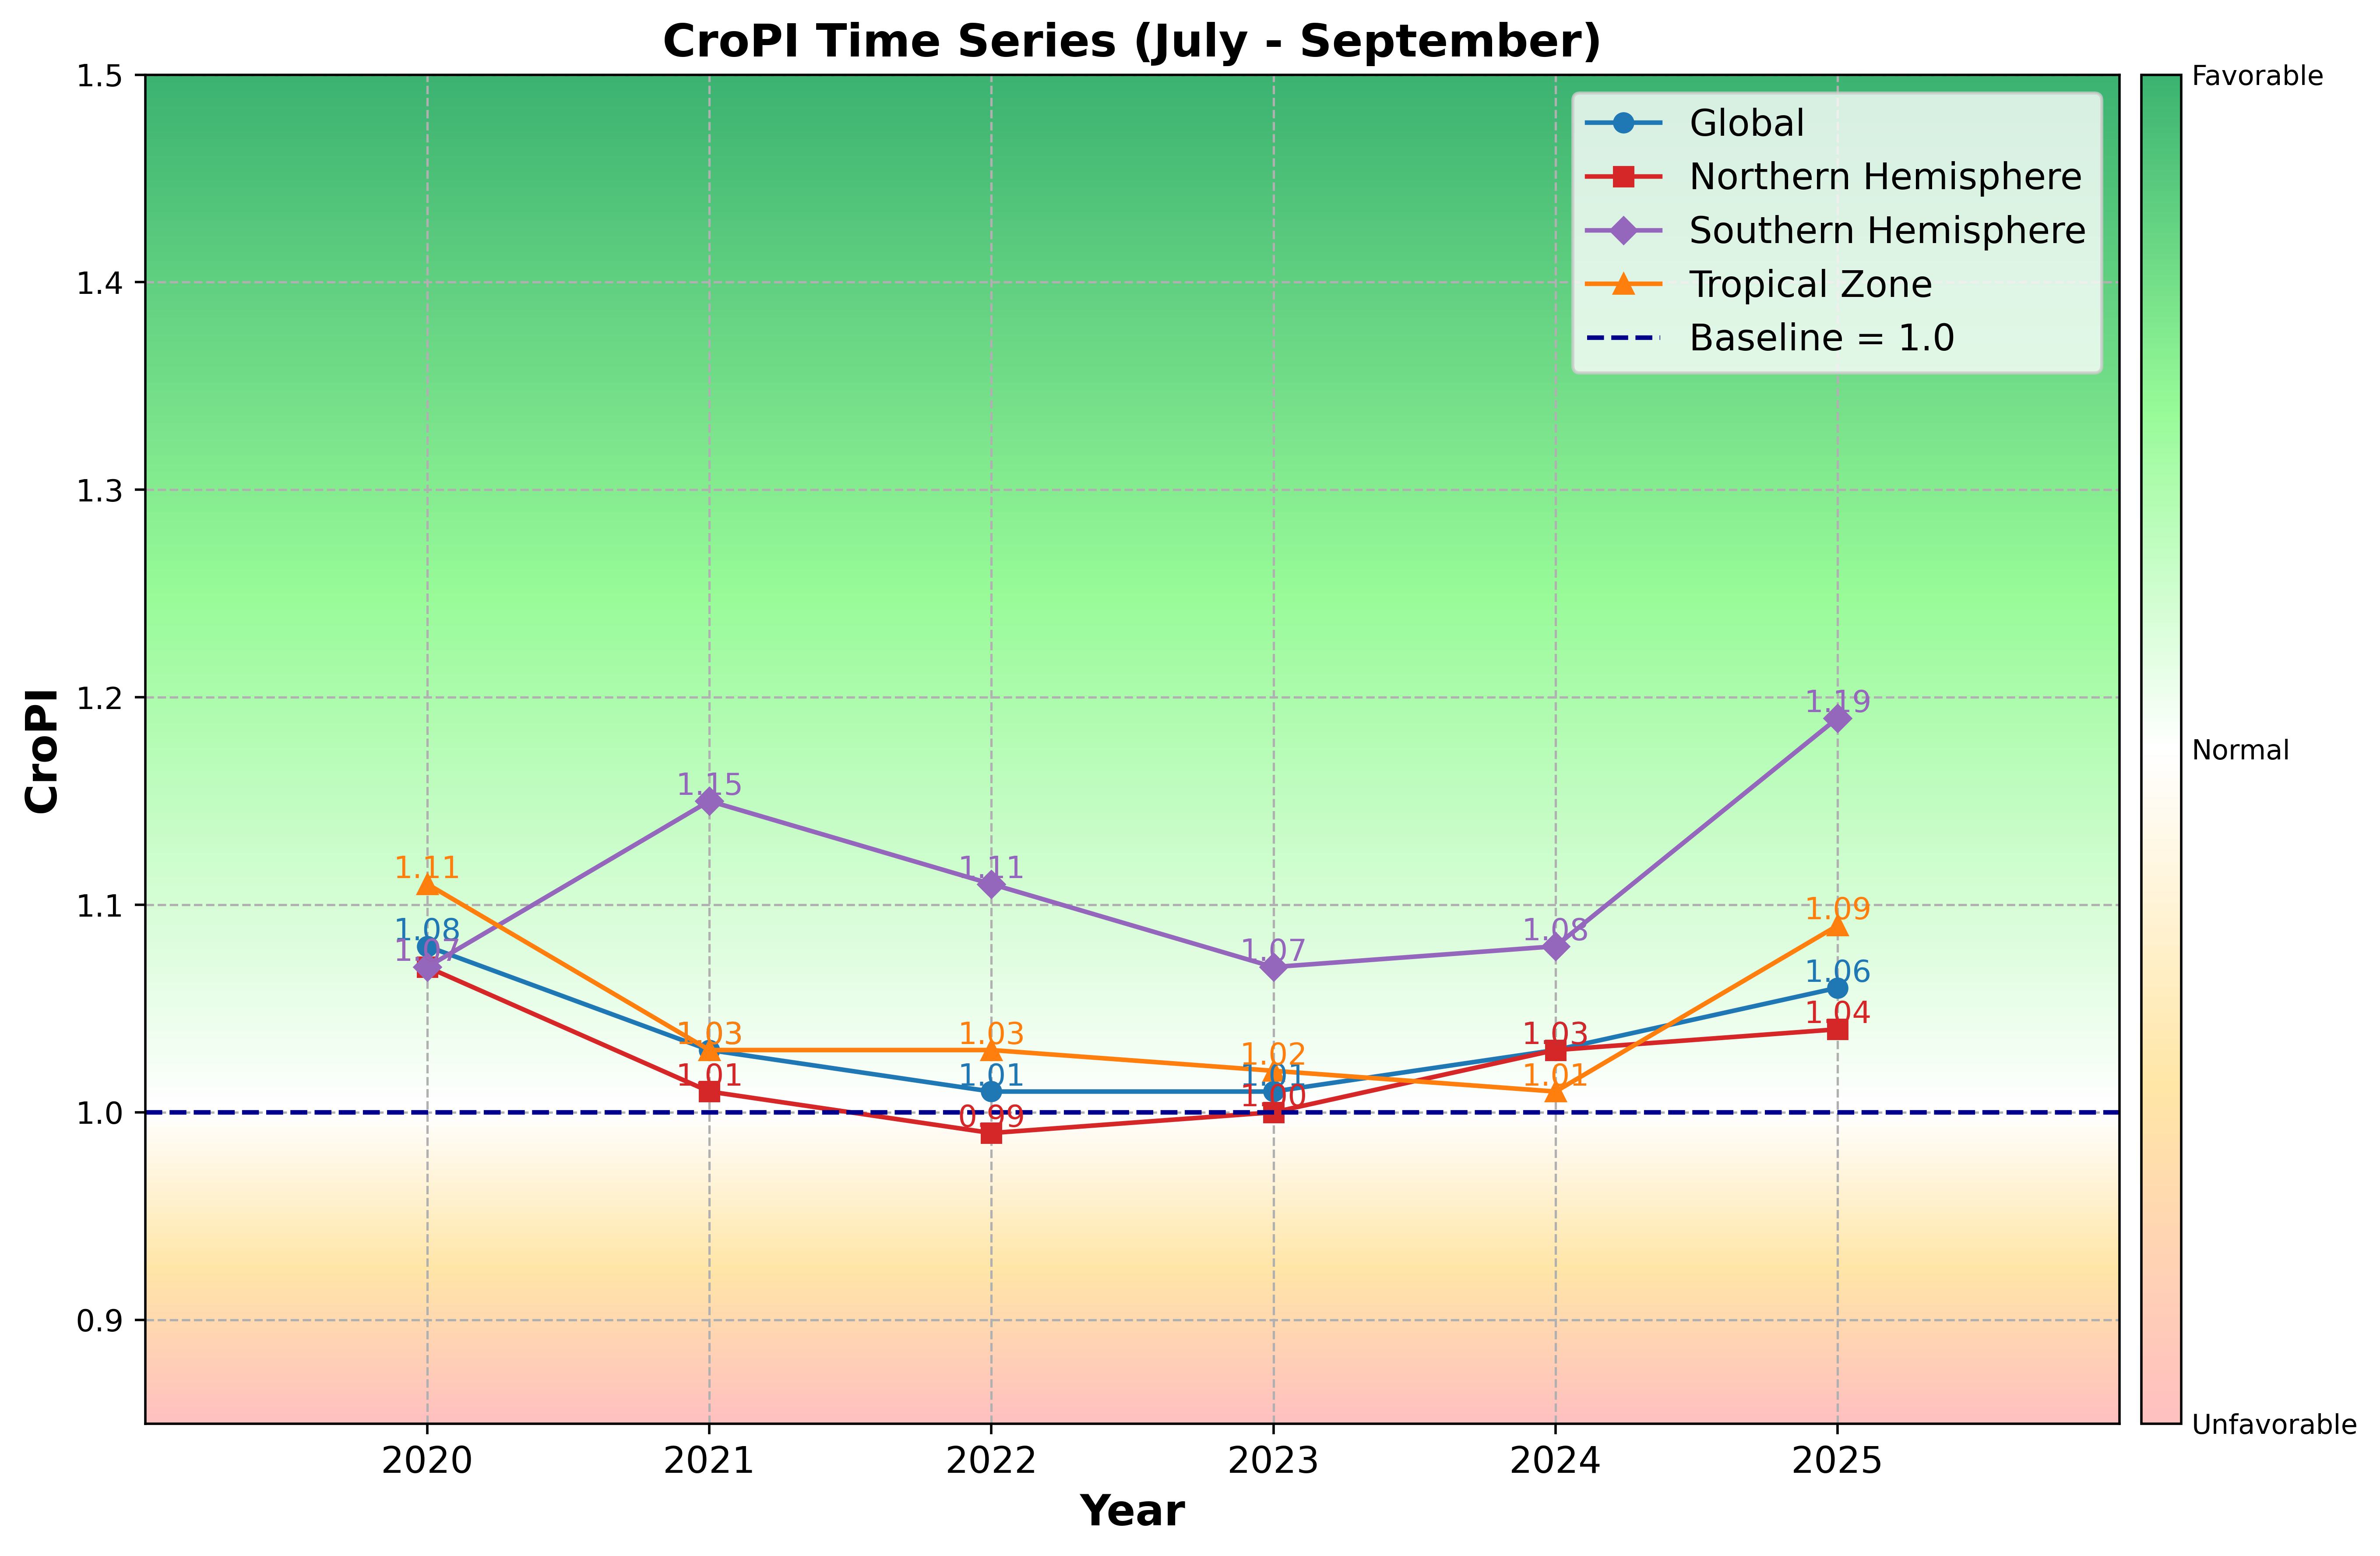
Figure 1.1 Time Series Trends of Regional CroPI, July–September 2020–2025
By region, the CroPI for the Northern Hemisphere was 1.04, slightly higher than the same period last year and remaining at normal to favorable levels; the Southern Hemisphere CroPI reached 1.19, the highest in the past five years; and the tropical CroPI was 1.09, an increase of 0.06 over last year. This formed an overall pattern of "strong South, stable North, and generally positive" (Figure 1.2).
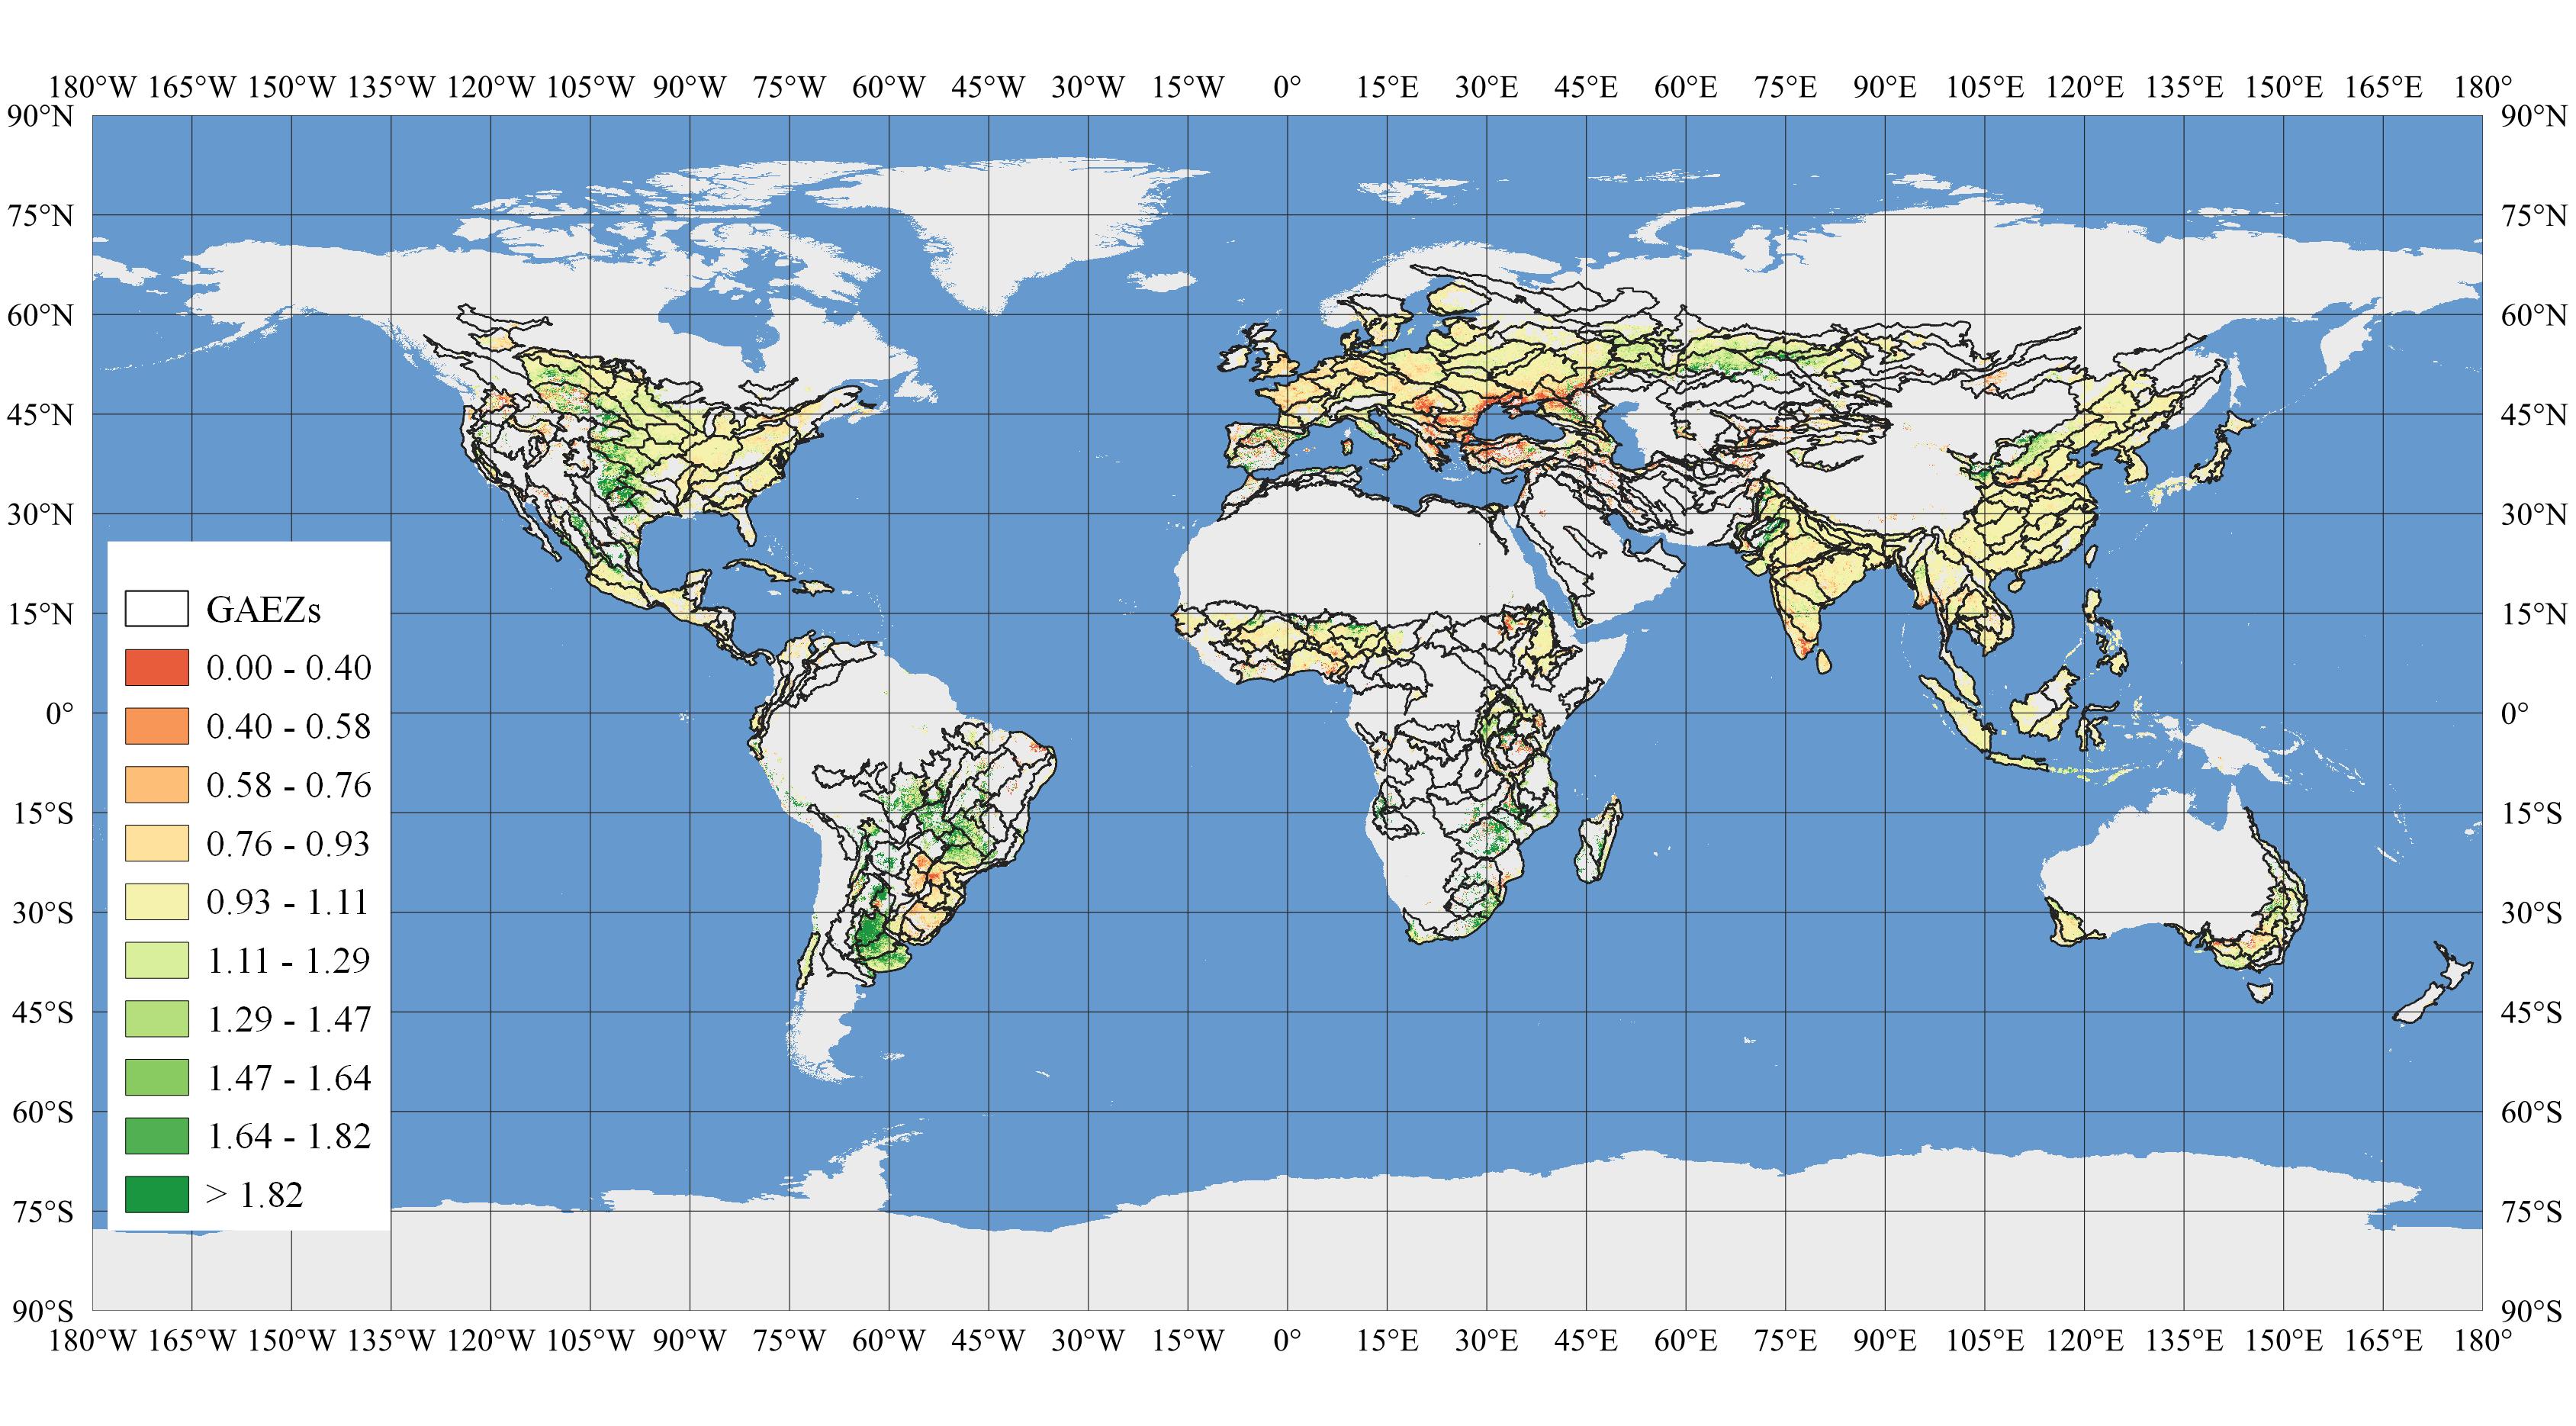
Figure 1.2 Global CroPI Distribution Map, July–September 2025
1.1.2 Agro-climatic condition
During the monitoring period, global climate was generally warmer and drier than average. Compared with the 15‑year average for the same period, approximately 70% of agricultural areas received over 10% less precipitation, with more than 30% of areas experiencing deficits greater than 30%. In contrast, some localities in East Asia, southern South America, and southeastern Australia saw notable increases in precipitation (+10–30%). Average temperatures were 0.5–1.5°C above the 15‑year average in most regions, with only a few high‑latitude and coastal areas slightly cooler (±0.5°C). Photosynthetically Active Radiation (RADPAR) was 5–10% higher than average in most areas, exceeding +10% locally—overall, light conditions were favorable.
Imbalances in water and heat led to marked spatial differentiation in Potential Biomass (BIOMSS): declines of ≥10% occurred in central North America, northeastern South America, northern Africa, and northern South Asia, while increases of more than +10% were observed in southern South America, East Asia, and southeastern Australia. These patterns reflect a global agricultural landscape where "drought–heat stress coexists with local improvements" (Figure 1.3).
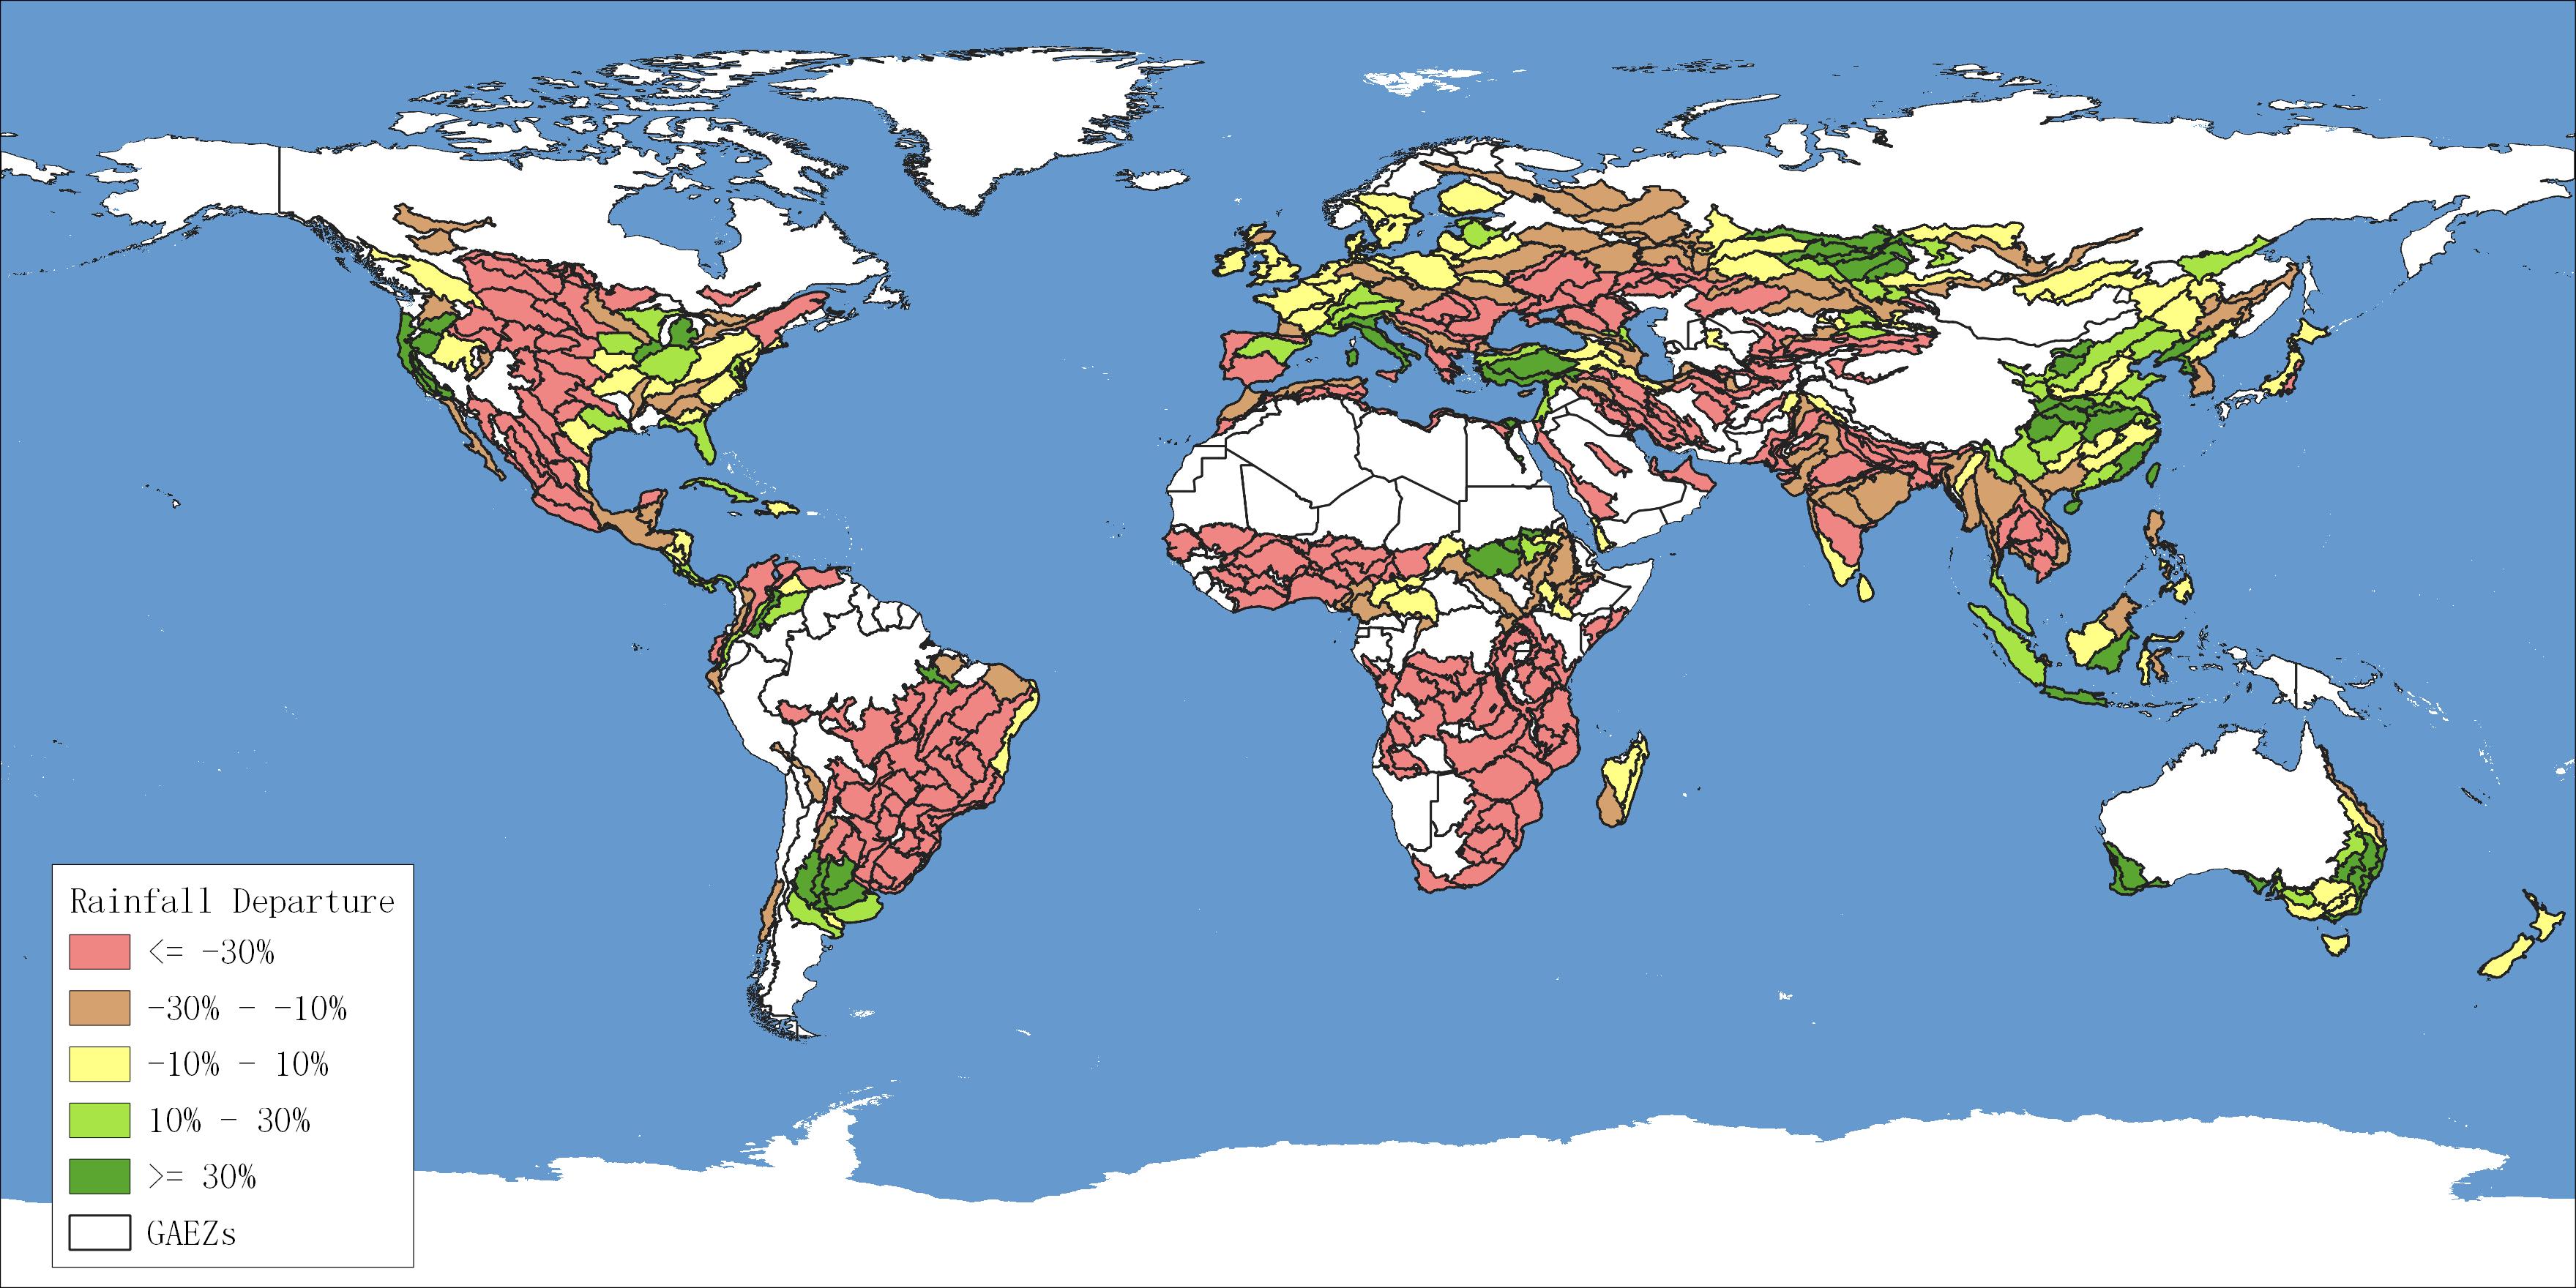
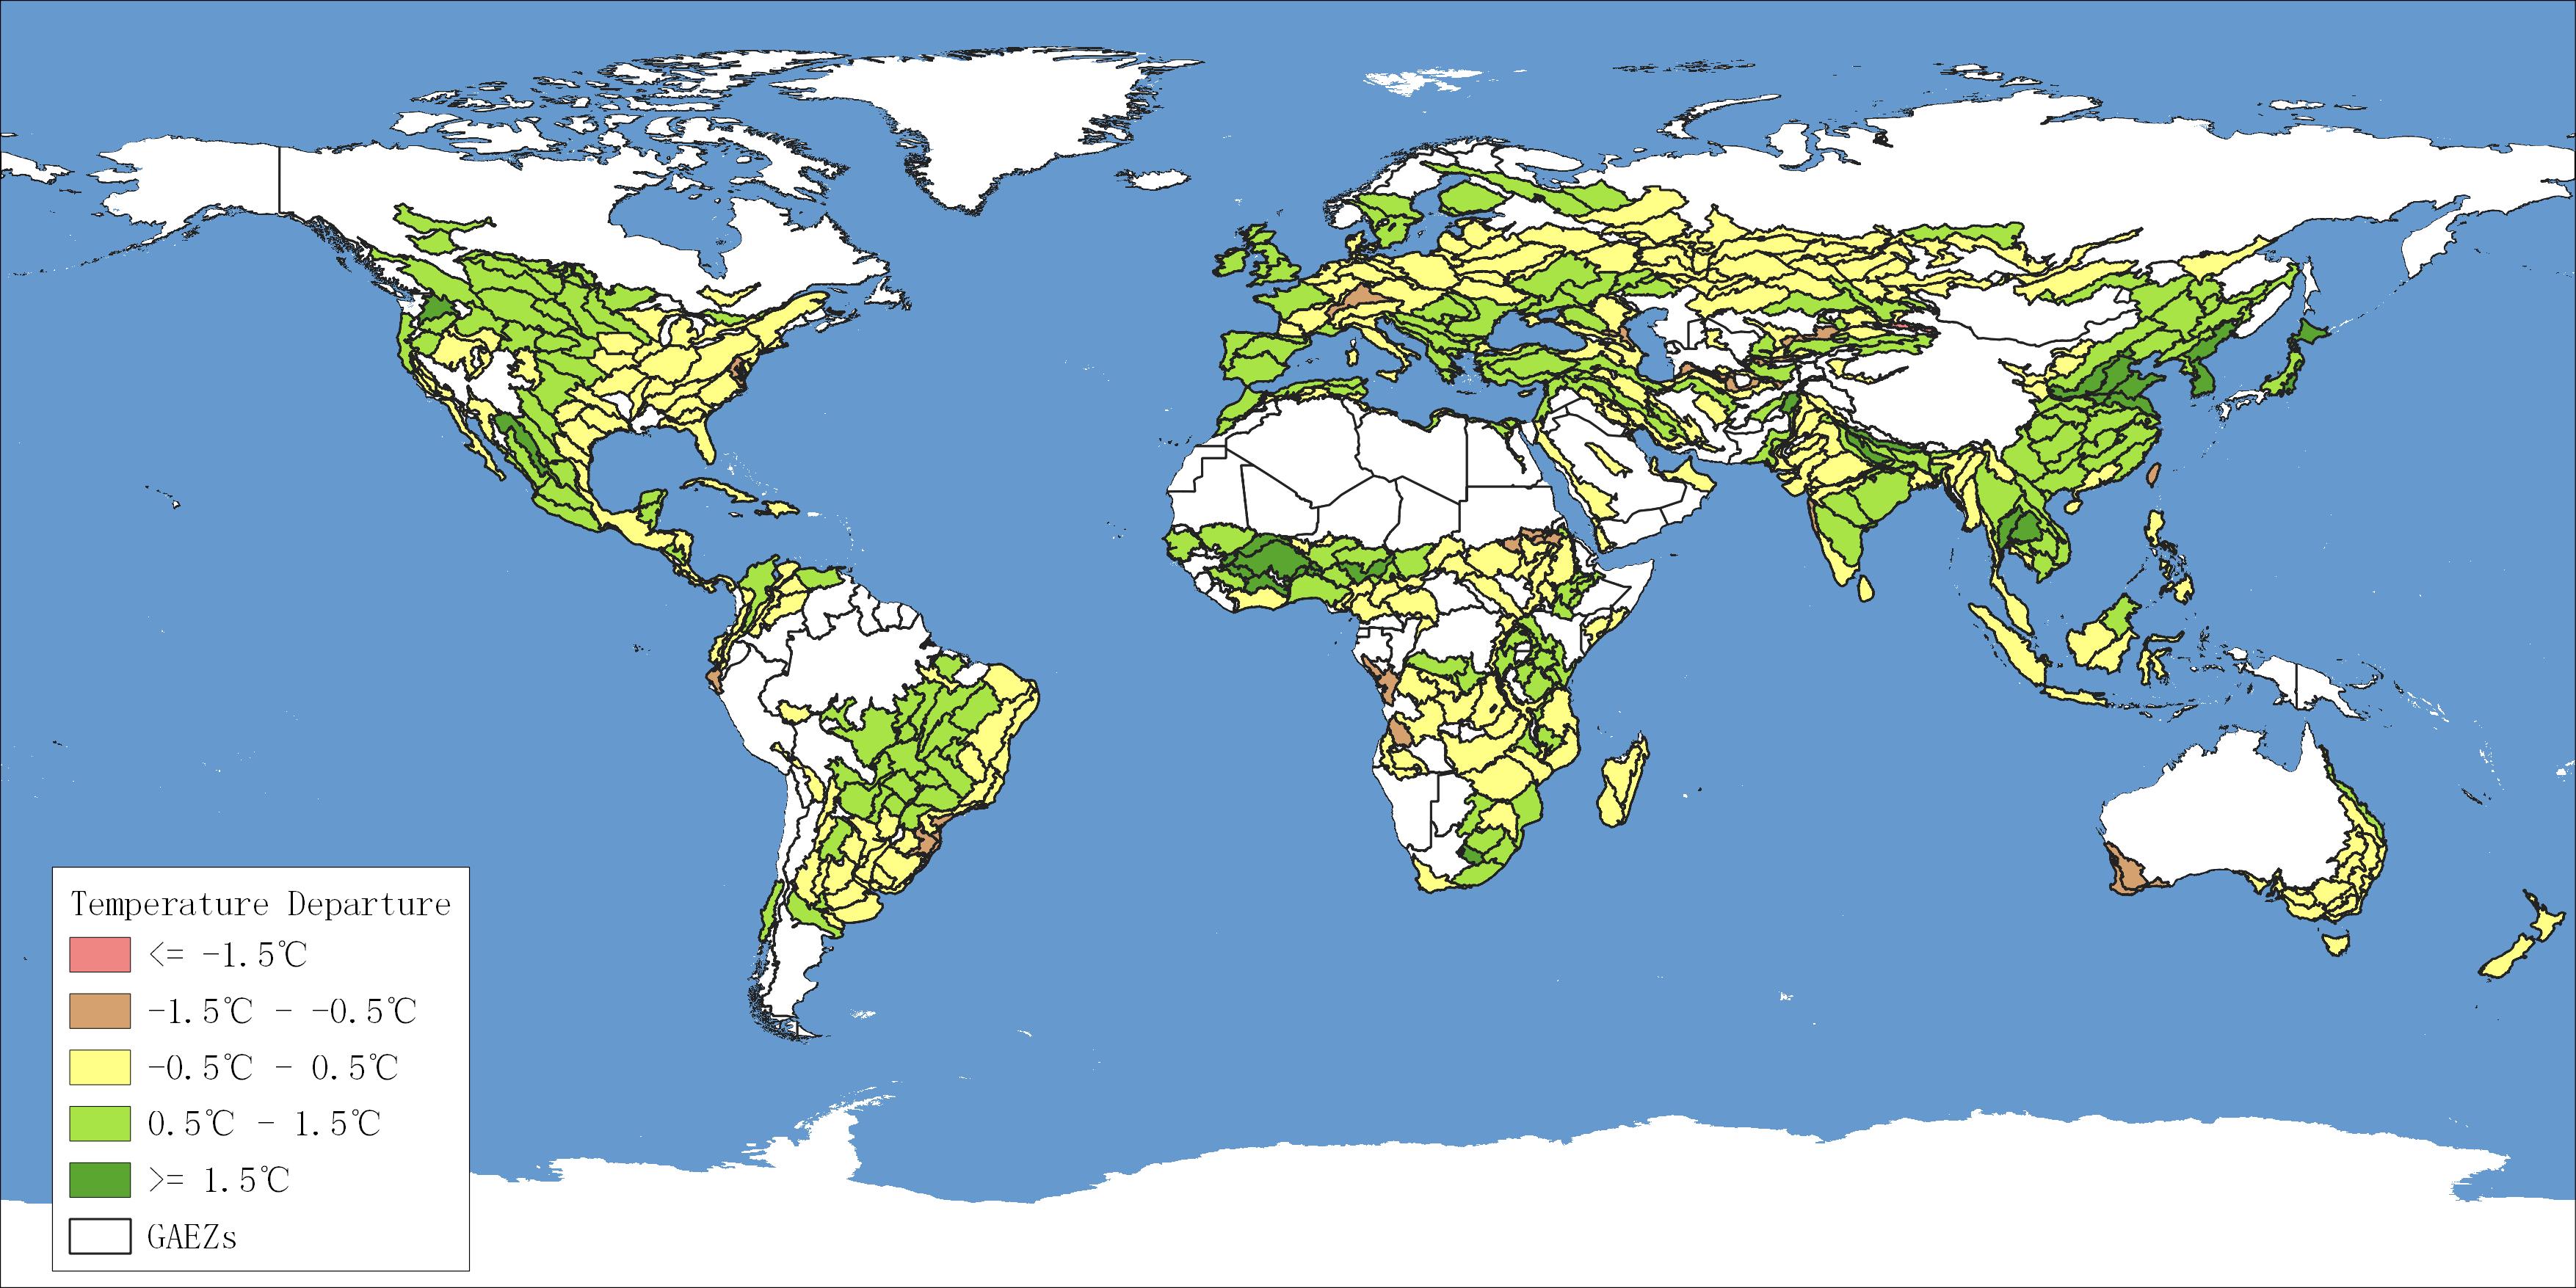
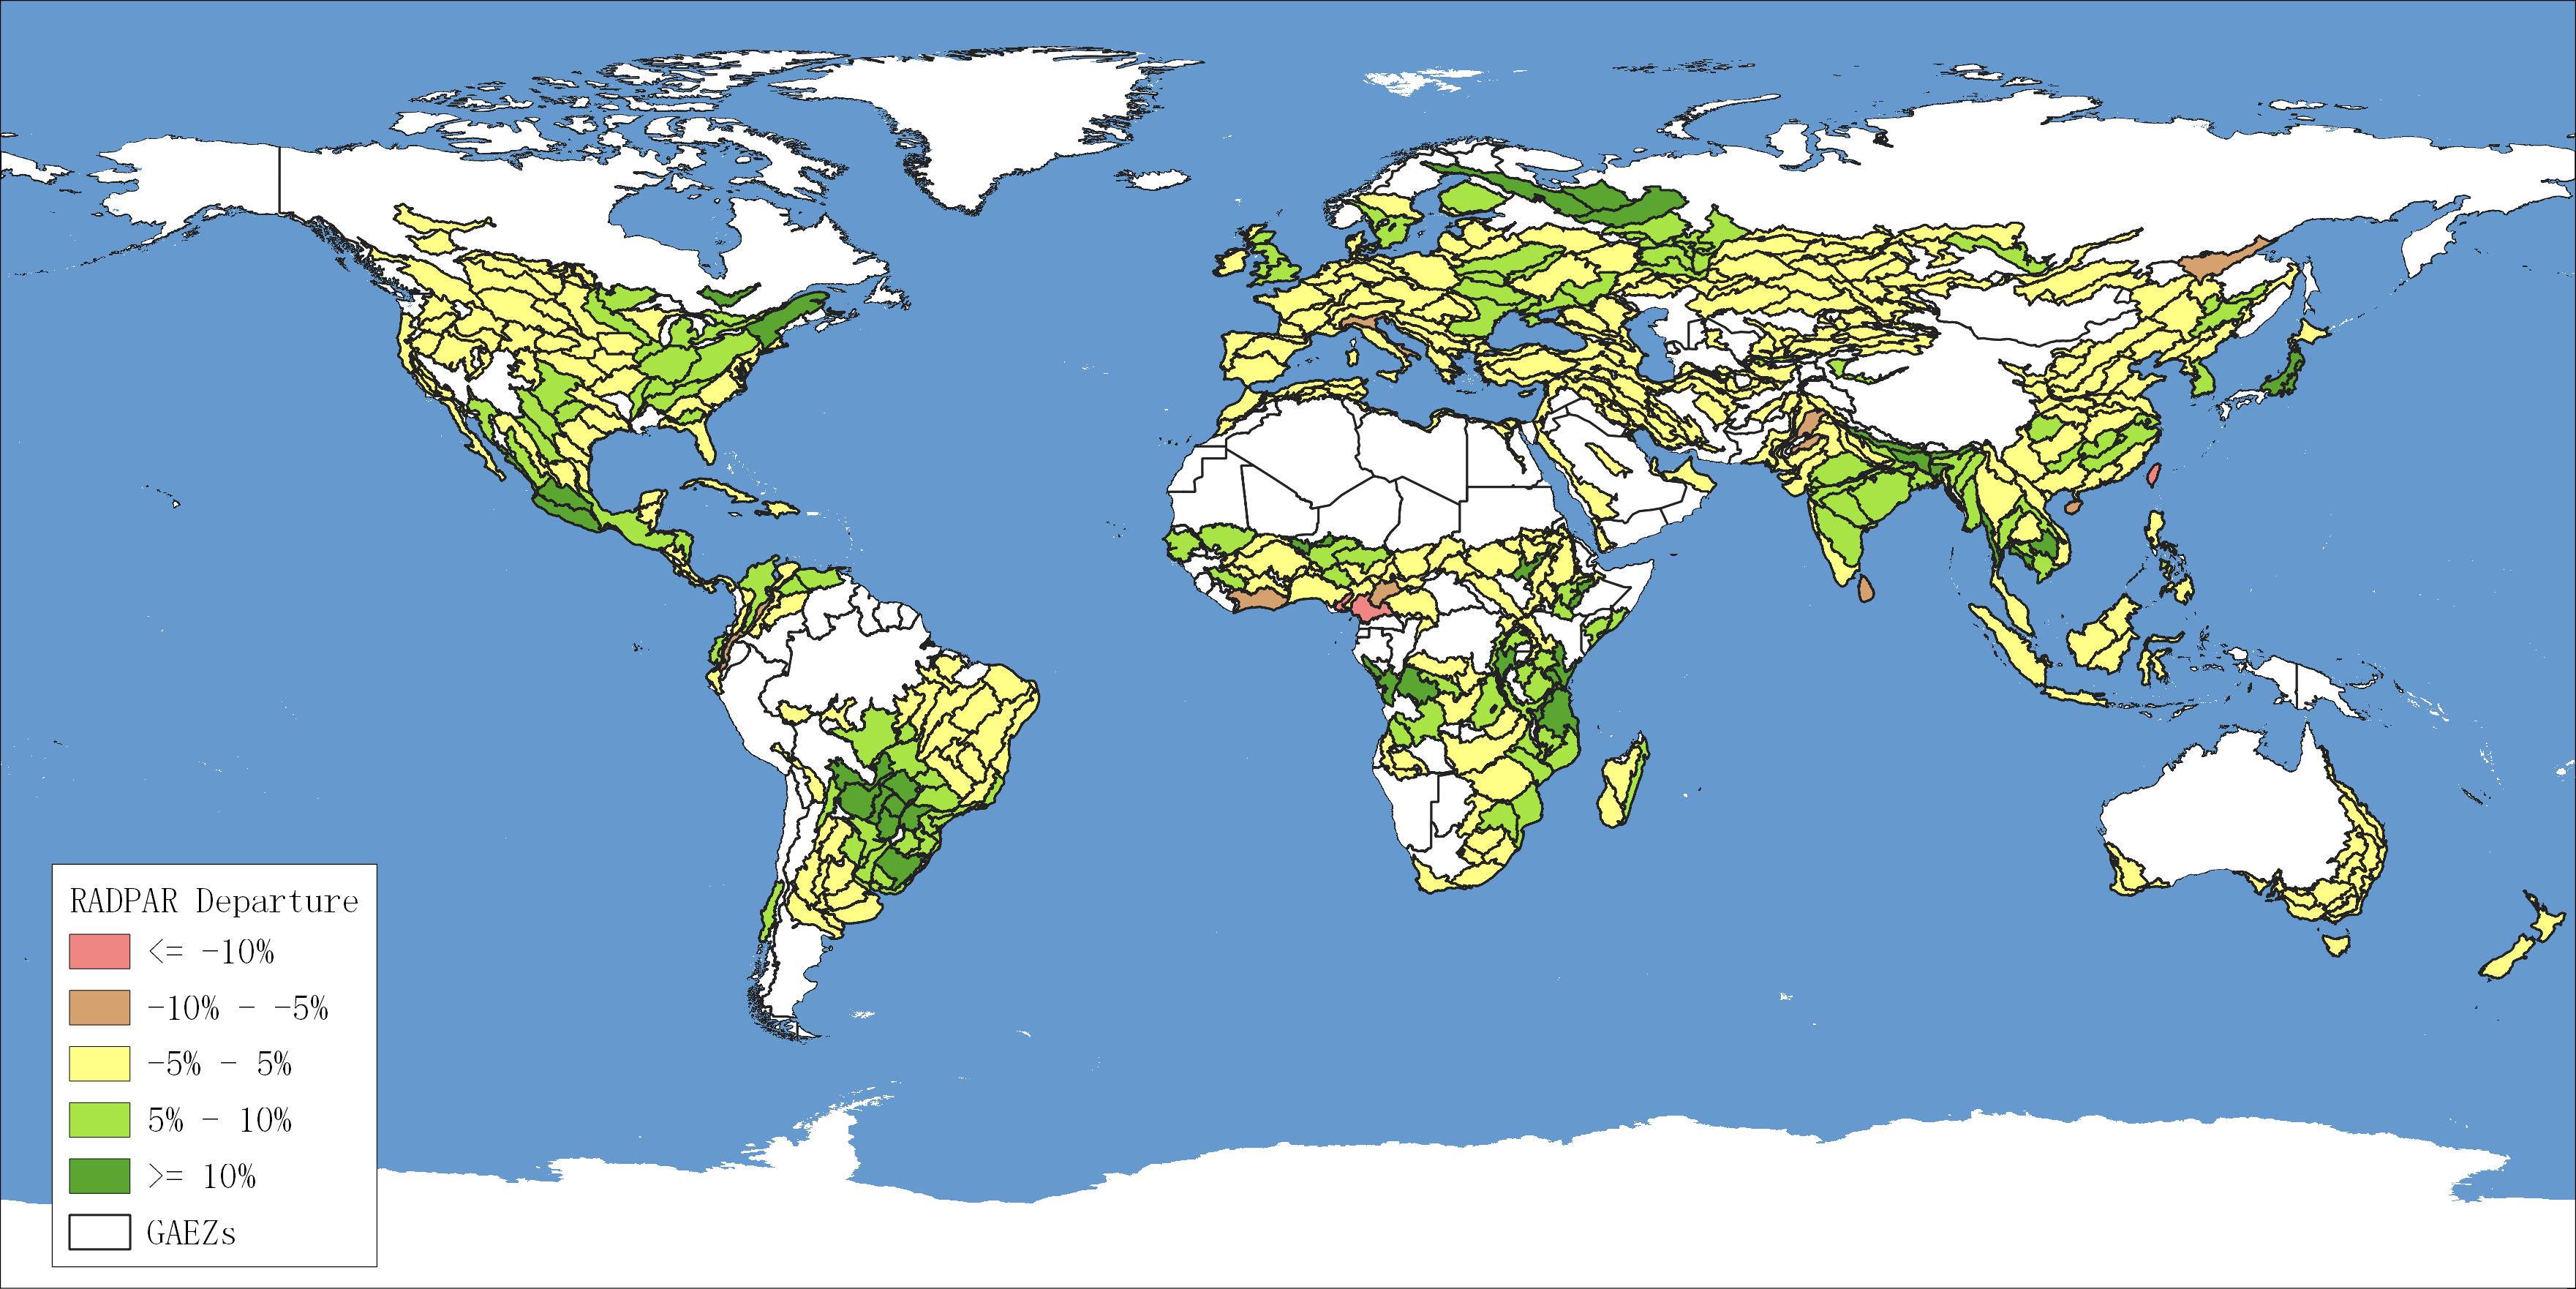
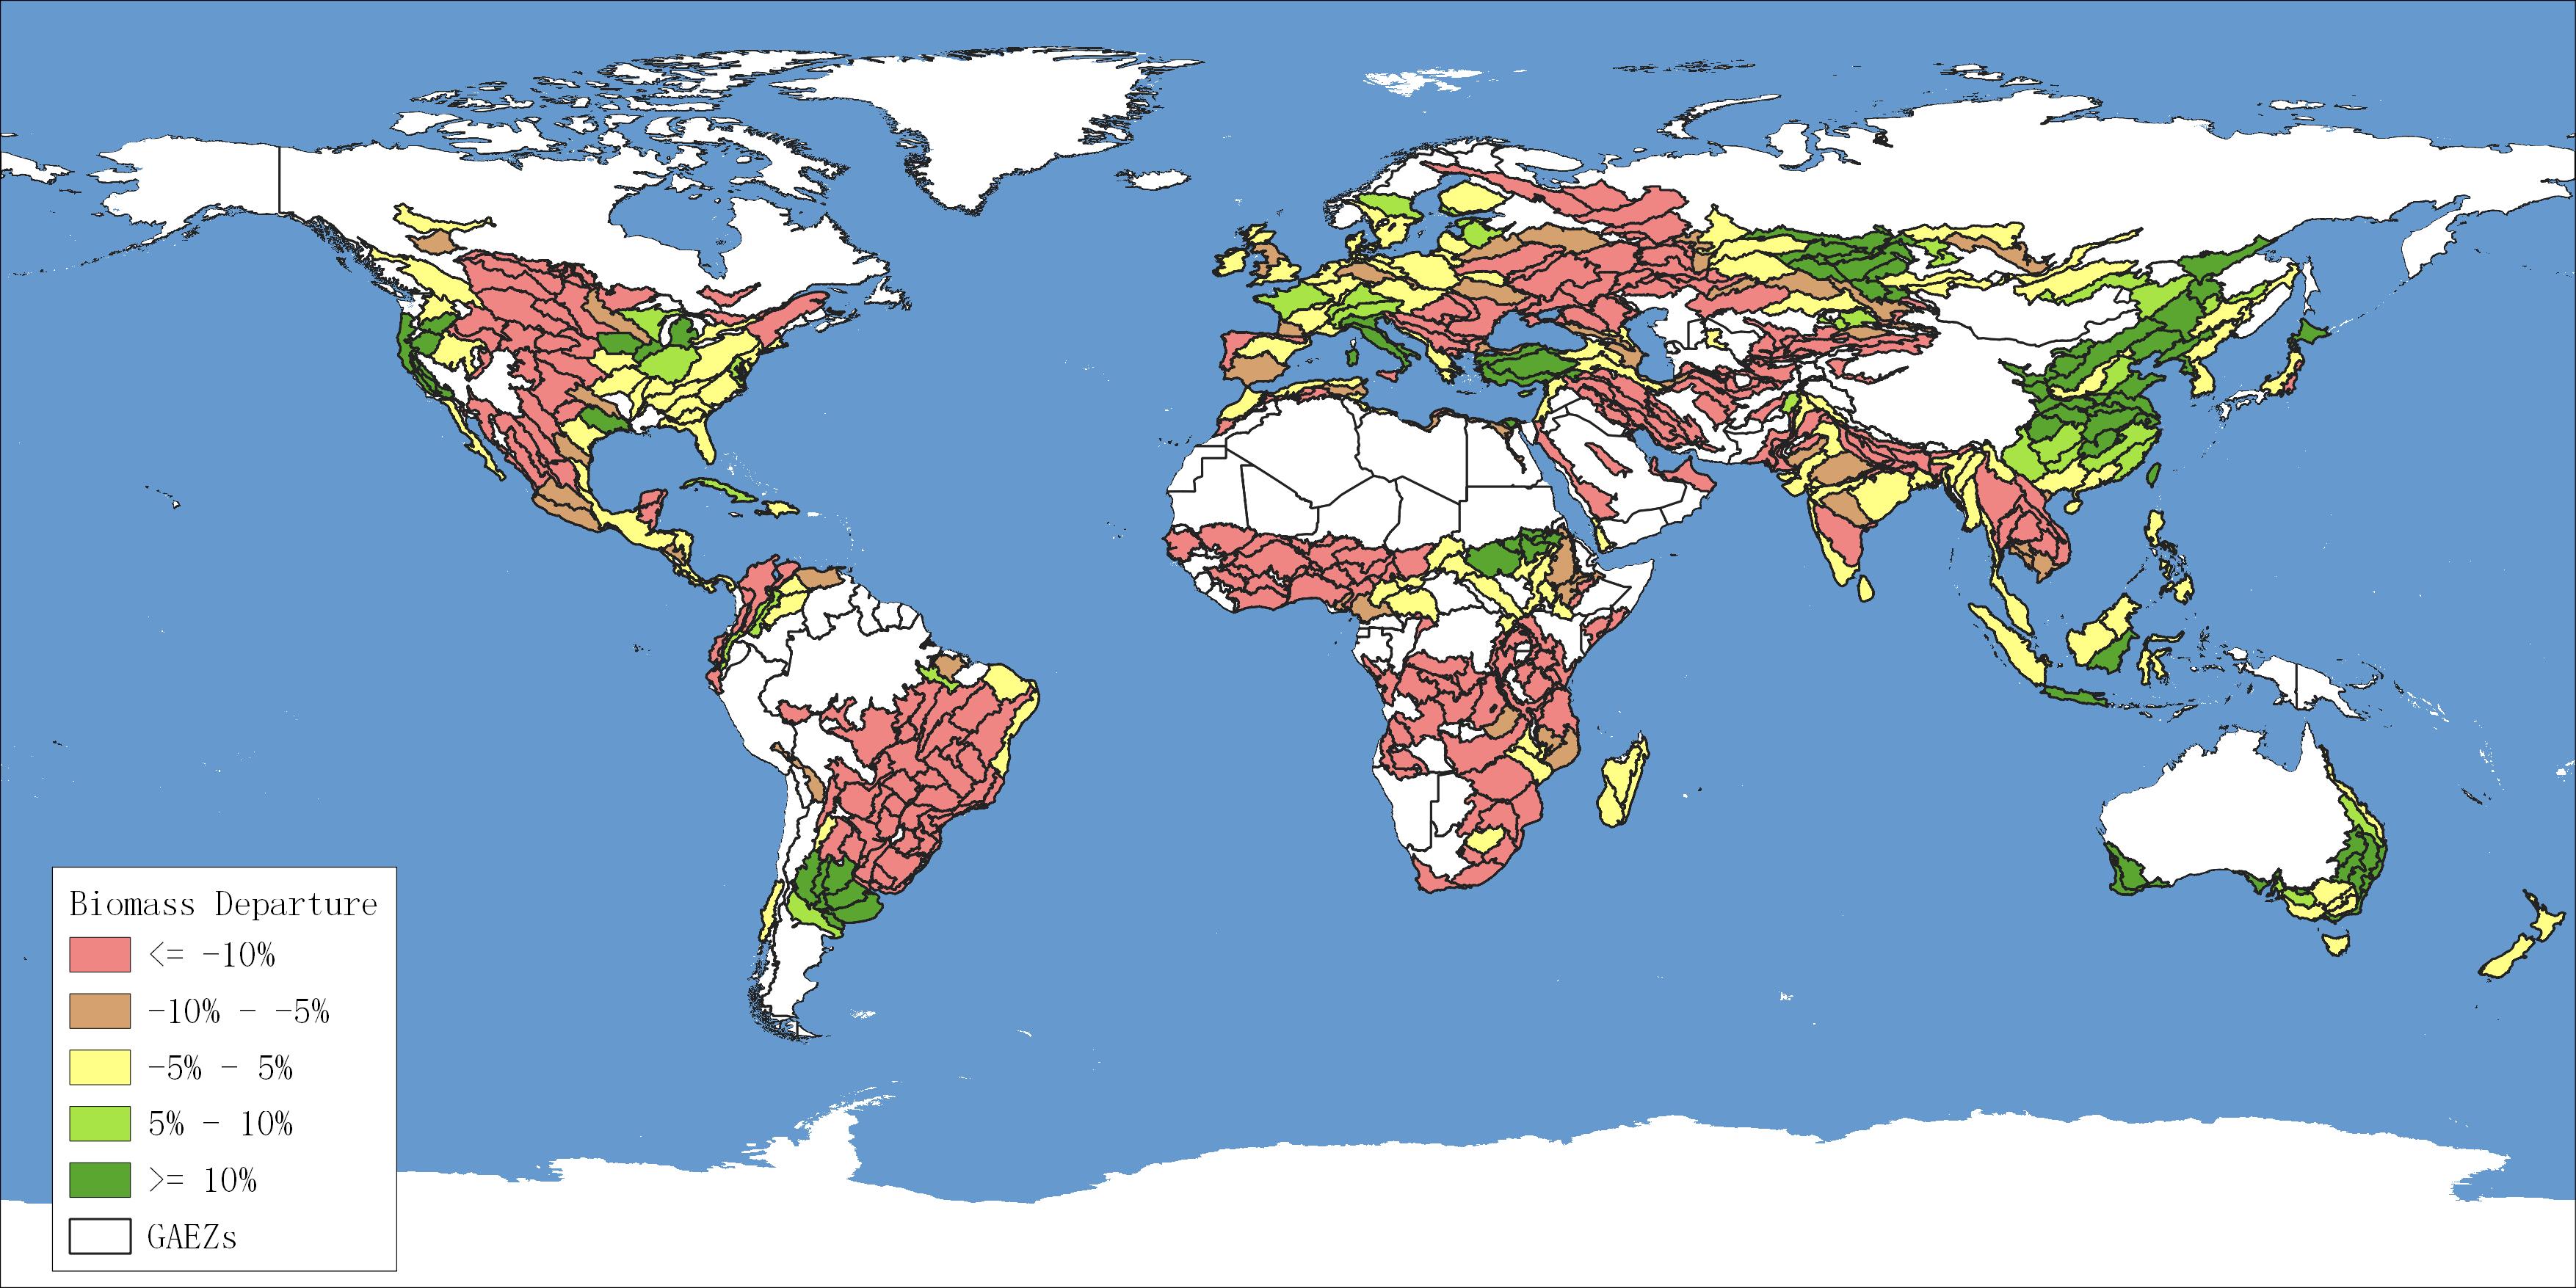
Figure 1.3 Departure Anomalies of Global Agrometeorological Indicators Compared to the 15-year Average, July–September 2025 (Cumulative Precipitation, Average Temperature, Photosynthetically Active Radiation, Potential Biomass)
North America: Drought Stress, Overall Stable
In the central United States and main producing areas of Canada, CroPI values ranged from 0.93 to 1.11, indicating normal production conditions. However, significant drought was observed on both the northern and southern edges of the Great Plains, with localized precipitation deficits of ≥30% and potential biomass declines of ≥10%. While high temperatures and strong sunlight favored crop maturity, they may shorten the grain‑filling period. Yield prospects varied considerably between regions.
South America: Strong South, Restricted North
CroPI showed pronounced spatial differences. Northern Argentina, southern Brazil, and Uruguay had CroPI values ≥1.29, supported by precipitation increases of 10–30% and ample sunlight, favoring yield increases for winter wheat and early‑planted crops. In contrast, northeastern Brazil and the eastern edge of the Amazon had CroPI values of 0.76–0.93, where drought combined with high temperatures suppressed crop growth. Overall, the "southern gains, northern losses" pattern supported the Southern Hemisphere's grain supply.
Western Europe: Stable and Positive
Most agricultural areas in Western and Central Europe had CroPI values between 0.93 and 1.11, indicating stable production conditions. RADPAR was 5–10% above normal, while precipitation deficits were mild (within –10%). Agricultural activities in regions such as northern France, northern Germany, and western Poland proceeded normally, with potential biomass anomalies close to average or slightly positive (+≤5%), demonstrating favorable growing environments. Overall, Western Europe remained in a climate‑balanced state, with stable prospects for autumn grain production.
Eastern Europe: Weak South, Strong North
CroPI in Eastern Europe showed significant spatial variation. Northern areas (northern Ukraine, Belarus, and the Baltic coastal region) had CroPI values ≥1.1, with suitable water–heat conditions and potential biomass increases of 5–10%, indicating strong performance. Conversely, southern Eastern Europe and the north coast of the Black Sea experienced persistent drought and high temperatures, with precipitation deficits ≥30% and CroPI only 0.76–0.93. Grain‑filling of wheat, maize, and other crops was hindered, posing high yield reduction risks. The overall pattern was "north strong, south weak."
Africa: Persistent Drought, Local Improvement
CroPI across Africa ranged from 0.76 to 1.11, with a patchy distribution. Northern Africa, the Sahel, and the Horn of Africa suffered from insufficient rainfall (≤–30%), leading to notable declines in potential biomass. In contrast, parts of East and southern Africa saw CroPI values above 1.1, supported by increased rainfall and adequate sunlight, indicating recovering production conditions. Overall, drought remained the dominant factor across the continent.
Asia: Strong East, Pressured South
CroPI in Asian agricultural areas varied widely from 0.76 to 1.29. Northeastern and northern China, as well as Japan and South Korea, recorded CroPI >1.1, with well‑matched water–heat conditions and significant potential biomass increases. Southern China, northern India, and Pakistan had CroPI ≤0.93 due to pronounced drought. In Central and Western Asia, high temperatures worsened water deficits, limiting crop growth. The overall pattern was "strong East, weak West; strong North, weak South."
Oceania: Southeastern Highlight
In southwestern and southeastern coastal Australia, precipitation rose by 10–30%, with CroPI values >1.11, supporting strong growth of winter wheat and canola. The central–western and northern regions remained relatively dry, with modest biomass declines. Agricultural regions in New Zealand remained stable, and overall conditions were positive.
Overall, from July to September 2025, regional differences in global agrometeorological conditions led to uneven production distribution: southern South America, East Asia, and southeastern Australia were the main sources of increased production potential, while central North America, South Asia, and drought belts in Africa still faced water–heat stress. Looking ahead, if spring rainfall in the Southern Hemisphere persists and temperatures in the Northern Hemisphere remain moderate, global grain output is expected to maintain upward momentum overall.
1.1.3 Global Production of Major Grain and Oil Crops
From July to September 2025, autumn crops in the Northern Hemisphere exhibited generally favorable growth, while summer crops in the Southern Hemisphere entered their peak growing stages, with overall good conditions for wheat production. Based on multi‑source satellite remote‑sensing data collected up to October 15, 2025, CropWatch monitoring indicates that the total global production of major grain and oil crops is forecasted at 3,249.51 million tons, representing a year‑on‑year increase of 49.17 million tons , or about 1.5% (Appendix A.1). Specifically:
Global wheat production is estimated at 803.88 million tons , a decrease of 1.96 million tons year on year (–0.2%). Thanks to higher output in the Southern Hemisphere—namely in Australia, Argentina, Brazil, and South Africa—the decline narrowed compared with the August estimate, improving by 0.3 percentage points.
Global maize production is projected to reach 1,196.87 million tons , an increase of 20.29 million tons (+1.7% year on year). Favorable agrometeorological conditions during the late growing stage in the United States boosted yields, making it the primary contributor to global maize expansion.
Global rice production is expected to total 811.28 million tons , an increase of 17.40 million tons (+2.2% year on year).
Global soybean production is forecasted at 437.48 million tons , a year‑on‑year increase of 13.45 million tons (+3.2%), slightly higher than the August estimate.
1.1.4 Evaluation of Global Extreme Weather Event Impacts
The impact of extreme weather events on the production of major grain and oilseed crops in 2025 was weaker than in the previous year.
(1)Widespread drought in croplands, and the situation remains severe
Global cropland water stress risk during July to September showed a trend of "initial increase followed by a decrease", with the overall level equivalent to a once-in-two-year mild drought scenario.The area affected by drought with a return period of ≥5 years accounted for 18.35% in late July, slightly increased to 18.87% in late August, and then decreased to 16.3% by late September. In contrast, the proportion of area experiencing drought with a return period of 2–5 years showed a steady upward trend, rising from 27.97% in late July to 30.32% in late August, and further increasing to 32.35% by late September.Regions including the Asian continent, central Africa, eastern North America, and Brazil in South America faced relatively high crop water stress risk. Notably, crops in North China underwent a typical "abrupt shift from drought to waterlogging" process, where periodic drought rapidly transitioned to waterlogging in the later growth stage.
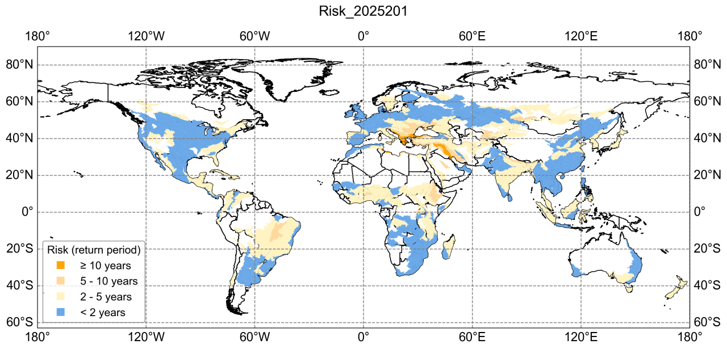
(a) July, 20th- July, 27th,2025
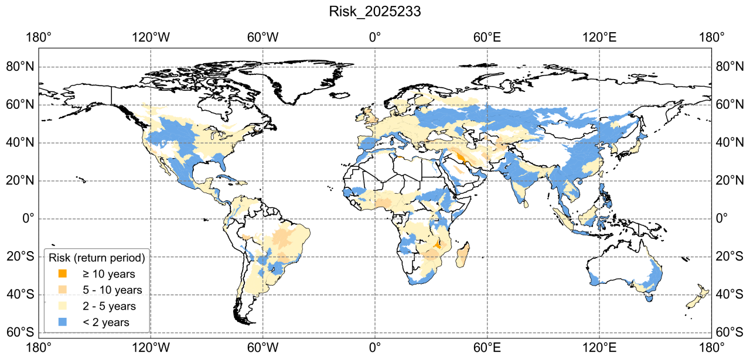
(b) August, 21th- August, 28th,2025
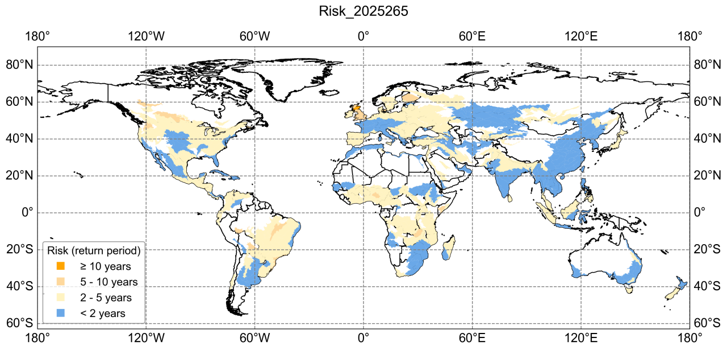
(c) Sep., 22th- Sep., 29th,2025
Figure 1.4 Risk of Crop Water Stress Index in croplands by Global Agro-Ecological Zone during July-September, 2025
CropWatch precipitation data for September indicates that regions including the northeastern United States, southern Brazil, northeastern China, and West Africa received below-average precipitation(Figure 1.5). In contrast, croplands in eastern China experienced significantly above-average rainfall. Specifically, areas such as most of Henan, western Shandong, northeastern Hubei, and the region from eastern Sichuan to Chongqing recorded precipitation exceeding 100 mm more than the multi-year average. Parts of India and Southeast Asia also saw above-average rainfall. CropWatch soil moisture monitoring reveals a significant declining trend in soil moisture levels from August to September across most of the United States, Europe, Brazil, and southern Africa(Figure 1.6). By September, nearly one-third (31.3%) of global croplands had soil moisture levels 0-0.02 m³/m³ lower than the multi-year average. Soils were drier than average across most of the United States, Europe, Brazil, and southern Africa, while conditions were wetter than average in most of North China and western India.
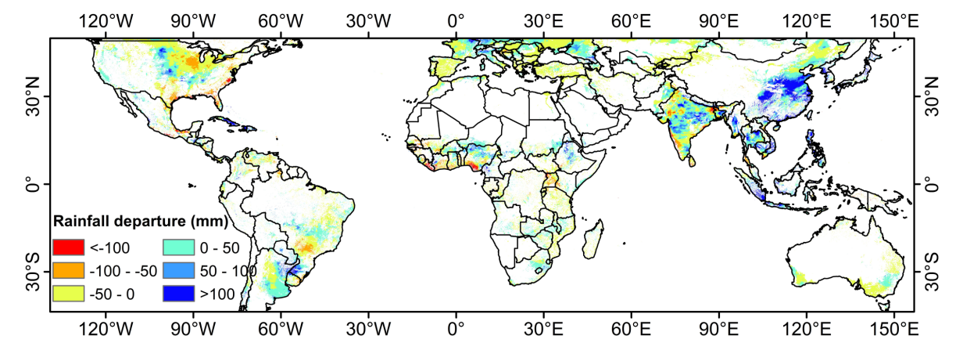
Figure 1.5 Precipitation Anomaly in September 2025
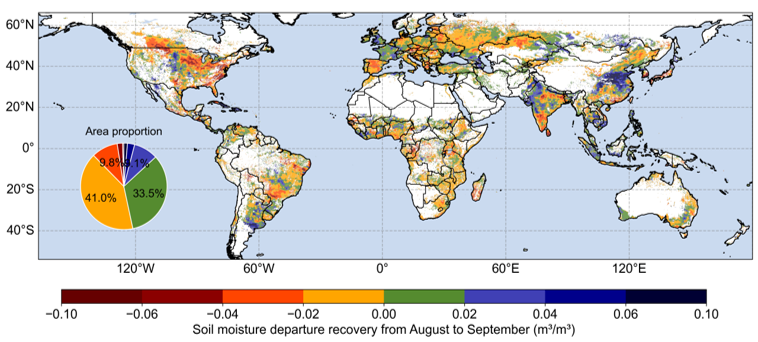
(a) Root Zone Soil Moisture Anomaly Variation (August-September 2025)
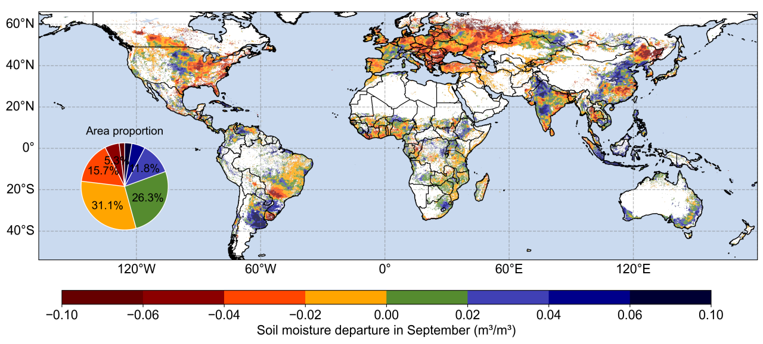
(b) Root Zone Soil Moisture Anomaly in September 2025
Figure 1.5 Root Zone Soil Moisture Anomaly Variation
(2) Mid- and high-latitude regions are seeing colder temperatures and an earlier start to winter
According to an early warning issued by the U.S. National Oceanic and Atmospheric Administration (NOAA), a weak La Niña event is expected to develop during the autumn and winter of this year, which is projected to have a temporary cooling effect on global temperatures. Remote sensing monitoring of cropland surface temperature by CropWatch (Figure 1.6) indicates that since mid-September, temperatures over croplands in mid- to high-latitude regions—including the northeastern United States, southern Canada, eastern Europe, and northeastern China—have been lower than the multi-year average.The start date of winter is defined as the first day when the 5-day running mean temperature stabilizes below 10°C. In 2025, the winter onset date for most high-latitude regions showed a negative anomaly, meaning it arrived earlier compared to the 2010-2024 average. Notably, areas north of 60°N experienced a winter onset nearly one month earlier than usual (Figure 1.7).Monitoring highlighted in the previous bulletin indicated that in July, regions including central North America, areas from Eastern Europe to West Asia, and western India and Pakistan experienced persistent heatwaves. However, since September, temperatures in some of these aforementioned regions have shifted to below the multi-year average for the same period, reflecting significant anomalous fluctuations during the seasonal transition in mid- to high-latitude areas.
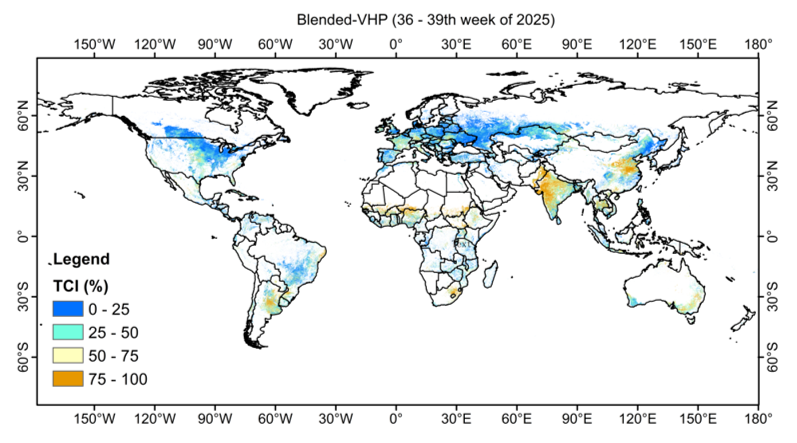
Figure 1.6 Temperature Condition Index (TCI) Derived from Remote Sensing for September 2025 (Weeks 36-39)
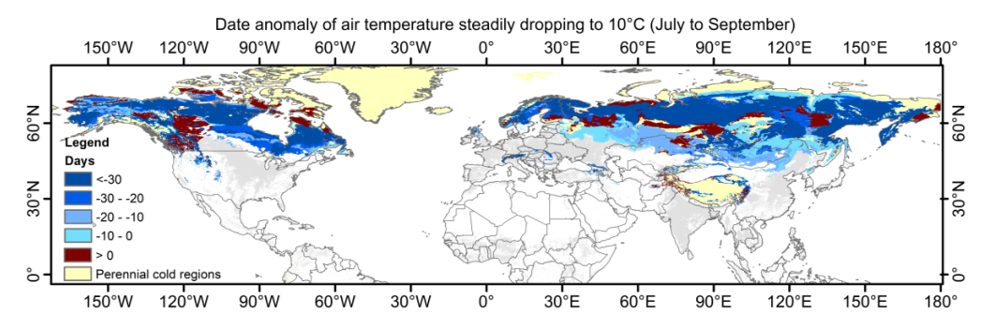
Figure 1.7 Map of Winter Onset Dates across the Northern Hemisphere from ERA5-Land Pentad Average Temperatures, July-September, 2025