
 English
 中文

Bulletin
CropWatch bulletinMenu
Authors: qinxl | Edit: zenghongwei
From July to September 2025, overall crop production conditions in the equatorial and adjacent monsoon regions were stable to slightly positive. The Crop Production Index (CroPI) stood at 1.09, an increase of 0.06 from the previous year, reaching the second‑highest level in the past five years. This indicates that regional agricultural systems maintained strong production stability under warmer and drier‑than‑normal climatic conditions. Most major rice‑producing countries in the equatorial belt experienced below‑normal precipitation and above‑normal temperatures, with about 70% of agricultural areas recording rainfall deficits of 10–30%. Enhanced evapotranspiration led to pronounced spatial differentiation in Potential Biomass (BIOMSS). Nonetheless, with sufficient year‑round solar radiation, elevated Photosynthetically Active Radiation (PAR) (+5–10% above average), improved local irrigation, and wider adoption of advanced cultivation techniques, rice growth conditions were effectively ensured in several countries. Overall, the pattern was characterized by "strong radiation and heat, low precipitation, and resilient production." At the national level, notable divergence was observed: Vietnam recorded simultaneous increases in both area and yield, driving substantial production growth; Thailand and Cambodia, however, faced yield declines and production pressure due to persistent heat and rainfall shortages. In general, rice production in the equatorial and tropical zones corresponded with regional CroPI trends—a stable‑to‑slightly‑positive pattern, though spatial discrepancies in climatic stress require close monitoring (Table 1.3).
Thailand: In 2025, Thailand's rainy‑season rice production declined overall. The planted area was 5,520 thousand hectares , down 0.6% year on year; average yield decreased 4.9% from 4,365 kg/ha to 4,150 kg/ha, resulting in total output of 22.91 million tons , a 5.5% decline from 24.23 million tons in 2024. Cumulative precipitation during the monitoring period totaled only 430 mm—56% below the 15‑year average—while temperatures were markedly higher. Water shortages in irrigated areas across the central, northeastern, and northern basins shortened the heading phase and reduced grain‑set rates. The combination of high temperature and drought was the main cause of the yield decline.
Vietnam: From July to September 2025, Vietnam's rice cultivation area reached 1,625 thousand hectares , up 2.7% year on year. Average yield rose 6.8% to 4,267 kg/ha, raising total production to 6.93 million tons—a 9.7% increase from 2024. Meteorological conditions included temperatures +0.7 °C above the long‑term average and PAR up 3%, effectively extending photosynthetic duration and facilitating dry‑matter accumulation. Although precipitation was 27% below normal, irrigation coverage in major producing regions remained adequate, and the Palmer Drought Severity Index (PDSI) indicated overall slightly wet conditions. In addition, the expansion of low‑carbon rice cultivation technology achieved simultaneous water saving and yield improvement, contributing to higher per‑unit yield.
Cambodia: In 2025, Cambodia's rainy‑season rice area increased 1.7% year on year to 3,276 thousand hectares, but average yield declined 2.6% to 3,086 kg/ha, bringing total production to 10.11 million tons—a 0.8% decrease from the previous year. Cumulative rainfall reached 750 mm, 38.4% below the 15‑year average, while temperature rose 1.0 °C, intensifying moisture shortage and heat stress, which caused BIOMSS to fall 10.3%. Despite PAR rising 10.5% and the Maximum Vegetation Condition Index (VCIx) remaining at 0.91, insufficient water availability imposed stress on rainfed rice growth. Efficient water management and drought‑tolerant varieties are required in certain basins to mitigate adverse impacts.
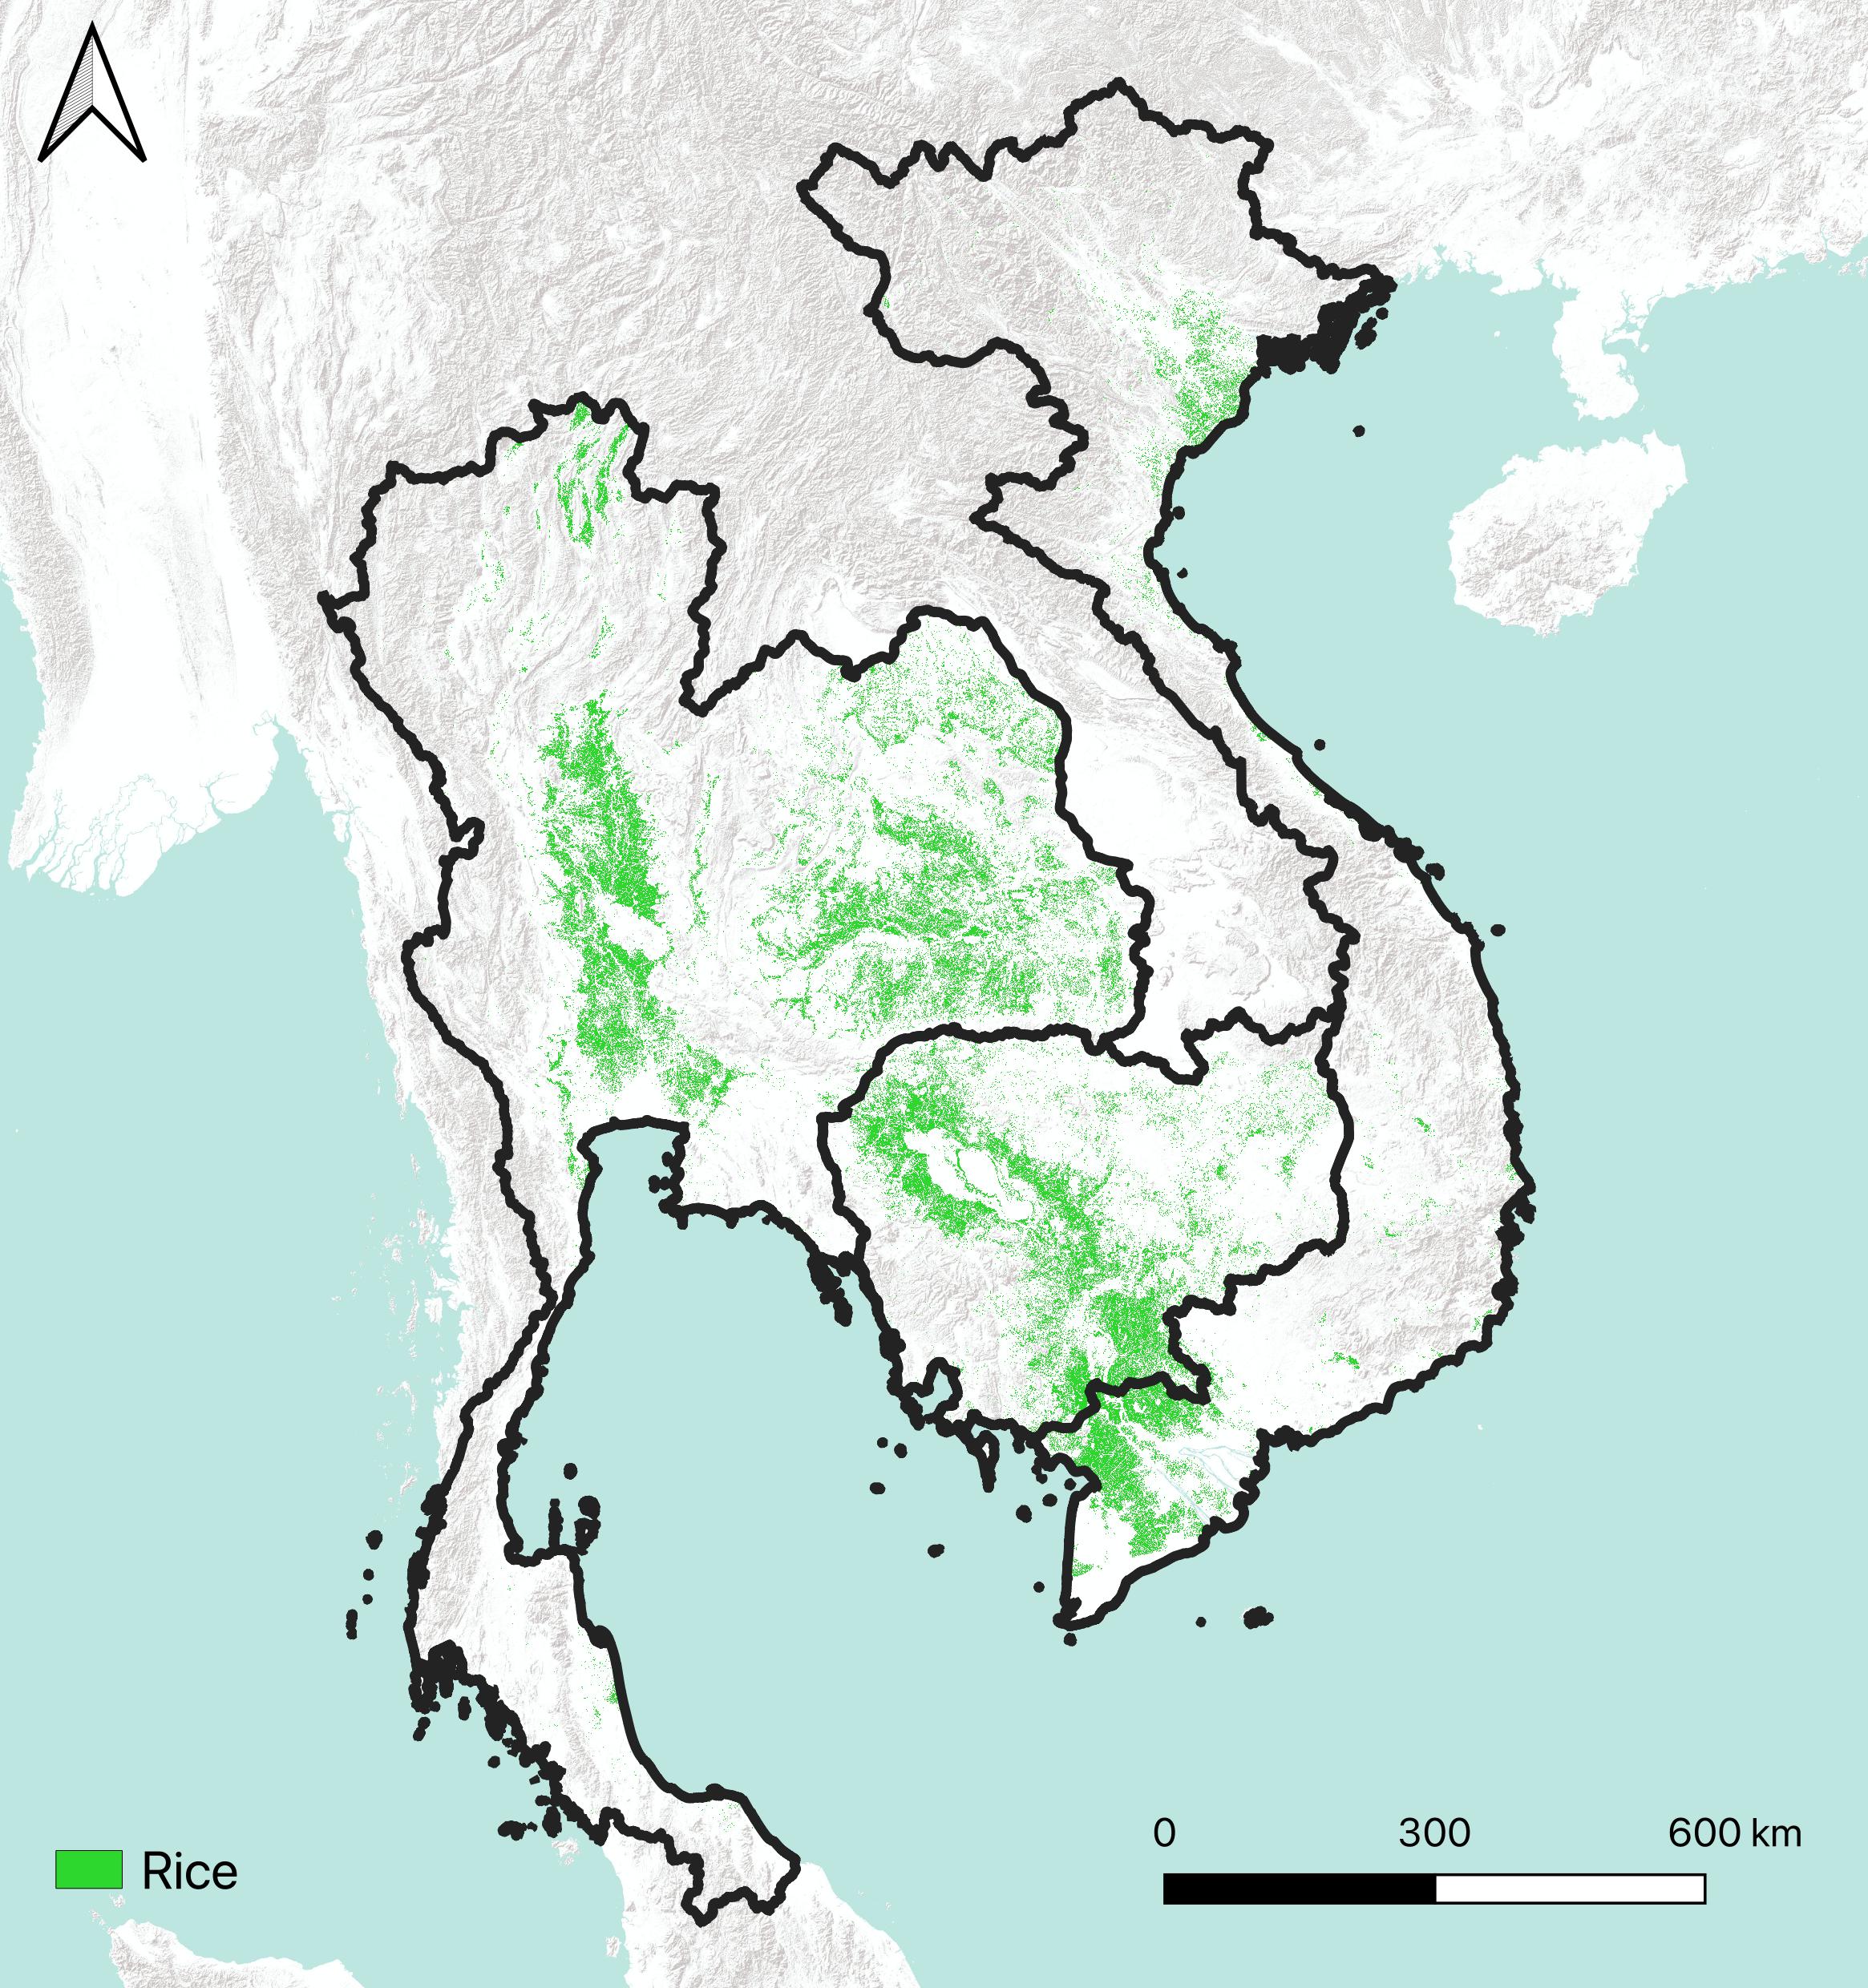
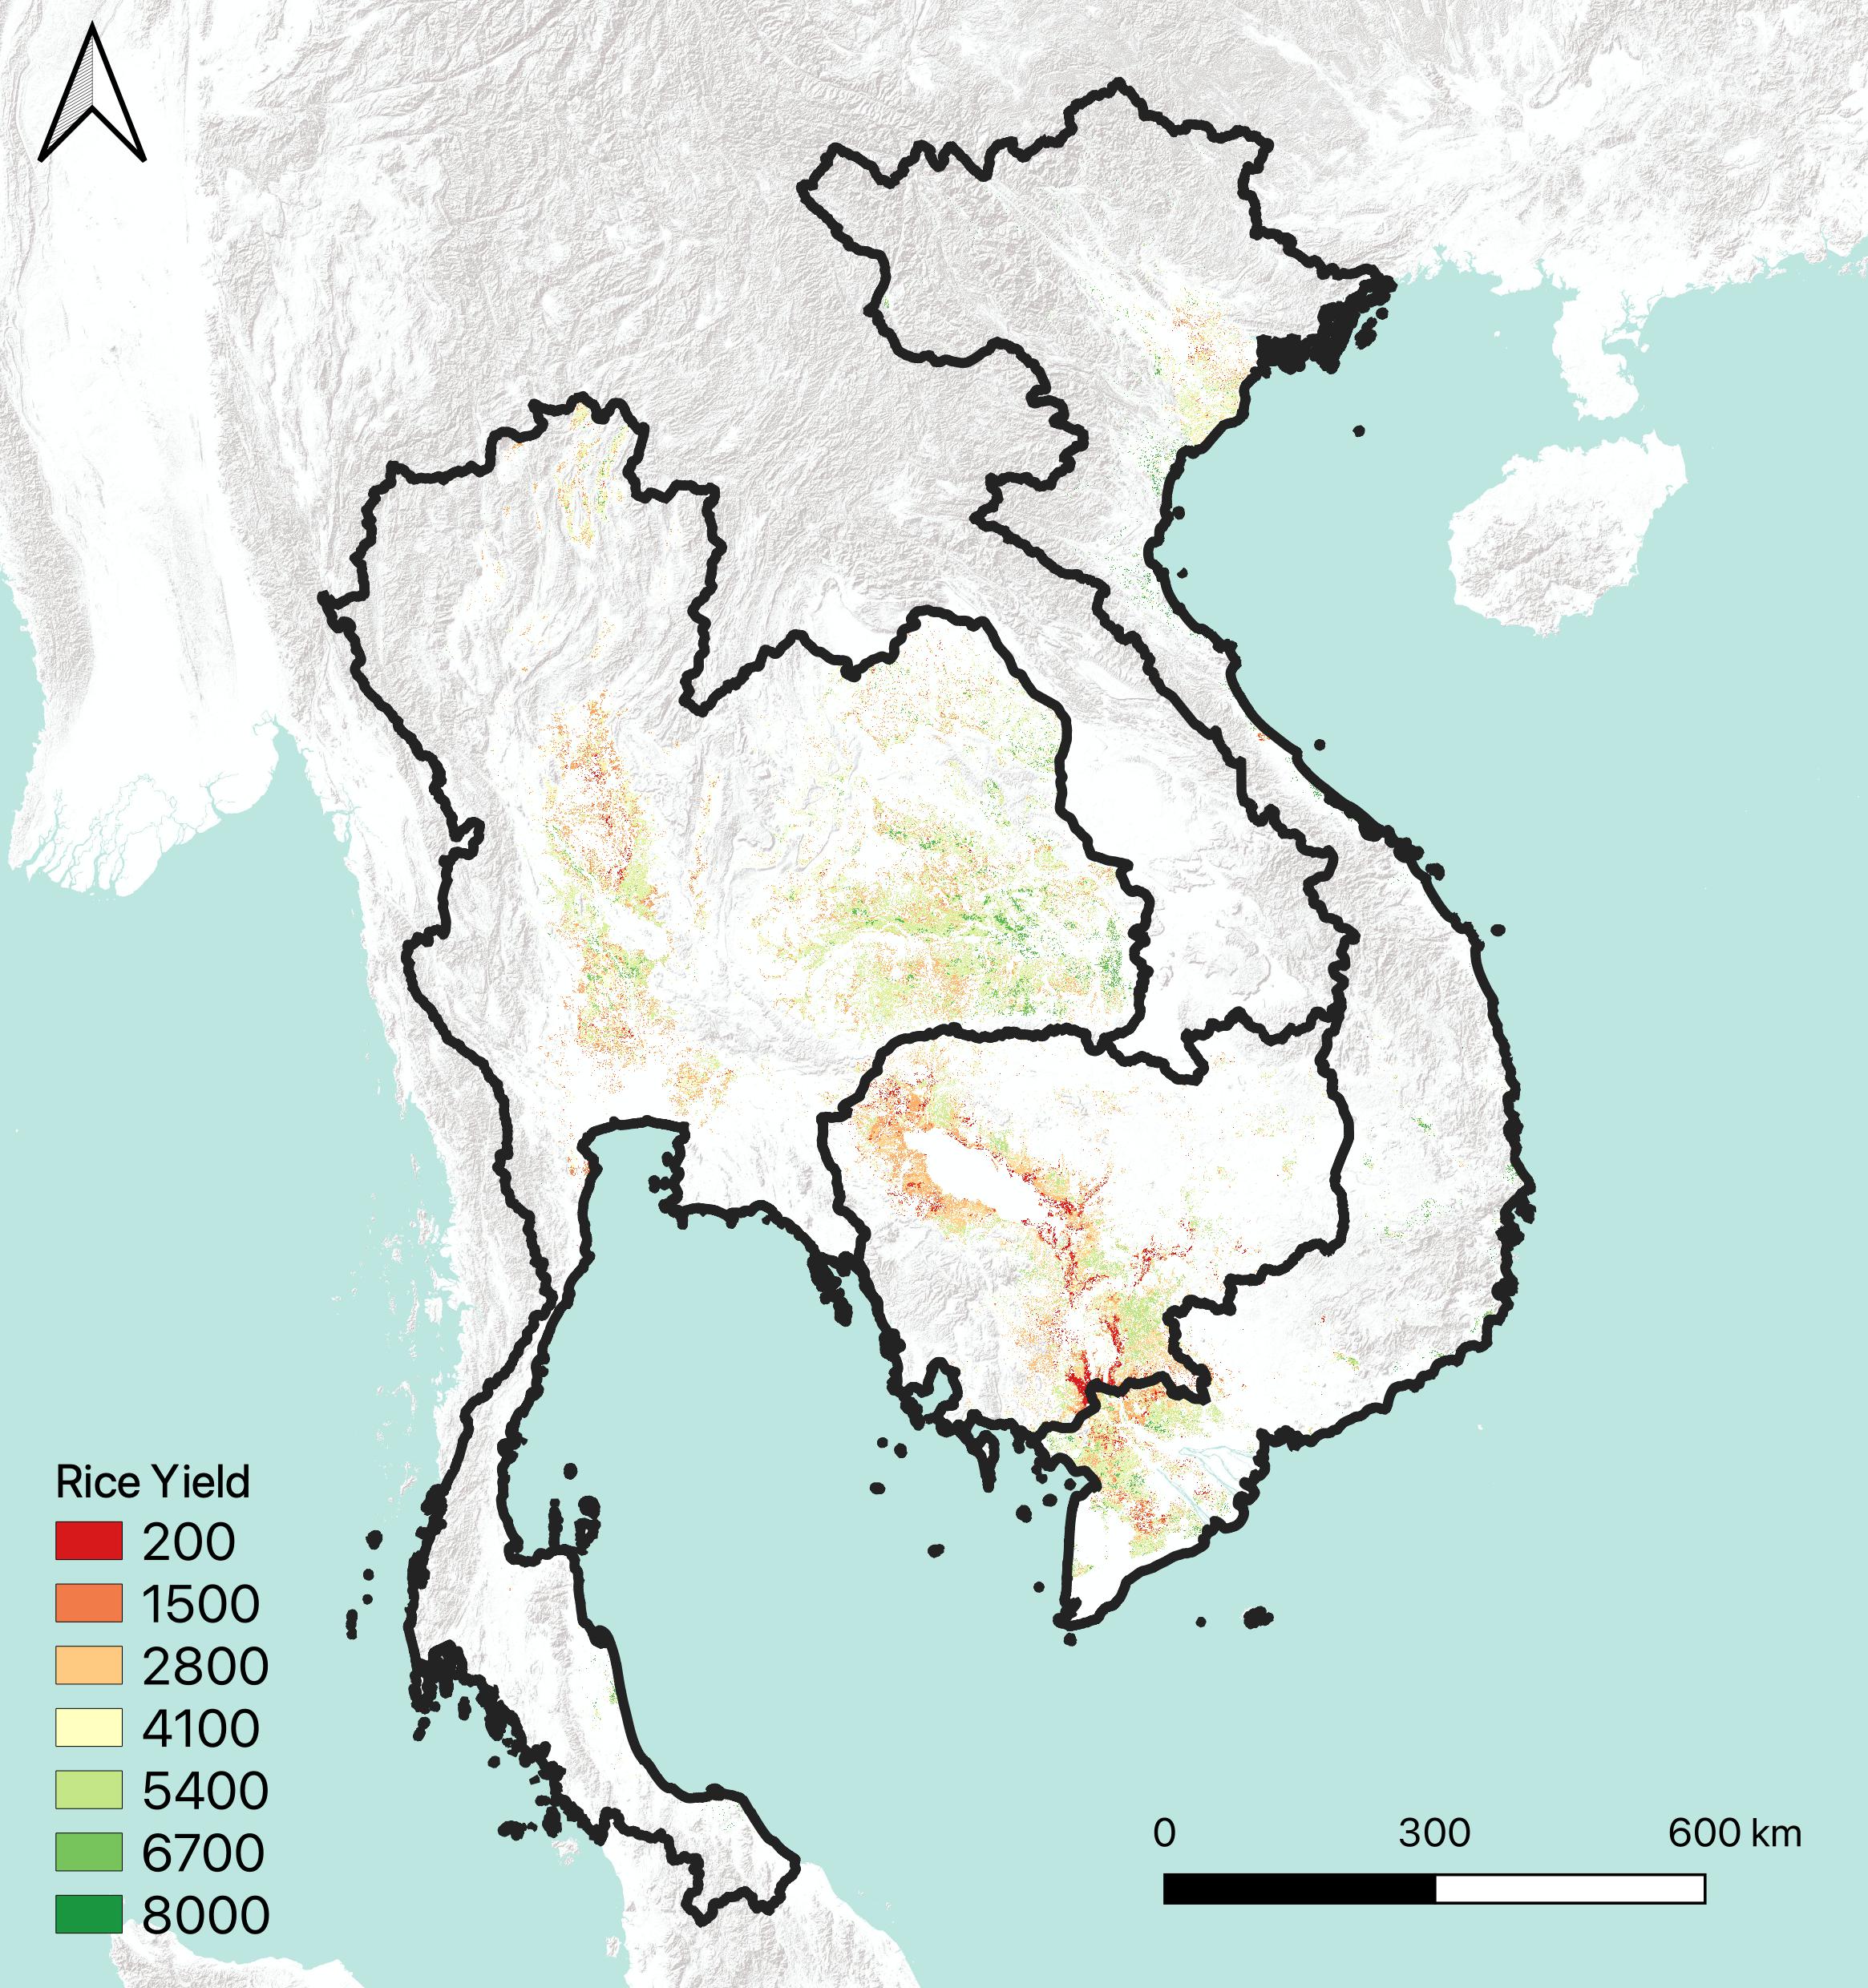
Figure 1.11 Distribution of Rice‑Planted Area and Yield in Major Equatorial Countries, July–September 2025
Table 1.3 Rice Production Conditions and Year‑on‑Year Changes in Main Equatorial Countries, July–September 2025
Country | Area(kha) | Yield(kg/ha) | Production(10000t) | ||||||||
2024 | 2025 | Change(%) | 2024 | 2025 | Change(%) | 2024 | 2025 | Change(%) | |||
Thailand | 5,551 | 5,520 | -0.6 | 4,365 | 4,150 | -4.9 | 2423 | 2291 | -5.5 | ||
Vietnam | 1,581 | 1,625 | 2.7 | 3,995 | 4,267 | 6.8 | 632 | 693 | 9.7 | ||
Cambodia | 3,221 | 3,276 | 1.7 | 3,167 | 3,086 | -2.6 | 1020 | 1011 | -0.8 | ||