
 English
 中文

Bulletin
CropWatch bulletinMenu
Authors: Miao,tianfuyou,limengxiao,MH18174088459,lijunbin | Edit: zenghongwei
2.1.1 China
Using multi-source remote sensing data from Fengyun meteorological satellites, ESA Sentinel-1/2, and US Landsat-8/9, combined with agri-climatic information and crop yield monitoring models, CropWatch conducted a comprehensive verification of the yield and output of major grain and oil crops in China.
Remote sensing monitoring indicates that China’s total grain output in 2025 is estimated at 681.3 million tons, down 4.18 million tons year on year (–0.6%). Summer grain production is projected at 145.16 million tons, up 0.19 million tons (+0.1%), with early rice reaching 28.32 million tons, up 0.97 million tons (+3.5%). Summer crops output is estimated at 507.82 million tons, down 5.29 million tons (–1.0%), mainly due to prolonged cloudy and rainy weather during harvest, which lowered maize yields. Key rice-growing areas also experienced repeated heavy rainfall during critical growth stages, causing slight declines in mid-season and late rice production.
Grain production in 2025 exhibits clear regional differentiation. Overall declines were concentrated in North China, Shanxi, and Shaanxi, while gains were mainly observed in parts of Northeast and Northwest China. The Northeast acted as a stabilizing "grain anchor", consolidating its position as China's largest granary. Production increases in Heilongjiang and Jilin of 6.4% and 5.5%, respectively, provided crucial support at the national level, largely due to favorable light, temperature, and water conditions during the growing season, with minimal large-scale natural disasters.
In the Northwest, Ningxia and Xinjiang performed particularly well, with output surging 20.0% and 10%, respectively. Strong gains in these provinces benefited from optimized irrigation, the promotion of high-quality varieties, and favorable agri-climatic conditions.
In North China, declines were most pronounced. Hebei's summer crops output fell 12.1% year on year, and annual total output fell by 6.0%, with extended cloudy and rainy conditions during harvest affecting maize yields. Shandong, Shanxi, and Gansu also experienced reductions, with Gansu down 6.9% (–9.5% in summer crops production), reflecting the impact of extreme weather and drought stress.
Southwest China showed a pattern of "more increases than decreases", with gains in Chongqing, Sichuan, and Guizhou, while Hunan and Zhejiang maintained positive growth.
Overall, although China's grain output in 2025 slightly decreased, the resilience of core production regions—particularly the substantial gains in parts of Northeast and Northwest China—provided essential support for national food security. Meanwhile, concentrated regional losses in North China, the Huang-Huai region, and parts of southern provinces, mainly due to extreme weather events, highlight the importance of strengthening agricultural resilience and adapting production to climate change.
Table 2.1 Year-on-Year Changes of Summer crops and annual total output in Major Grain-Producing Provinces of China, 2025
Province/ Autonomous Region | Summer crops (10,000 tons) | Annual total crops (10,000 tons) | ||
2025 | Change(%) | 2025 | Change(%) | |
Anhui | 2017 | -4.7 | 3678 | -2.9 |
Chongqing | 816 | 5.4 | 816 | 5.4 |
Fujian | 518 | -4.8 | 605 | -4.4 |
Gansu | 629 | -9.5 | 962 | -6.9 |
Guangdong | 727 | -3.7 | 1189 | 1.3 |
Guangxi | 886 | -4.0 | 1398 | 0.2 |
Guizhou | 1270 | 3.1 | 1270 | 3.1 |
Hebei | 1839 | -12.1 | 3227 | -6.0 |
Heilongjiang | 8467 | 6.4 | 8467 | 6.4 |
Henan | 2198 | -1.8 | 5565 | 0.3 |
Hubei | 2511 | -2.9 | 3173 | -2.4 |
Hunan | 1945 | 4.4 | 2818 | 2.8 |
Inner Mongolia | 4510 | 3.2 | 4510 | 3.2 |
Jiangsu | 1939 | -4.3 | 3326 | -1.7 |
Jiangxi | 1006 | 1.1 | 1636 | 4.7 |
Jilin | 4593 | 5.5 | 4593 | 5.5 |
Liaoning | 2417 | 0.5 | 2417 | 0.5 |
Ningxia | 349 | 20.0 | 349 | 20.0 |
Shaanxi | 730 | -4.1 | 1130 | -2.7 |
Shandong | 1940 | -6.0 | 4700 | -0.9 |
Shanxi | 952 | -3.6 | 1186 | -2.6 |
Sichuan | 2765 | 4.0 | 3319 | 3.0 |
Xinjiang | 1219 | 10.5 | 1763 | 10.0 |
Yunnan | 1437 | -5.5 | 1437 | -5.5 |
Zhejiang | 669 | 2.2 | 728 | 2.4 |
National Total | 50782 | -1.0 | 68130 | -0.6 |
(1)Maize
In 2025, maize production in China exhibited an overall pattern of “slightly declining nationwide with pronounced regional differentiation” (Fig. 2.1). The Huang-Huai-Hai major production region experienced concentrated reductions due to continuous cloudy and rainy weather during harvest, while the Northeast and Northwest regions achieved stable increases under favorable conditions. The resilience of core production areas effectively offset part of the regional production losses, maintaining overall stability. Nationwide, maize-planted area reached 41.139 million hectares, down 0.4% year on year, with an average yield of 6,466 kg/ha, a decrease of 0.2%, resulting in an estimated total production of 266.02 million tons, slightly below 2024 (–1.73 million tons, –0.6% YoY) (Table 2.2).
Summer maize production in the Huang-Huai-Hai region was severely affected by multiple natural hazards, forming the core area of decline. During the harvest and subsequent planting period, North China experienced the longest continuous rainy period in decades, with precipitation in many areas breaking historical records. Provinces such as Henan, Shandong, Shaanxi, Shanxi, Hebei, Anhui, Jiangsu, and Hubei experienced high rainfall coupled with heat stress during flowering, leading to reduced kernel set and insufficient grain filling. Consequently, these provinces collectively lost 4.85 million tons, representing the main factor behind the national reduction. Among them, Hebei saw the largest decline (–12.3%), followed by Shandong (–6.4%), Shanxi (–3.6%), Shaanxi (–3.1%), Henan (–2.4%), Jiangsu (–3.8%), Hubei (–5.0%), and Anhui (–1.6%). Although infrastructure such as high-standard farmland mitigated flood impacts, extreme weather during critical growth periods could not be fully avoided.
In contrast, the Northeast and Northwest regions acted as stabilizing “anchors” for maize production. Favorable summer and autumn conditions, with well-matched water and heat resources, supported robust growth. In the Northeast, Heilongjiang expanded both area and yield, achieving a 7.8% increase (+3.81 million tons), while Jilin increased planted area by 5.6%, boosting output by 6.3% (+2.28 million tons). Eastern Inner Mongolia saw simultaneous growth in area and yield, with a 3.0% rise (+1.01 million tons), whereas Liaoning experienced a slight drop in planting area, resulting in a 1.1% decrease. In the Northwest, both Ningxia and Xinjiang achieved increases in area and yield, with output rising 14.9% and 12.7% year on year, respectively, providing important supplementary contributions to national production.
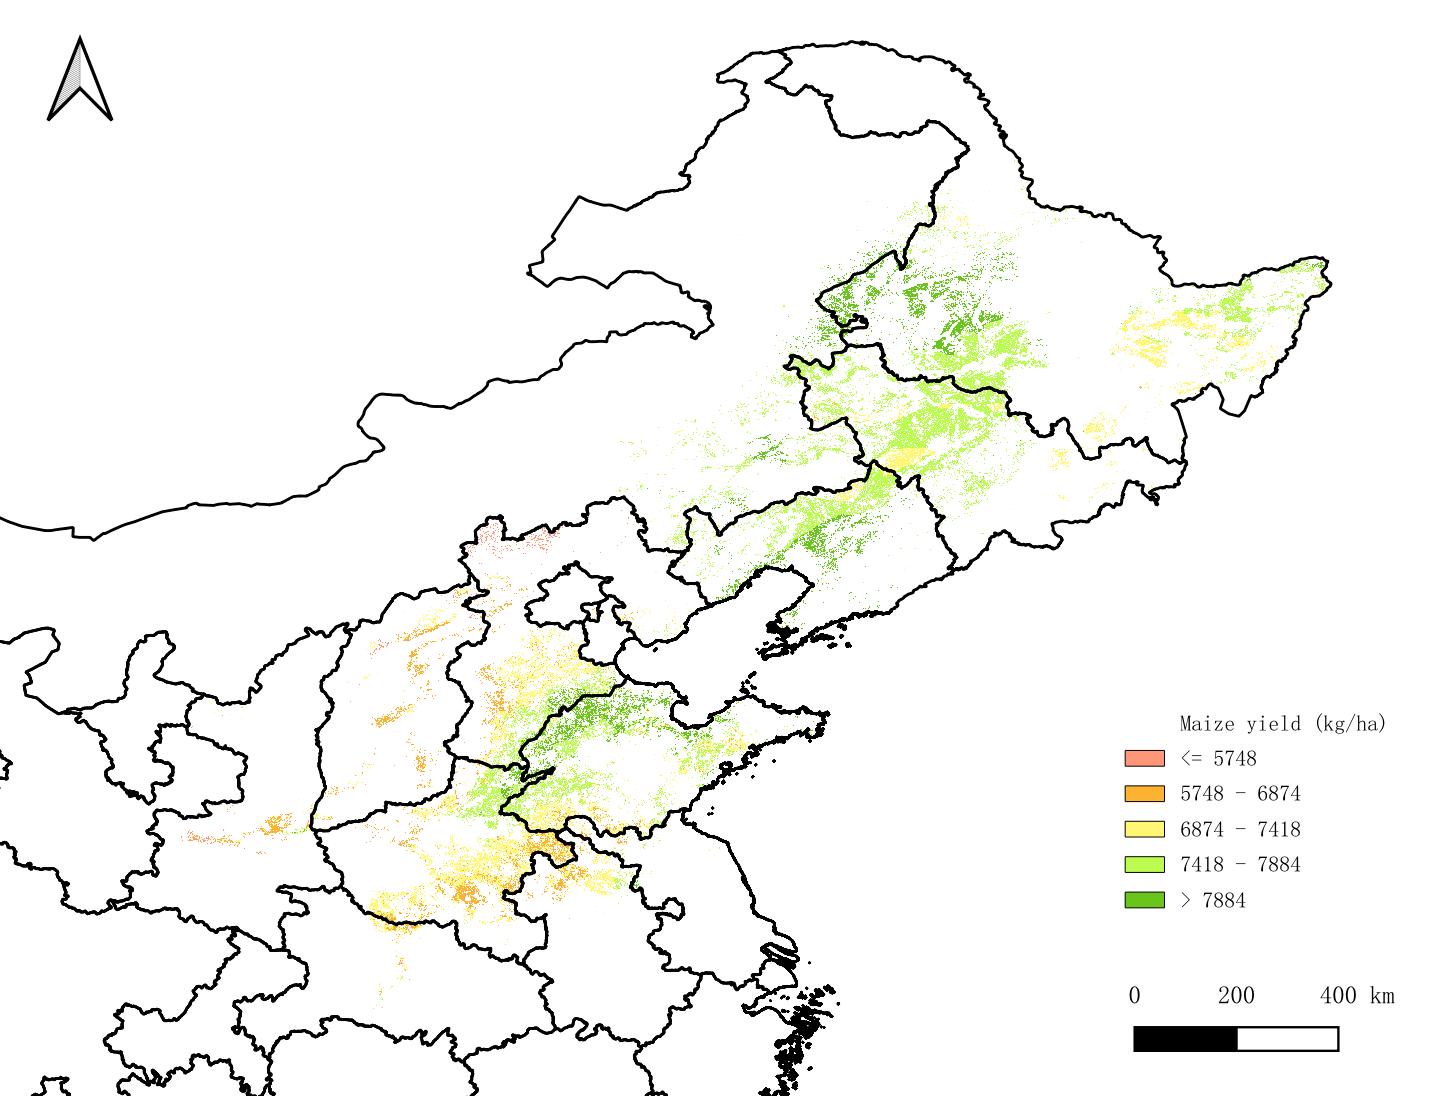
Fig. 2.1 Maize yield in North China and Northeast China in 2025
Table 2.2 Provincial Production and Year-on-Year Changes of Major Grain and Oil Crops in China, 2025
Province/Autonomous Region | Maize (10,000 t) | Rice (10,000 t) | Wheat (10,000 t) | Soybean (10,000 t) | ||||
2025 | change(%) | 2025 | change(%)) | 2025 | change(%) | 2025 | change(%) | |
Anhui | 442 | –1.6 | 1,551 | –6.3 | 1,501 | 5.4 | 102 | 2.2 |
Chongqing | 193 | –2.0 | 493 | 8.6 | ||||
Fujian | 223 | –3.9 | ||||||
Gansu | 502 | –10.2 | 271 | 1.5 | ||||
Guangdong | 1,034 | 2.0 | ||||||
Guangxi | 1,005 | 2.0 | ||||||
Guizhou | 463 | –7.6 | 602 | 13.1 | ||||
Hebei | 1,652 | –12.3 | 1,348 | 6.7 | 21 | 1.5 | ||
Heilongjiang | 5,252 | 7.8 | 2,409 | 3.6 | 726 | 5.2 | ||
Henan | 1,627 | –2.4 | 388 | 1.3 | 3,352 | 0.6 | 82 | –4.5 |
Hubei | 497 | –5.0 | 1,472 | –2.7 | 440 | –2.9 | ||
Hunan | 2,527 | 2.5 | ||||||
Inner Mongolia | 3,472 | 3.0 | 204 | 2.8 | 204 | 9.4 | ||
Jiangsu | 226 | –3.8 | 1,509 | –4.8 | 1,358 | –3.9 | 88 | 4.2 |
Jiangxi | 1,513 | 5.0 | ||||||
Jilin | 3,831 | 6.3 | 576 | 0.3 | 81 | 5.6 | ||
Liaoning | 1,822 | –1.1 | 473 | 7.0 | 47 | 3.3 | ||
Ningxia | 200 | 14.9 | 71 | 36.5 | ||||
Shaanxi | 462 | –3.1 | 91 | –11.7 | 391 | 2.4 | ||
Shandong | 1,780 | –6.4 | 2,726 | –1.7 | 76 | 5.5 | ||
Shanxi | 937 | –3.6 | 231 | –1.5 | 15 | –5.1 | ||
Sichuan | 629 | –3.7 | 1,606 | 7.4 | 186 | –2.7 | ||
Xinjiang | 1,004 | 12.7 | 551 | –0.8 | ||||
Yunnan | 581 | –12.5 | 577 | 2.7 | ||||
Zhejiang | 745 | 16.0 | ||||||
Subtotal | 25,572 | 0.5 | 18,864 | 2.2 | 12,559 | 0.6 | 1,442 | 4.7 |
China Total* | 26,602 | –0.6 | 19,692 | –1.3 | 13,774 | 0.4 | 1,915 | 2.7 |
(2)Semi late Rice
In 2025, China’s semi-late rice production experienced an overall decline, with marked regional differences. The total planted area reached 21.601 million hectares, down 1.3% year on year, while the average yield decreased by 0.7% to 6,255 kg/ha. Consequently, total production was 135.12 million tons, 2.0% lower than in 2024 (–2.79 million tons). The national reduction was primarily driven by declining yields in the middle and lower reaches of the Yangtze River, although some local areas achieved significant gains through climate-adaptive management practices.
Production gains were relatively concentrated, mainly in Southwest China and parts of the Northeast. In Guizhou, output rose 13.1%, primarily due to substantial increases in yield. In Sichuan, with planted area essentially unchanged (+0.1%), a 7.2% increase in yield led to a 7.4% rise in total output, reaching 16.06 million tons. In Chongqing, simultaneous increases in area (+1.9%) and yield (+6.6%) resulted in an 8.6% growth in production. In the Northeast, gains were centered in Heilongjiang and Liaoning: Heilongjiang saw a slight expansion in area (+0.2%) and a 3.4% rise in yield, resulting in a 3.6% increase in production, while Liaoning increased its planted area by 6.9% with a modest 0.1% yield gain, leading to a 7.0% rise in output. In the Northwest, Ningxia, supported by well-developed irrigation infrastructure, became the province with the highest growth rate nationwide.
Areas of decline were concentrated in the middle and lower Yangtze River region, primarily due to excessive precipitation and other unfavorable weather conditions. Among the provinces, Anhui, Hubei, and Jiangsu experienced the most pronounced reductions: Anhui’s yield fell 5.6%, resulting in a 6.3% drop in production; Hubei saw yield decline by 3.5%, with total output down 3.0%; and Jiangsu’s semi-late rice output decreased 4.8% year on year.
Table 2.3 Semi late Rice Production in China, 2025
Province/ Autonomous Region | Area (kha) | Yield (kg/ha) | Production (10,000 t) | |||||||
2024 | 2025 | change (%) | 2024 | 2025 | change (%) | 2024 | 2025 | Production change | Change (%) | |
Anhui | 1,958 | 1,942 | –0.8 | 7,009 | 6,620 | –5.6 | 1,373 | 1,286 | –87 | –6.3 |
Chongqing | 754 | 768 | 1.9 | 6,025 | 6,420 | 6.6 | 454 | 493 | 39 | 8.6 |
Guizhou | 773 | 765 | –1.0 | 6,886 | 7,873 | 14.3 | 532 | 602 | 70 | 13.1 |
Heilongjiang | 4,880 | 4,891 | 0.2 | 4,764 | 4,926 | 3.4 | 2,325 | 2,409 | 84 | 3.6 |
Henan | 620 | 620 | 0.0 | 6,177 | 6,259 | 1.3 | 383 | 388 | 5 | 1.3 |
Hubei | 1,352 | 1,359 | 0.5 | 8,212 | 7,927 | –3.5 | 1,110 | 1,077 | –33 | –3.0 |
Hunan | 1,276 | 1,279 | 0.3 | 6,563 | 7,055 | 7.5 | 837 | 903 | 65 | 7.8 |
Jiangsu | 2,330 | 2,446 | 5.0 | 6,798 | 6,167 | –9.3 | 1,584 | 1,509 | –75 | –4.8 |
Jiangxi | 459 | 467 | 1.8 | 6,375 | 7,030 | 10.3 | 292 | 328 | 36 | 12.3 |
Jilin | 941 | 915 | –2.8 | 6,096 | 6,294 | 3.2 | 574 | 576 | 2 | 0.3 |
Liaoning | 722 | 772 | 6.9 | 6,120 | 6,127 | 0.1 | 442 | 473 | 31 | 7.0 |
Ningxia | 72 | 86 | 18.9 | 7,214 | 8,283 | 14.8 | 52 | 71 | 19 | 36.5 |
Shaanxi | 162 | 162 | –0.2 | 6,396 | 5,655 | –11.6 | 104 | 91 | –12 | –11.7 |
Sichuan | 2,159 | 2,162 | 0.1 | 6,926 | 7,426 | 7.2 | 1,495 | 1,606 | 110 | 7.4 |
Yunnan | 873 | 889 | 1.8 | 6,437 | 6,493 | 0.9 | 562 | 577 | 15 | 2.7 |
Zhejiang | 650 | 637 | –2.0 | 7,720 | 8,183 | 6.0 | 502 | 521 | 20 | 3.9 |
Subtotal | 19,981 | 20,160 | 0.9 | 6,317 | 6,404 | 1.4 | 12,621 | 12,910 | 289 | 2.3 |
China | 21,893 | 21,601 | –1.3 | 6,299 | 6,255 | –0.7 | 13,790 | 13,512 | –279 | –2.0 |
(3) Slight Decrease in late rice total output
Based on high-resolution remote sensing monitoring data, the production situation of late rice in China’s main producing provinces in 2025 generally showed a pattern of “slightly increased area, pressured yield, and marginally reduced total output.” The total planted area in the main provinces was estimated at 7.176 million hectares, a slight decrease of 0.8% year on year, with an average yield of 4,665 kg/ha, down 1.2% from 2024. As a result, total production was 33.48 million tons, representing a 2.0% year-on-year decline.
Regionally, the main producing provinces exhibited marked differentiation. Central provinces such as Hunan and Hubei maintained stable production by expanding planting area: in Hunan, the late rice area reached 1.552 million hectares, up 5.5%, effectively offsetting a 4.6% decline in yield and resulting in a 0.6% increase in total output. In Hubei, area increased 4.4% to 537 thousand hectares; despite a 3.5% decrease in yield, total production still rose 0.8%. In Jiangxi, planted area reached 1.340 million hectares, up 3.1%, but a decline in yield led to a 4.6% reduction in total output. In Anhui, reduced planting area caused production to fall 3.8%.
Southern late rice regions faced production pressures. In Guangdong, the area decreased to 1.051 million hectares (–5.5% year on year); although yield rose 1.9%, total output still declined 3.7%. In Guangxi, the planted area was 1.072 million hectares, down 1.4%, with yield falling 2.6%, resulting in a 4.0% reduction in total production.
Overall, late rice production in 2025 was significantly influenced by regional climatic conditions. In the middle and lower reaches of the Yangtze River, stable planting areas helped partially mitigate the impact of declining yield, while reductions in area and yield in southern provinces collectively contributed to the national decline in late rice production.
Table 2.4 Late Rice Production in China, 2025
Province/ Autonomous Region | Area (kha) | Yield (kg/ha) | Production (10,000 t) | ||||||
2024 | 2025 | change(%) | 2024 | 2025 | change(%) | 2024 | 2025 | change(%) | |
Anhui | 335 | 321 | –4.3 | 4,904 | 4,925 | 0.4 | 164 | 158 | –3.8 |
Hubei | 514 | 537 | 4.4 | 6,192 | 5,976 | –3.5 | 318 | 321 | 0.8 |
Hunan | 1,471 | 1,552 | 5.5 | 5,074 | 4,840 | –4.6 | 747 | 751 | 0.6 |
Jiangxi | 1,300 | 1,340 | 3.1 | 4,474 | 4,139 | –7.5 | 581 | 555 | –4.6 |
Zhejiang | 143 | 146 | 2.2 | 5,871 | 5,319 | –9.4 | 84 | 78 | –7.4 |
Guangdong | 1,112 | 1,051 | –5.5 | 5,339 | 5,443 | 1.9 | 594 | 572 | –3.7 |
Guangxi | 1,088 | 1,072 | –1.4 | 4,718 | 4,595 | –2.6 | 513 | 493 | –4.0 |
Fujian | 207 | 215 | 3.9 | 6,937 | 6,360 | –8.3 | 144 | 137 | –4.8 |
Subtotal | 6,169 | 6,234 | 1.0 | 5,098 | 4,915 | –3.6 | 3,145 | 3,064 | –2.6 |
China | 7,235 | 7,176 | –0.8 | 4,723 | 4,665 | –1.2 | 3,417 | 3,348 | –2.0 |
(4) Soybean Production
In 2025, the total soybean production of China is projected to reach 19.15 million tons, up 0.50 million tons (+2.7%) compared with 2024. The regional distribution shows a clear pattern of “overall increase in Northeast China and differentiated performance in the Huang-Huai-Hai region.” The Northeast continues to strengthen its role as the main production base for soybeans, while most provinces in the Huang-Huai-Hai region achieve increases, with only a few provinces experiencing reductions due to adverse weather.
The four provinces of Northeast China are the absolute drivers of national soybean production growth, accounting for 86.6% of the total increase. In Inner Mongolia, production leads the nation with a 9.4% increase, reaching 2.036 million tons, an increase of 0.175 million tons. Heilongjiang, the largest soybean-producing province in China, sees production rise to 7.261 million tons (+5.2%), adding 0.358 million tons and contributing nearly 70% of the national increase. Jilin and Liaoning also achieve increases of 5.6% and 3.3%, respectively.
In the Huang-Huai-Hai region, most provinces record growth. Shandong, Jiangsu, Anhui, and Hebei all achieve positive gains of 5.5%, 4.2%, 2.2%, and 1.5%, respectively, with total production reaching 0.763 million tons, 0.876 million tons, 1.024 million tons, and 0.206 million tons.
Table 2.5 Soybean Production in China, 2025
Province/ Autonomous Region | Production (10,000 t) | |||
2024 | 2025 | Production change | change(%) | |
Anhui | 100.2 | 102.4 | 2.2 | 2.2 |
Hebei | 20.3 | 20.6 | 0.3 | 1.5 |
Heilongjiang | 690.3 | 726.1 | 35.8 | 5.2 |
Henan | 86.2 | 82.3 | –3.9 | –4.5 |
Inner Mongolia | 186.1 | 203.6 | 17.5 | 9.4 |
Jiangsu | 84.1 | 87.6 | 3.5 | 4.2 |
Jilin | 76.2 | 80.5 | 4.3 | 5.6 |
Liaoning | 45.8 | 47.3 | 1.5 | 3.3 |
Shandong | 72.3 | 76.3 | 4.0 | 5.5 |
Shanxi | 15.8 | 15.0 | –0.8 | –5.1 |
Subtotal | 1,377.3 | 1,441.7 | 64.4 | 4.7 |
Others | 487.7 | 473.3 | –14.4 | –3.0 |
China | 1,865 | 1,915 | 50 | 2.7 |