
 English
 中文

Bulletin
CropWatch bulletinMenu
Authors: zenghongwei | Edit: zenghongwei
During the monitoring period from July to September 2025, U.S. summer crops entered critical growth stages, and overall agroclimatic conditions were mixed. CropWatch indicated a national precipitation of 223 mm, 14% below the 15-year average; the mean temperature was 19.0°C, slightly higher by 0.4°C; and photosynthetically active radiation was 4% above normal, partially mitigating the adverse effects of water deficit on crop growth. Potential accumulated biomass (BIOMSS) reached 704 gDM/m², 5% lower than the 15-year average. Despite below-average rainfall, the cultivated area fraction (CALF) rose to 92%, 5% higher than the five-year mean. The maximum vegetation condition index (VCIx) was 0.91, indicating overall good crop growth. The crop production index(CroPI) reached 1.11, reflecting generally favorable agricultural conditions.
Regionally, crop performance varied significantly. Corn belt crops exhibited the best growth, with cultivated area near 100% and VCIx as high as 0.99. In the northern Great Plains, precipitation was extremely low, 62% below average, and temperatures were 1.1°C above normal, resulting in noticeable drought impacts. In the Northwest, while sunlight was abundant, precipitation was severely deficient, with VCIx below 0.75, indicating poor crop growth. Overall, from July to September 2025, the U.S. agricultural system demonstrated strong resilience under variable climatic conditions. National crop production is expected to remain stable or slightly increase, with the corn belt and southeastern regions performing most favorably, while northern Great Plains and southwestern areas require careful monitoring of drought risks.
(1) Corn Yield Forecast
CropWatch remote sensing indicates that, as of October 2025, U.S. maize production showed simultaneous growth in both planted area and yield, resulting in a significant increase in total production. Favorable agroclimatic conditions and supportive policies contributed to an increase in maize planted area from 32.92 million hectares in 2024 to 34.68 million hectares in 2025, up 5.3% year-on-year. In major maize-producing regions, suitable climate conditions promoted crop growth, raising the national average yield from 11,285 kg/ha to 11,669 kg/ha, up 3.4%. The combined growth in area and yield drove total maize production up from 372 million tons in 2024 to 405 million tons in 2025, an 8.9% year-on-year increase.
(2) Soybean Yield Forecast
CropWatch monitoring shows that U.S. soybean production experienced a decline in planted area, a slight increase in yield, and a minor reduction in total production. National soybean planted area fell from 36.46 million hectares in 2024 to 35.61 million hectares in 2025, a 2.3% decrease. Average yield increased slightly from 3,778 kg/ha to 3,809 kg/ha, up 0.8%. Due to the reduction in planted area, total national soybean production decreased from 138 million tons in 2024 to 136 million tons in 2025, a 1.5% year-on-year decline.
Table 2.9 U.S. Maize and Soybean Production, July–September 2025
Crop Type | Area (kha) | Yield (kg/ha) | Total Production (10,000 tons) | ||||||
2024 | 2025 | Change | 2024 | 2025 | Change | 2024 | 2025 | Change | |
Maize | 32,920 | 34,675 | 5.30% | 11,285 | 11,669 | 3.40% | 37,151 | 40,461 | 8.90% |
Soybean | 36,457 | 35,611 | -2.30% | 3,778 | 3,809 | 0.80% | 13,774 | 13,564 | -1.50% |
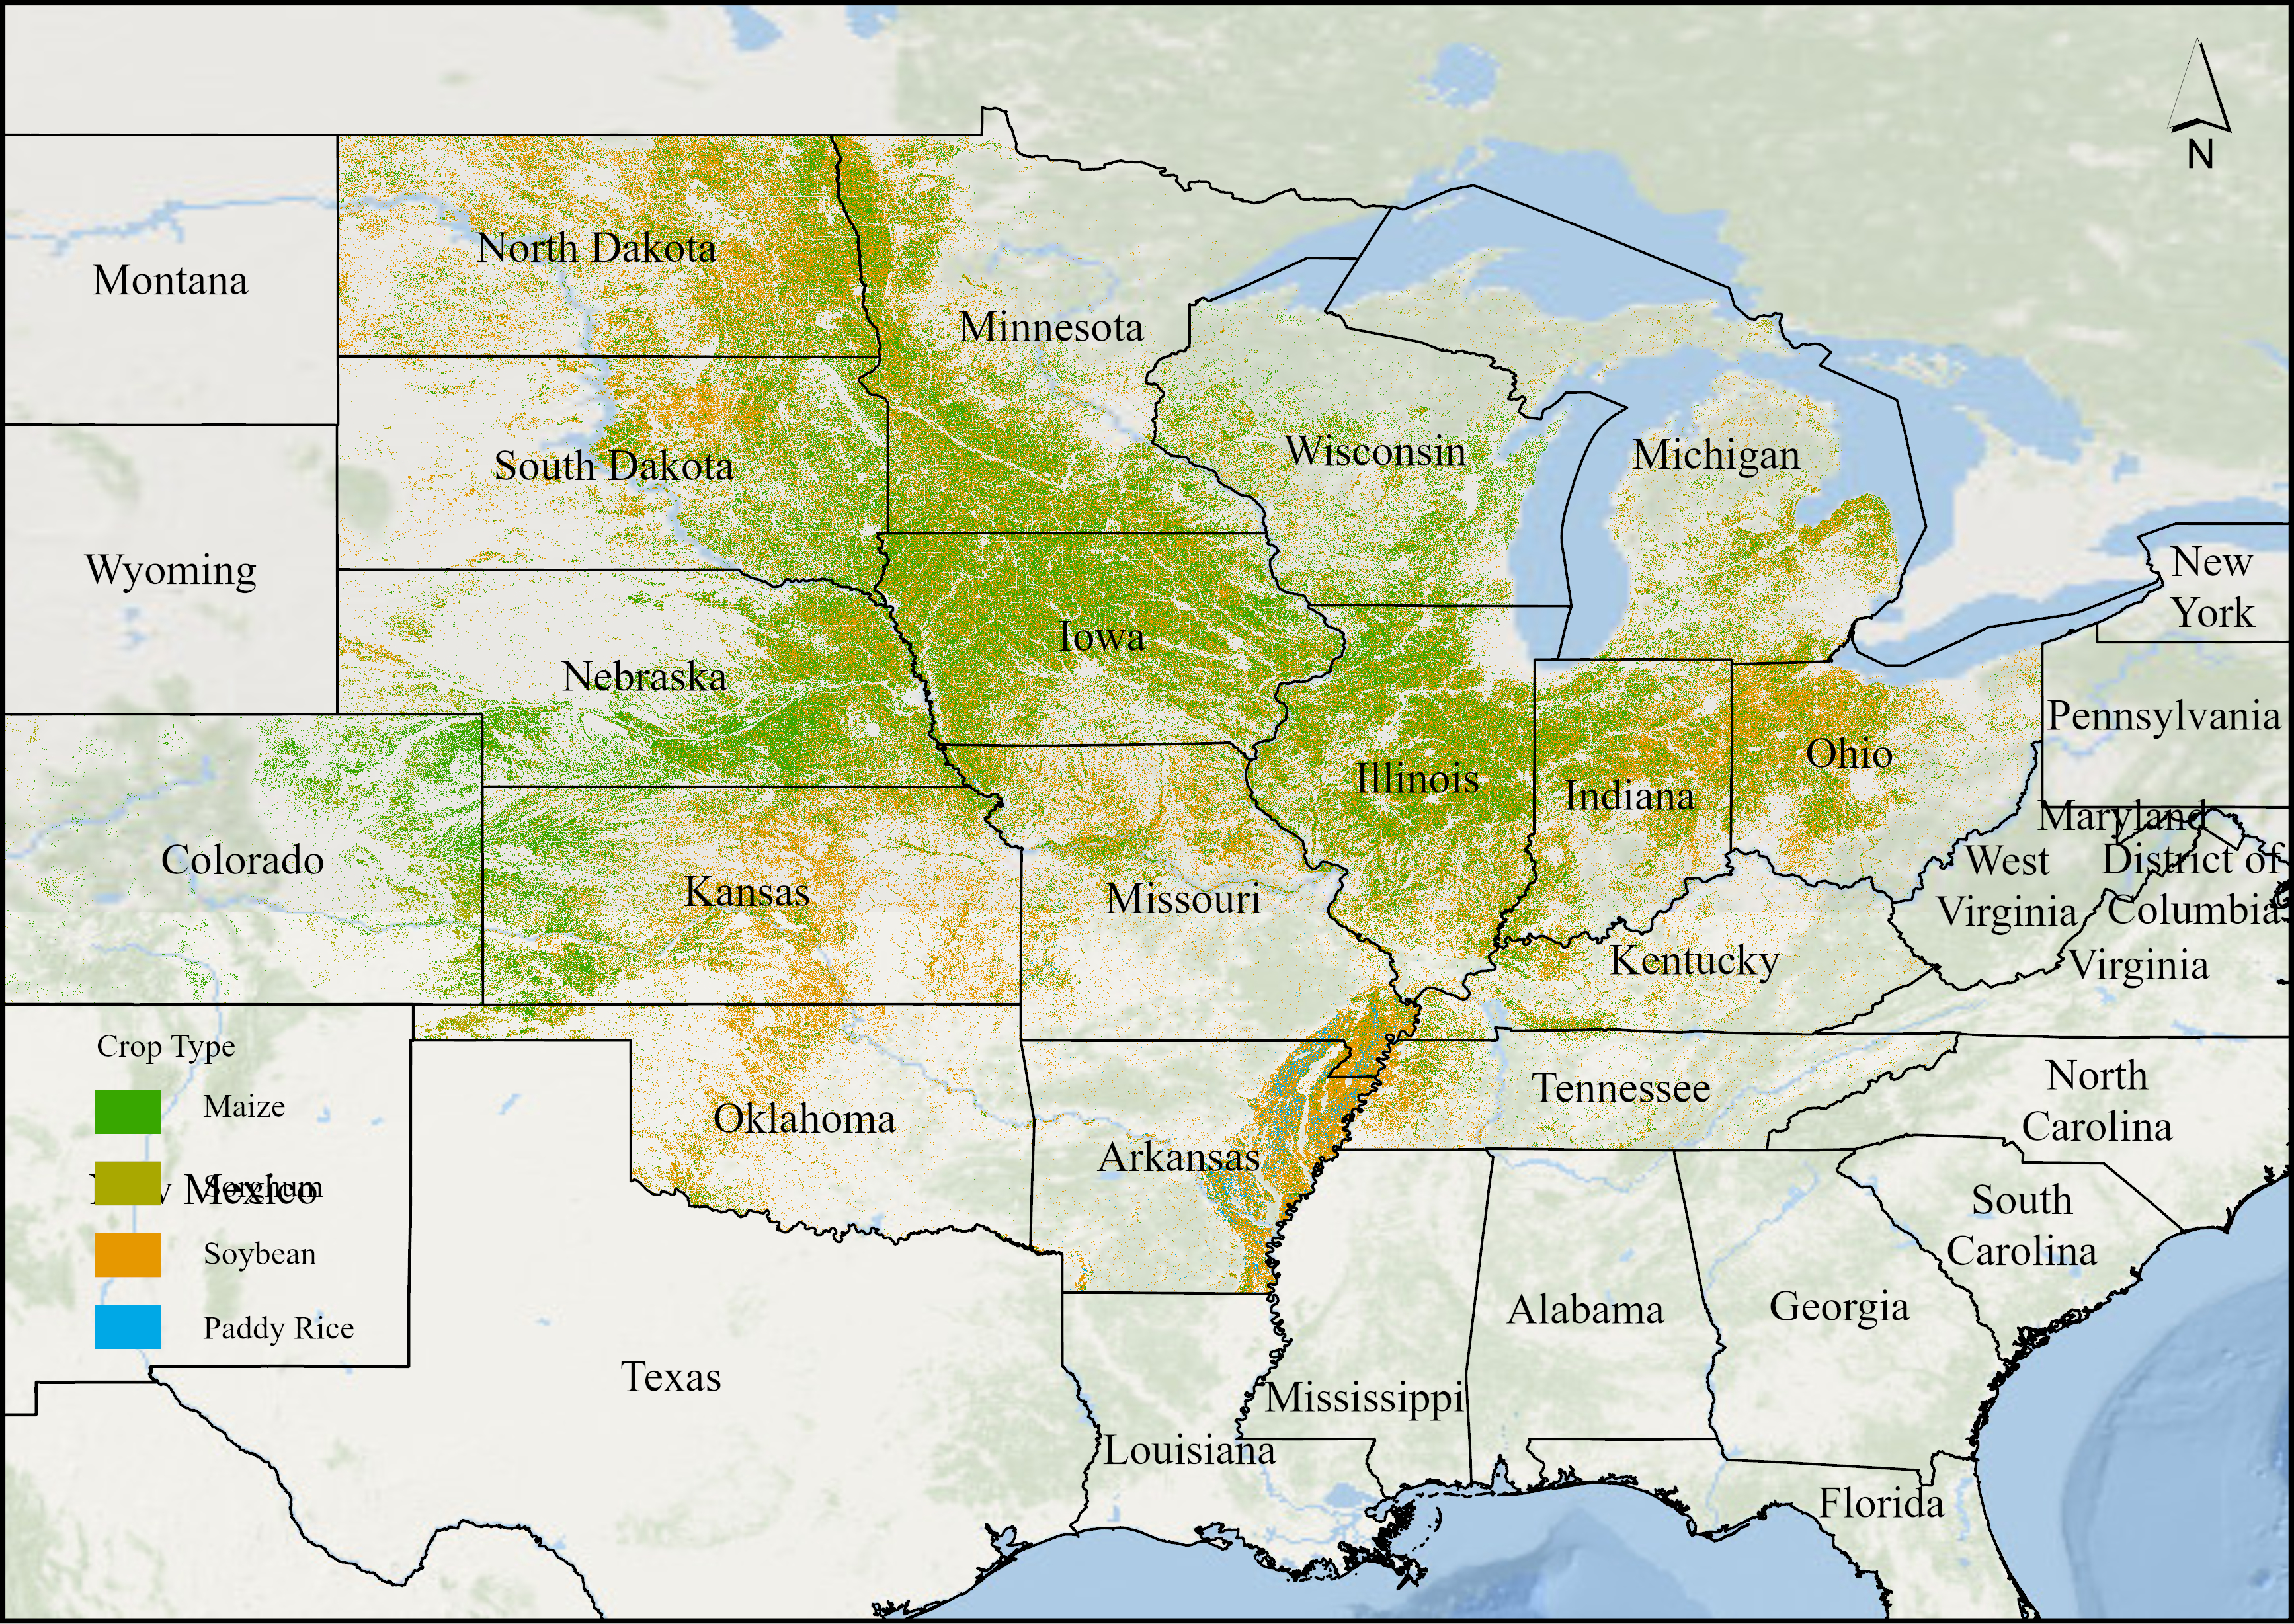
Figure 2.12 Spatial distribution of maize, soybean, and rice in the United States, July–September 2025