
 English
 中文

Bulletin
CropWatch bulletinMenu
Authors: air_panqc | Edit: zenghongwei
During July–September 2025, India entered the peak growing stage of its main Kharif crops. Remote sensing monitoring indicated that the spatial distribution of rice, maize, and soybean remained largely consistent with last year. However, due to below-average RAIN (727 mm nationally, 30% lower than the 15-year average) and slightly higher TEMP (27.0°C, +0.5°C above average), crop growth in rainfed areas showed notable spatial variations. The RADPAR increased by 5% compared with the long-term average, partly offsetting the negative impact of water shortages. The national BIOMASS decreased by 9%, but agricultural indicators suggested normal overall progress (CALF = 95%), and the Crop Production Index (CPI = 1.01) reflected generally favorable crop conditions. The Palmer Drought Severity Index (PDSI = 1.98) and Crop Water Stress Index (CWSI = 1.39) indicated that drought conditions persisted in some central and western regions.
Rice
Rice production in 2025 increased steadily. The national rice area reached 46,717 thousand hectares, up 4.3% year-on-year; average yield improved by 2.4% to 4,808 kg/ha, and total production reached 224.6 million tons, representing a 6.8% increase compared with last year. Major rice-producing areas remained concentrated in the Gangetic Plain, eastern coastal, and central regions. Favorable irrigation and radiation conditions supported strong growth in northern and central irrigated zones, while rainfall deficits in parts of the eastern coastal region slightly reduced yields locally. Overall, the increase in rice production was mainly driven by expanded planting and stable yields in central and Gangetic Plain areas, while coastal and rainfed regions remained constrained by mild drought.
Maize
Maize production showed a slight decline. The total maize area was 11,071 thousand hectares (–4.8% year-on-year), with an average yield of 3,770 kg/ha (–0.8%), resulting in a total output of 41.7 million tons, down 5.7% compared with last year. The main causes were insufficient monsoon rainfall and delayed sowing, leading to yield reductions in several rainfed areas of central and western India. However, irrigated regions in the central and northwestern zones maintained relatively high and stable yields. Overall, maize production decreased slightly but remained stable in the national grain supply structure.
Soybean
Soybean production remained generally stable. The total area reached 12,596 thousand hectares (–2.3% year-on-year), with an average yield of 1,200 kg/ha (–0.8%), and total production of 15.1 million tons, showing a slight increase of 1.4% compared with 2024. Favorable sunlight and soil moisture in central India promoted crop growth, while eastern coastal regions experienced minor yield losses due to dry conditions. Overall, soybean production remained stable, reflecting strong climate adaptability and production resilience.
Overall, India' s Kharif season in 2025 was characterized by generally favorable conditions and stable production. Rice production increased notably, soybean remained stable, and maize declined slightly. Although insufficient and uneven rainfall was the main limiting factor, adequate solar radiation and temperature conditions, along with well-developed irrigation systems, helped buffer the impacts of water shortages in major producing regions. Future yield outcomes will depend on the continuity and spatial distribution of post-monsoon rainfall. In general, India' s Kharif crop production remained stable, with regional drought risks still requiring attention.
Table 2.6 Review of rice, maize, and soybean production in India, July–September 2025
Crop Type | Area (thousand ha) | Yield (kg/ha) | Total production (million tons) | |||||||||
2024 | 2025 | Change(%) | 2024 | 2025 | Change(%) | 2024 | 2025 | Change(%) | ||||
Rice | 44799 | 46717 | 4.3% | 4696 | 4808 | 2.4% | 21037 | 21475 | 6.8% | |||
Maize | 11630 | 11071 | -4.8% | 3800 | 3770 | -0.8 % | 4420 | 4174 | -5.7% | |||
Soybean | 12307 | 12596 | 2.3% | 1211 | 1200 | -0.8% | 1490 | 1512 | 1.4% | |||
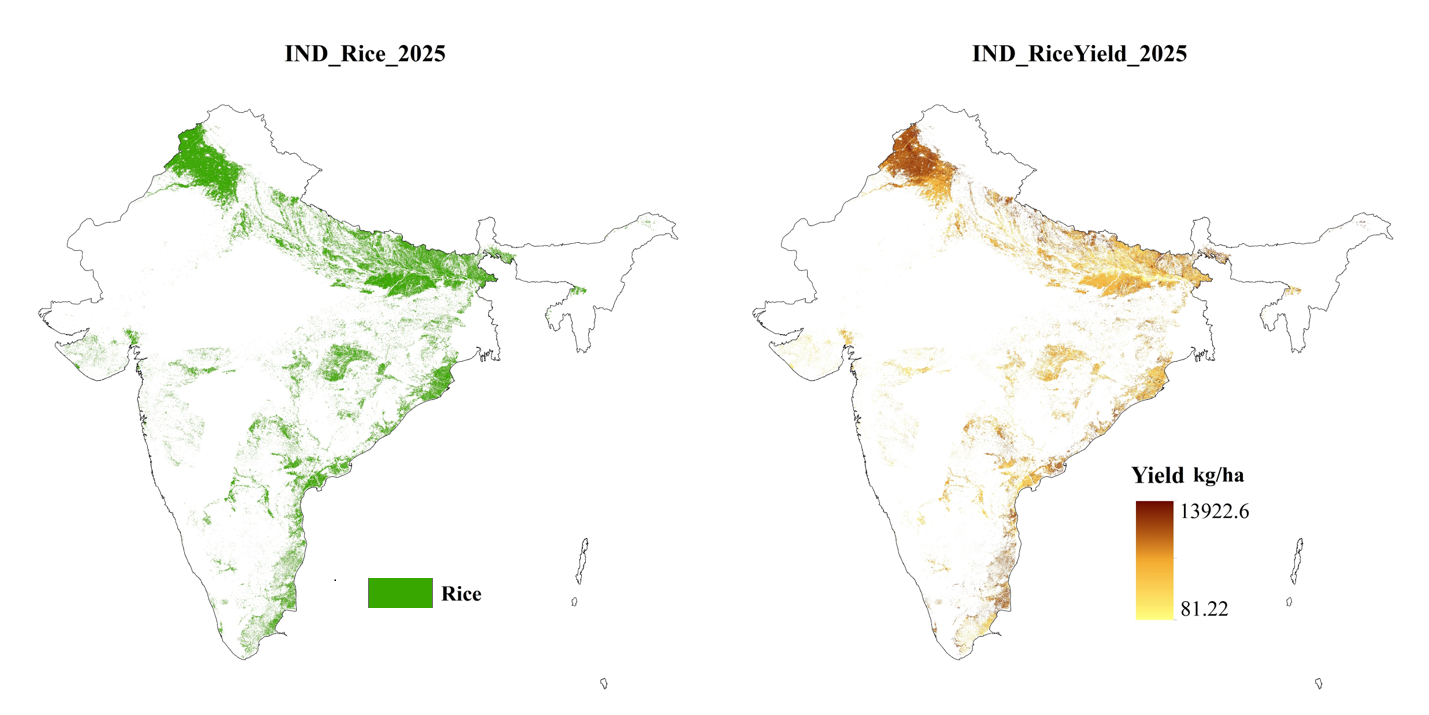
Figure2.11 Distribution and rice yield in India in 2025