
 English
 中文

Bulletin
CropWatch bulletinMenu
Authors: yannn,lirui | Edit: qinxl
(1) Global croplands generally drier than normal
Based on SMAP root-zone soil moisture observations, the global pattern of soil moisture anomalies during July–September 2026 was predominantly negative, indicating a pronounced decline in soil moisture status across global croplands. Approximately 70% of cropland areas recorded soil moisture levels below the multi-year average for the corresponding period (Fig. 1.4a). Notably, further declines relative to the climatic norm were observed in southwestern India, the African Sahel, most of China, northern Kazakhstan, and eastern Europe. In contrast, drought conditions were alleviated in southern Brazil and northern India (Fig. 1.4b, Fig. 1.4c). CropWatch monitoring further revealed that, since July 2026, the areal fraction of global cropland under high-risk water stress (return period > 5 years) has continued to expand, while the proportion under moderate-risk water stress (return period 2–5 years) has remained persistently elevated (Fig. 1.5a). During the July–September monitoring window, agricultural drought risk in Africa and Europe exceeded that of other continents (Fig. 1.5b). Specifically, high-risk drought events with a return period of ≥ 10 years were identified in late July across eastern Africa, Madagascar, and France (Fig. 1.6a); in late August, such events occurred in the eastern Sahel and eastern Brazil (Fig. 1.6b); and in late September, they were detected in southern Europe and southern Russia (Fig. 1.6c).
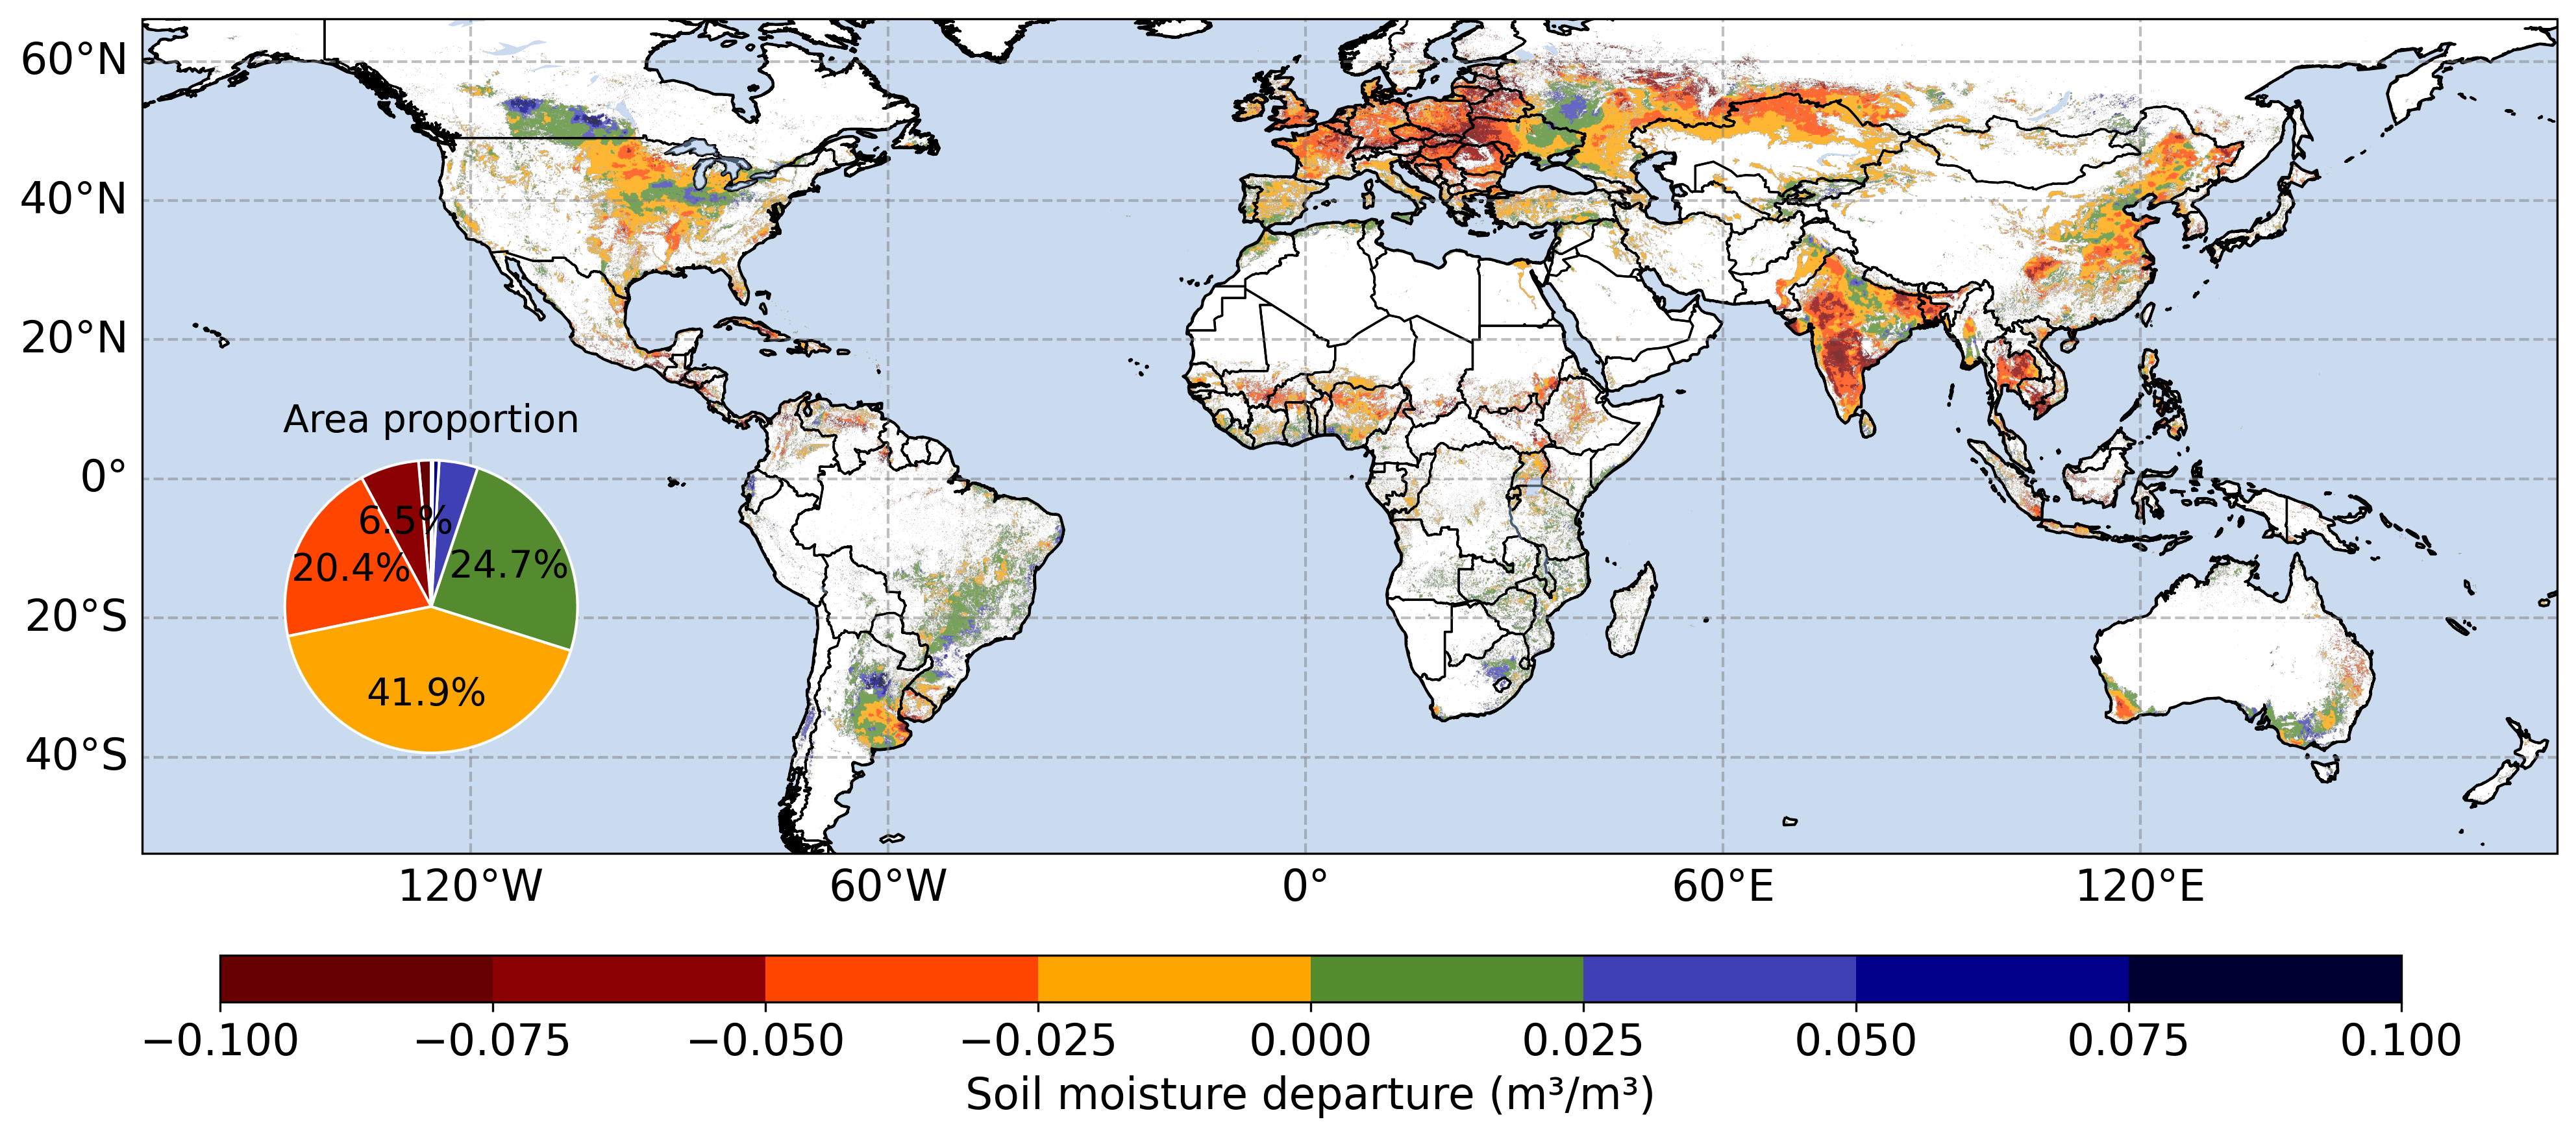
(a) Soil moisture anomaly during July–September 2026

(b) Change of soil moisure anomaly from Augus to September
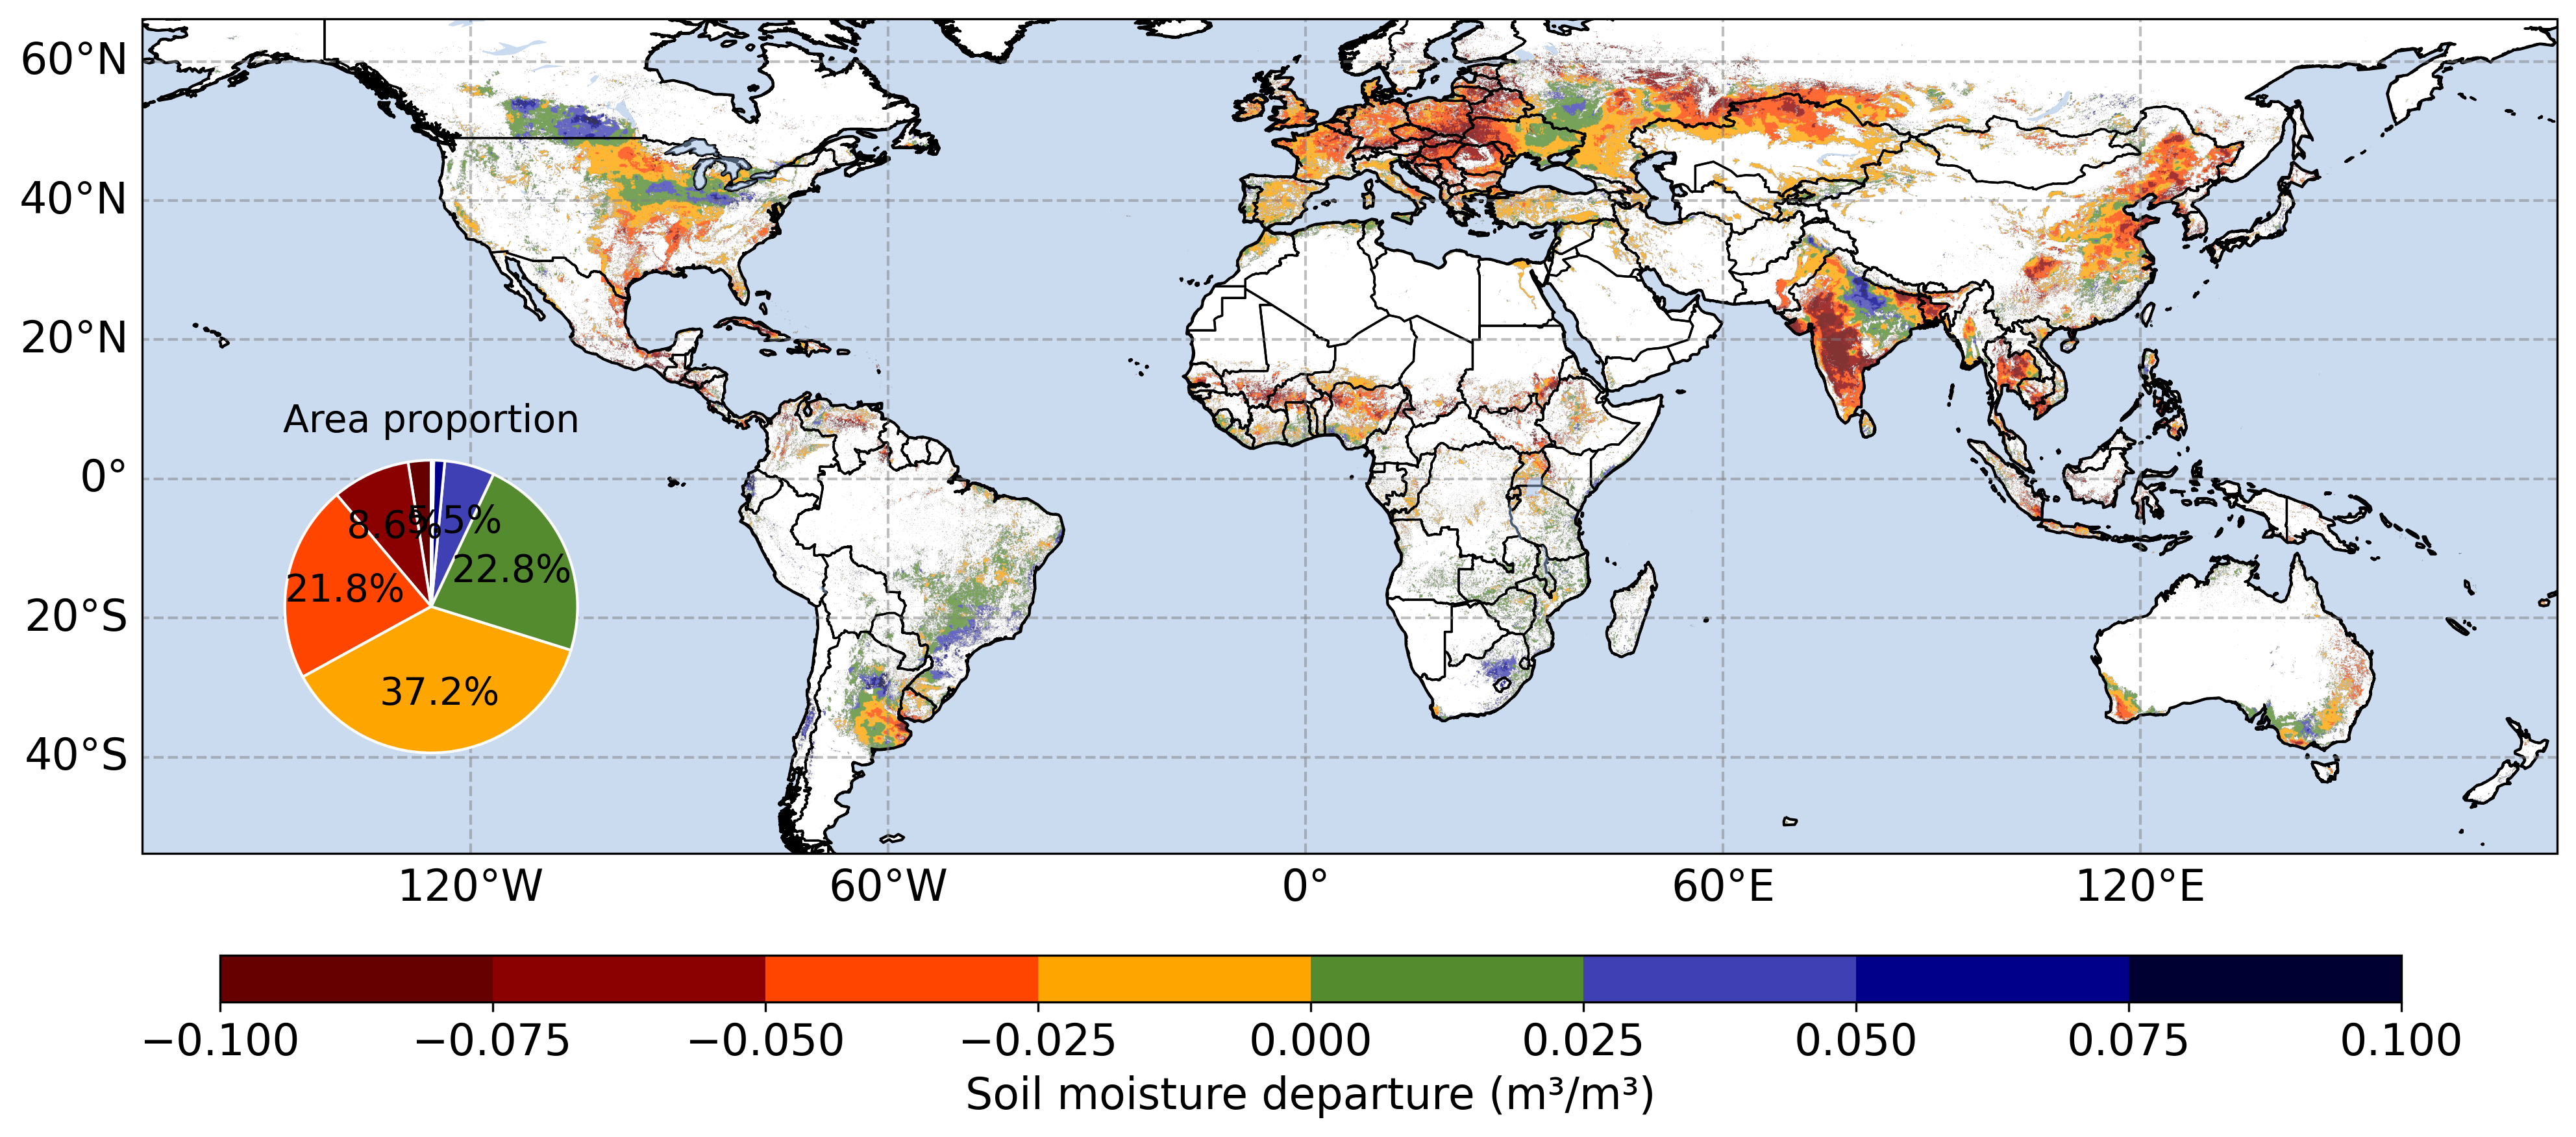
(c) Soil moisure anomaly in September
Figure 1.4 Global cropland root-zone soil moisture anomalies (reference period: 2016–2025).
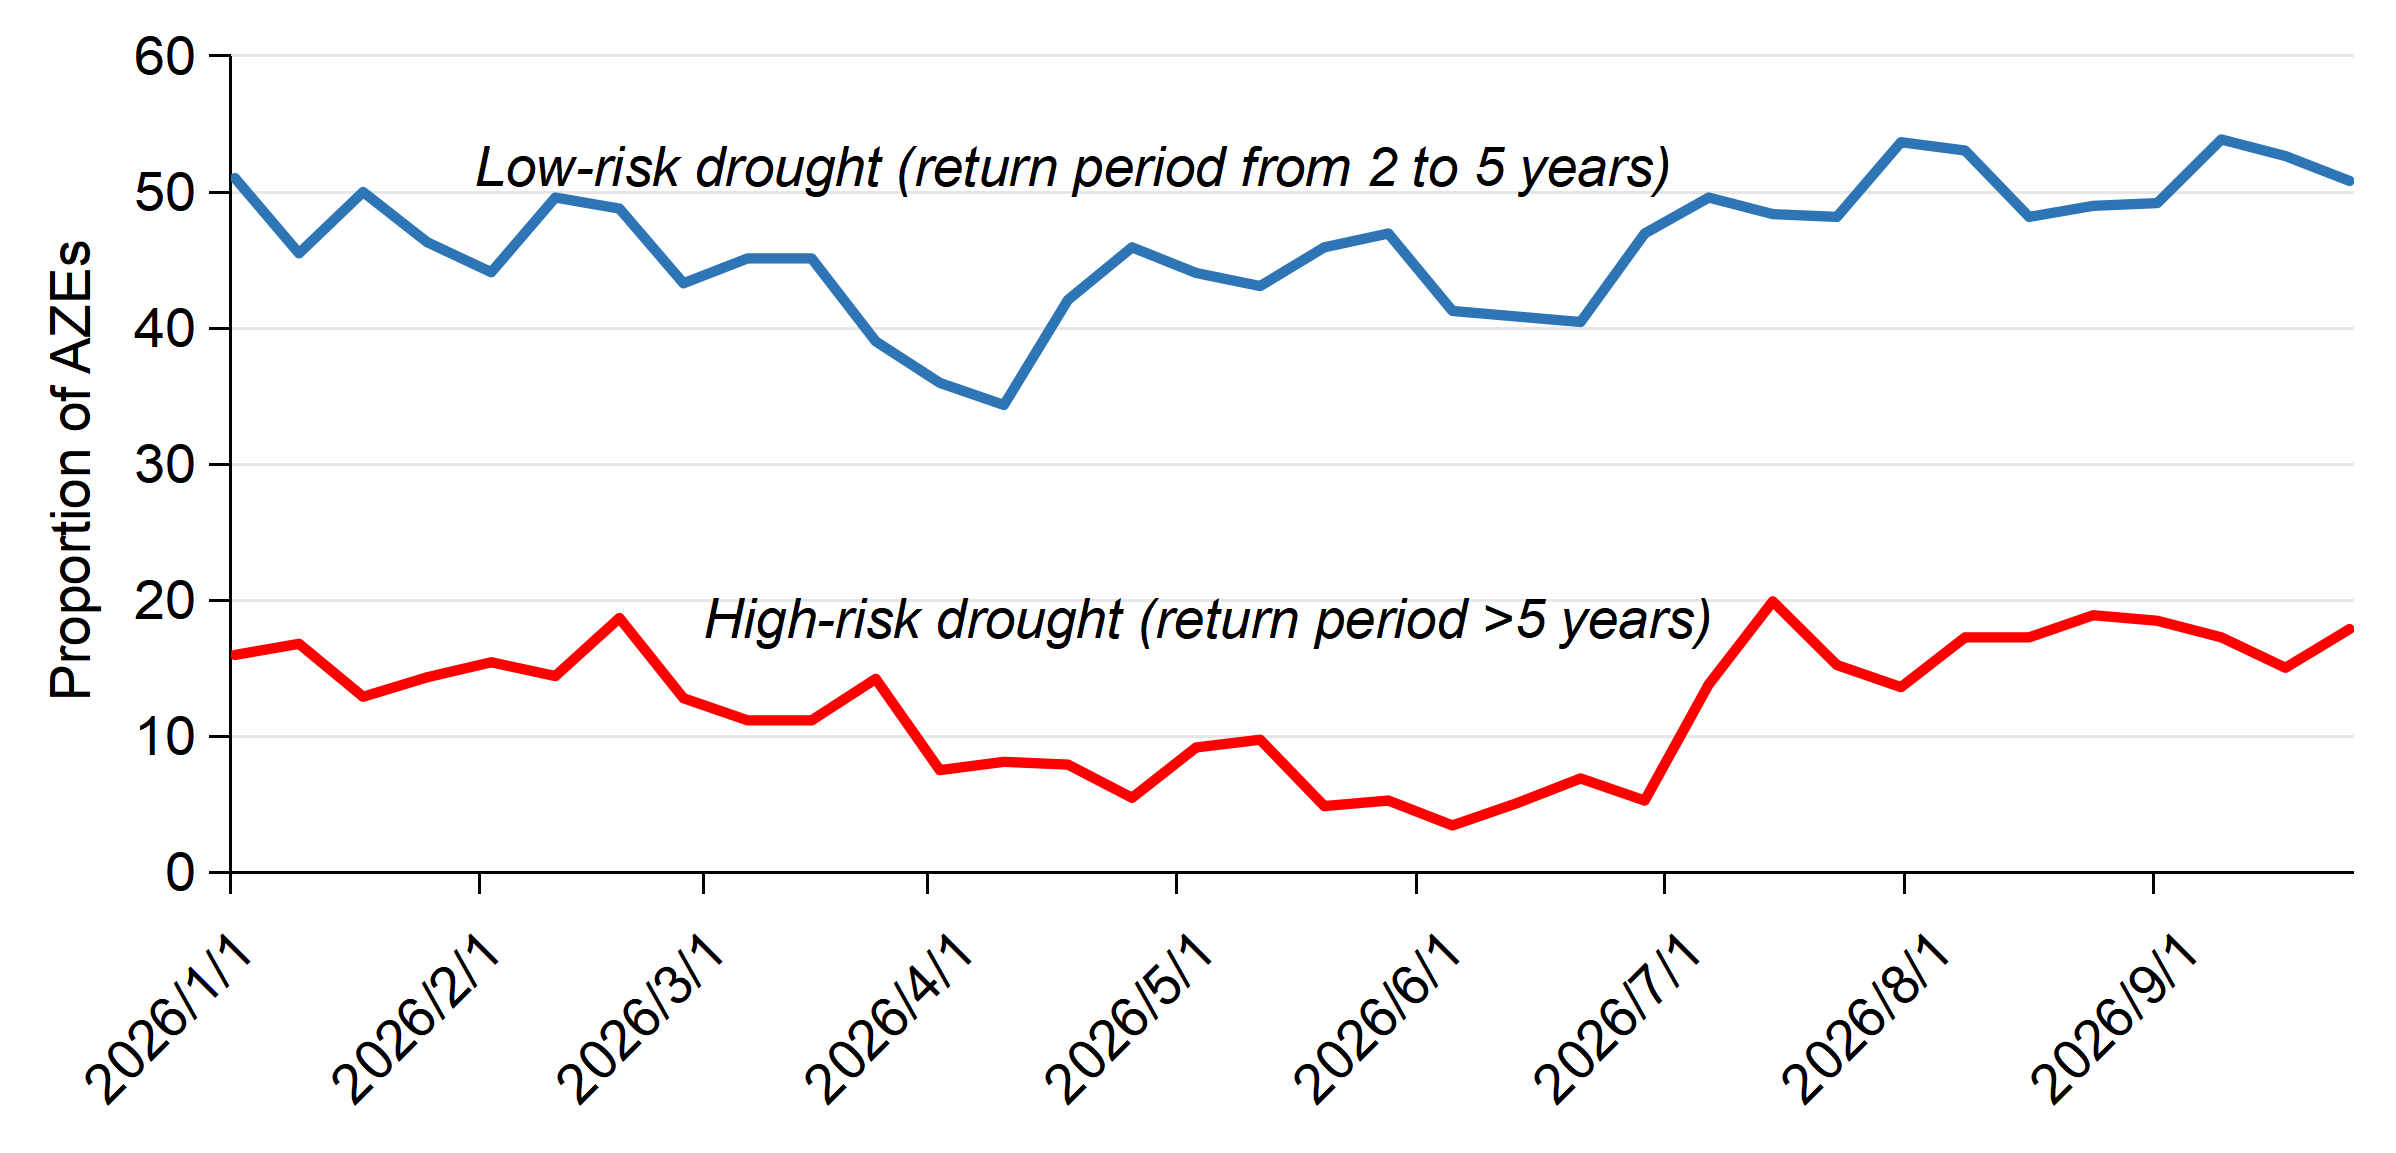
(a) Temporal variation of water stress drought risk in global AEZs
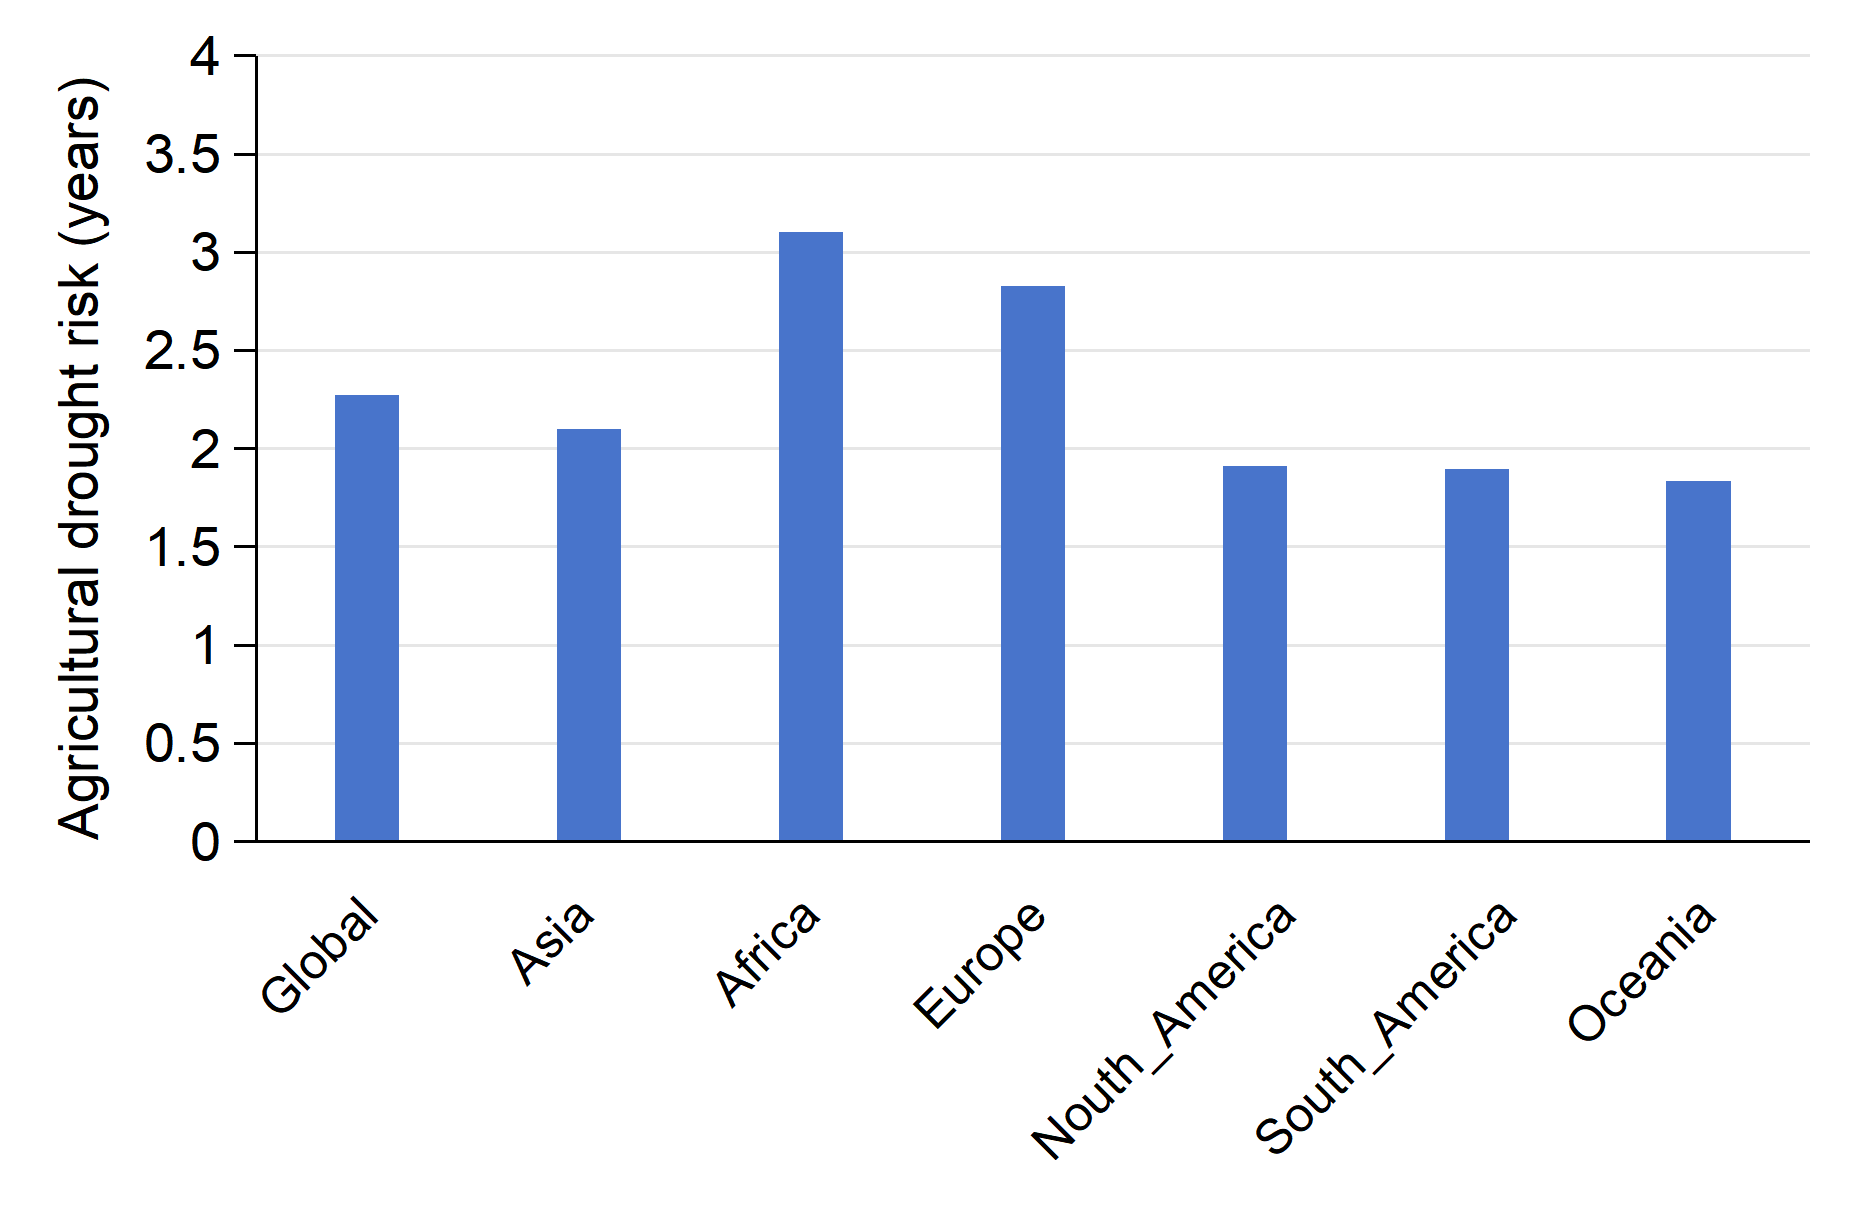
(b) Continental mean water stress drought risk during July–September
Figure 1.5 Agricultural water stress drought risk in global and continental agro-ecological zones.
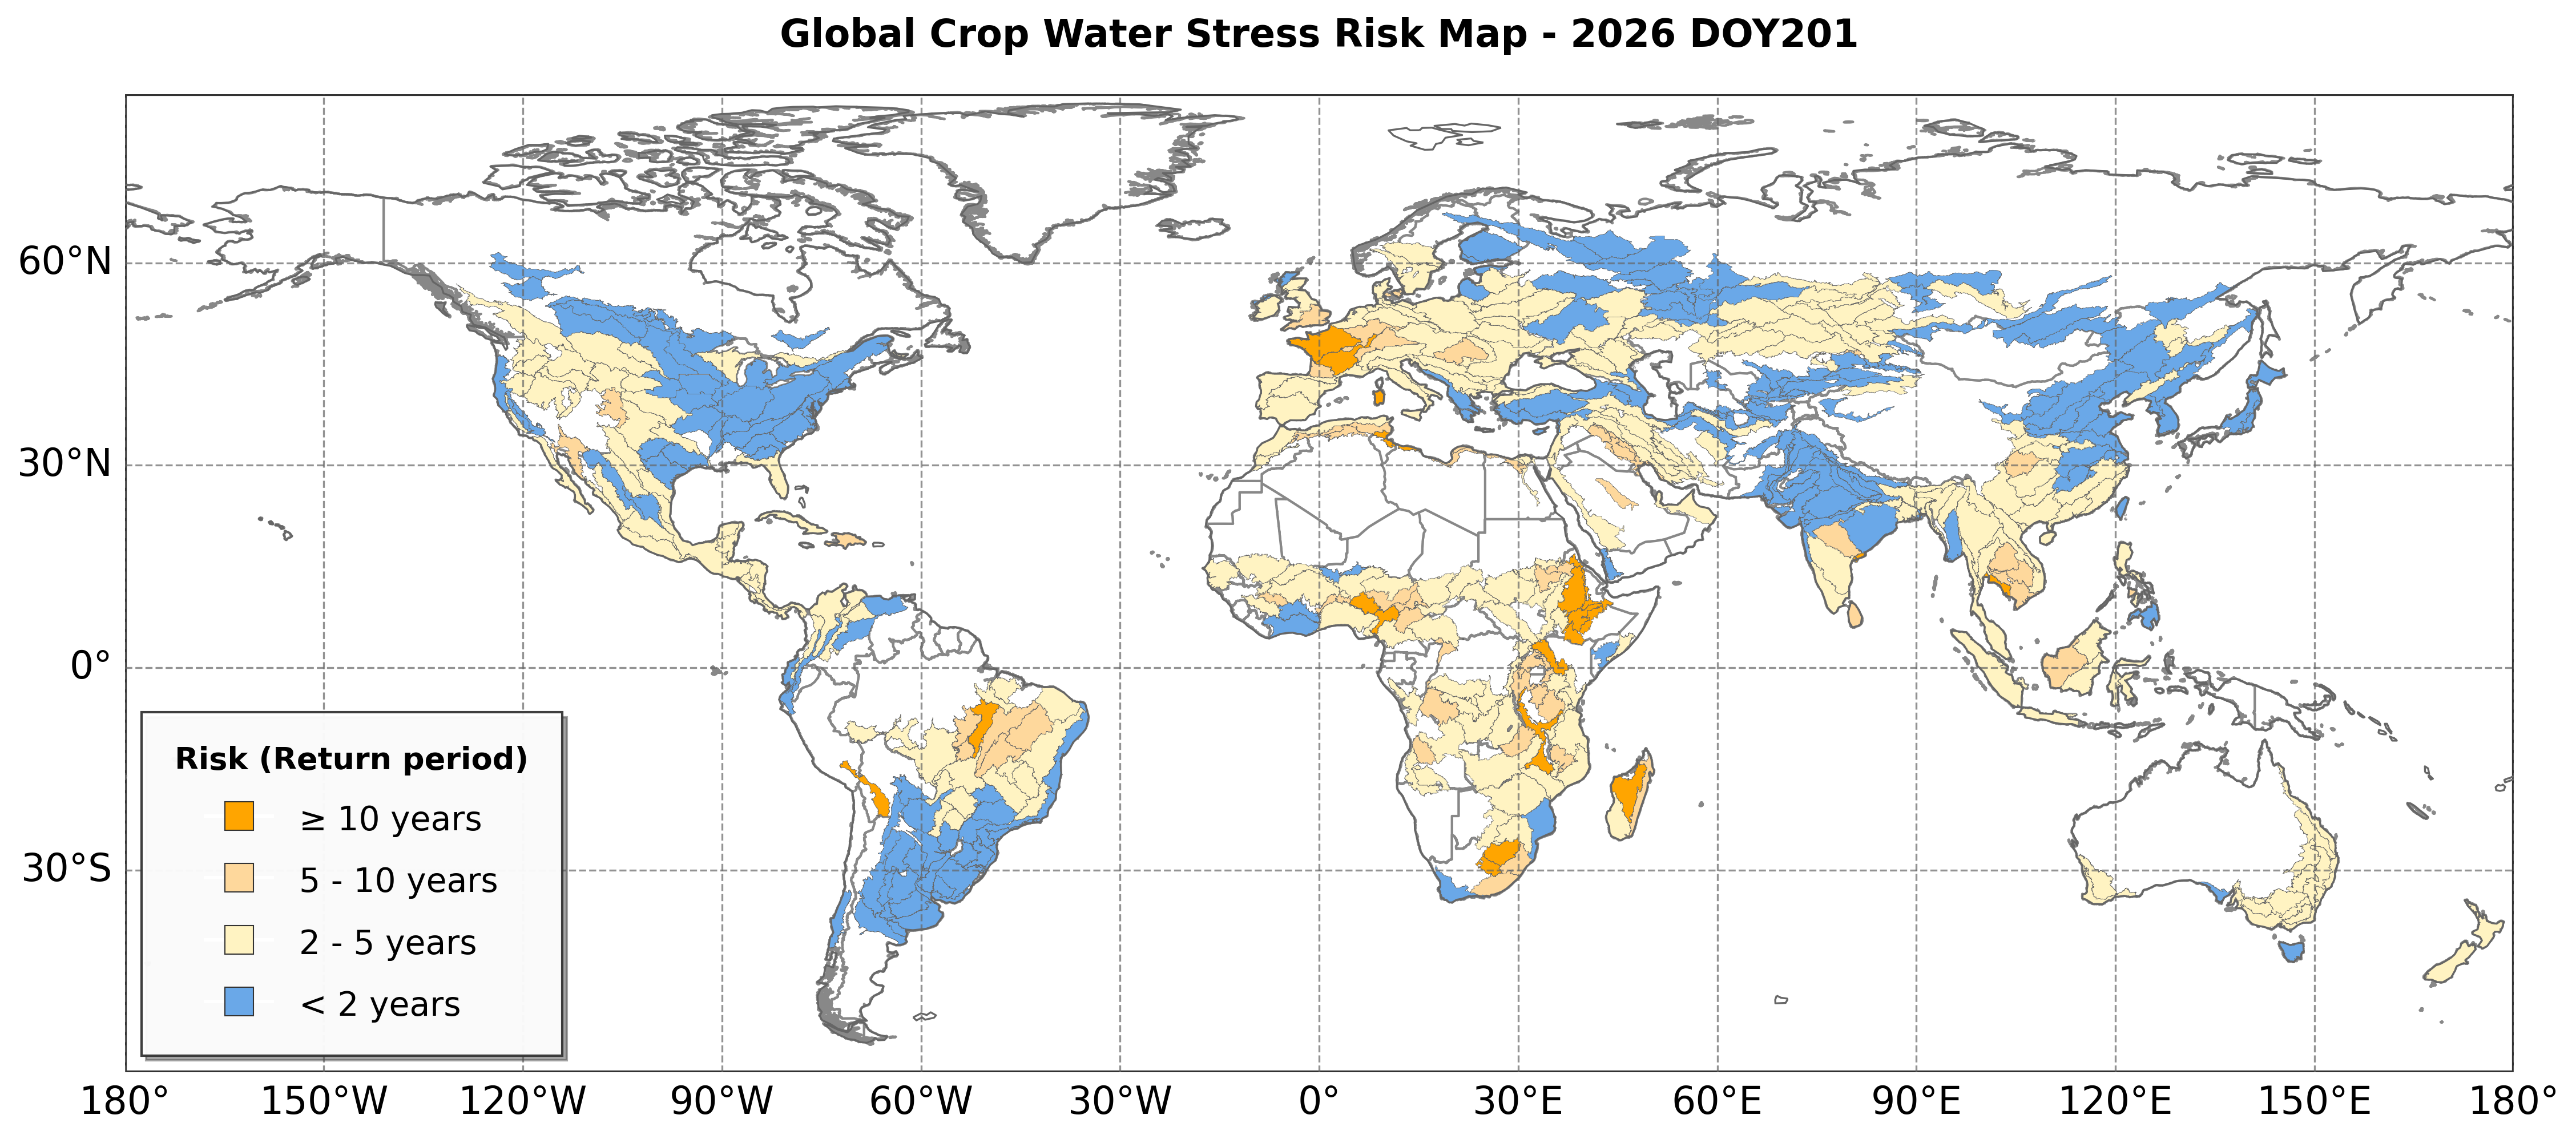
(a) 20–27 July 2026
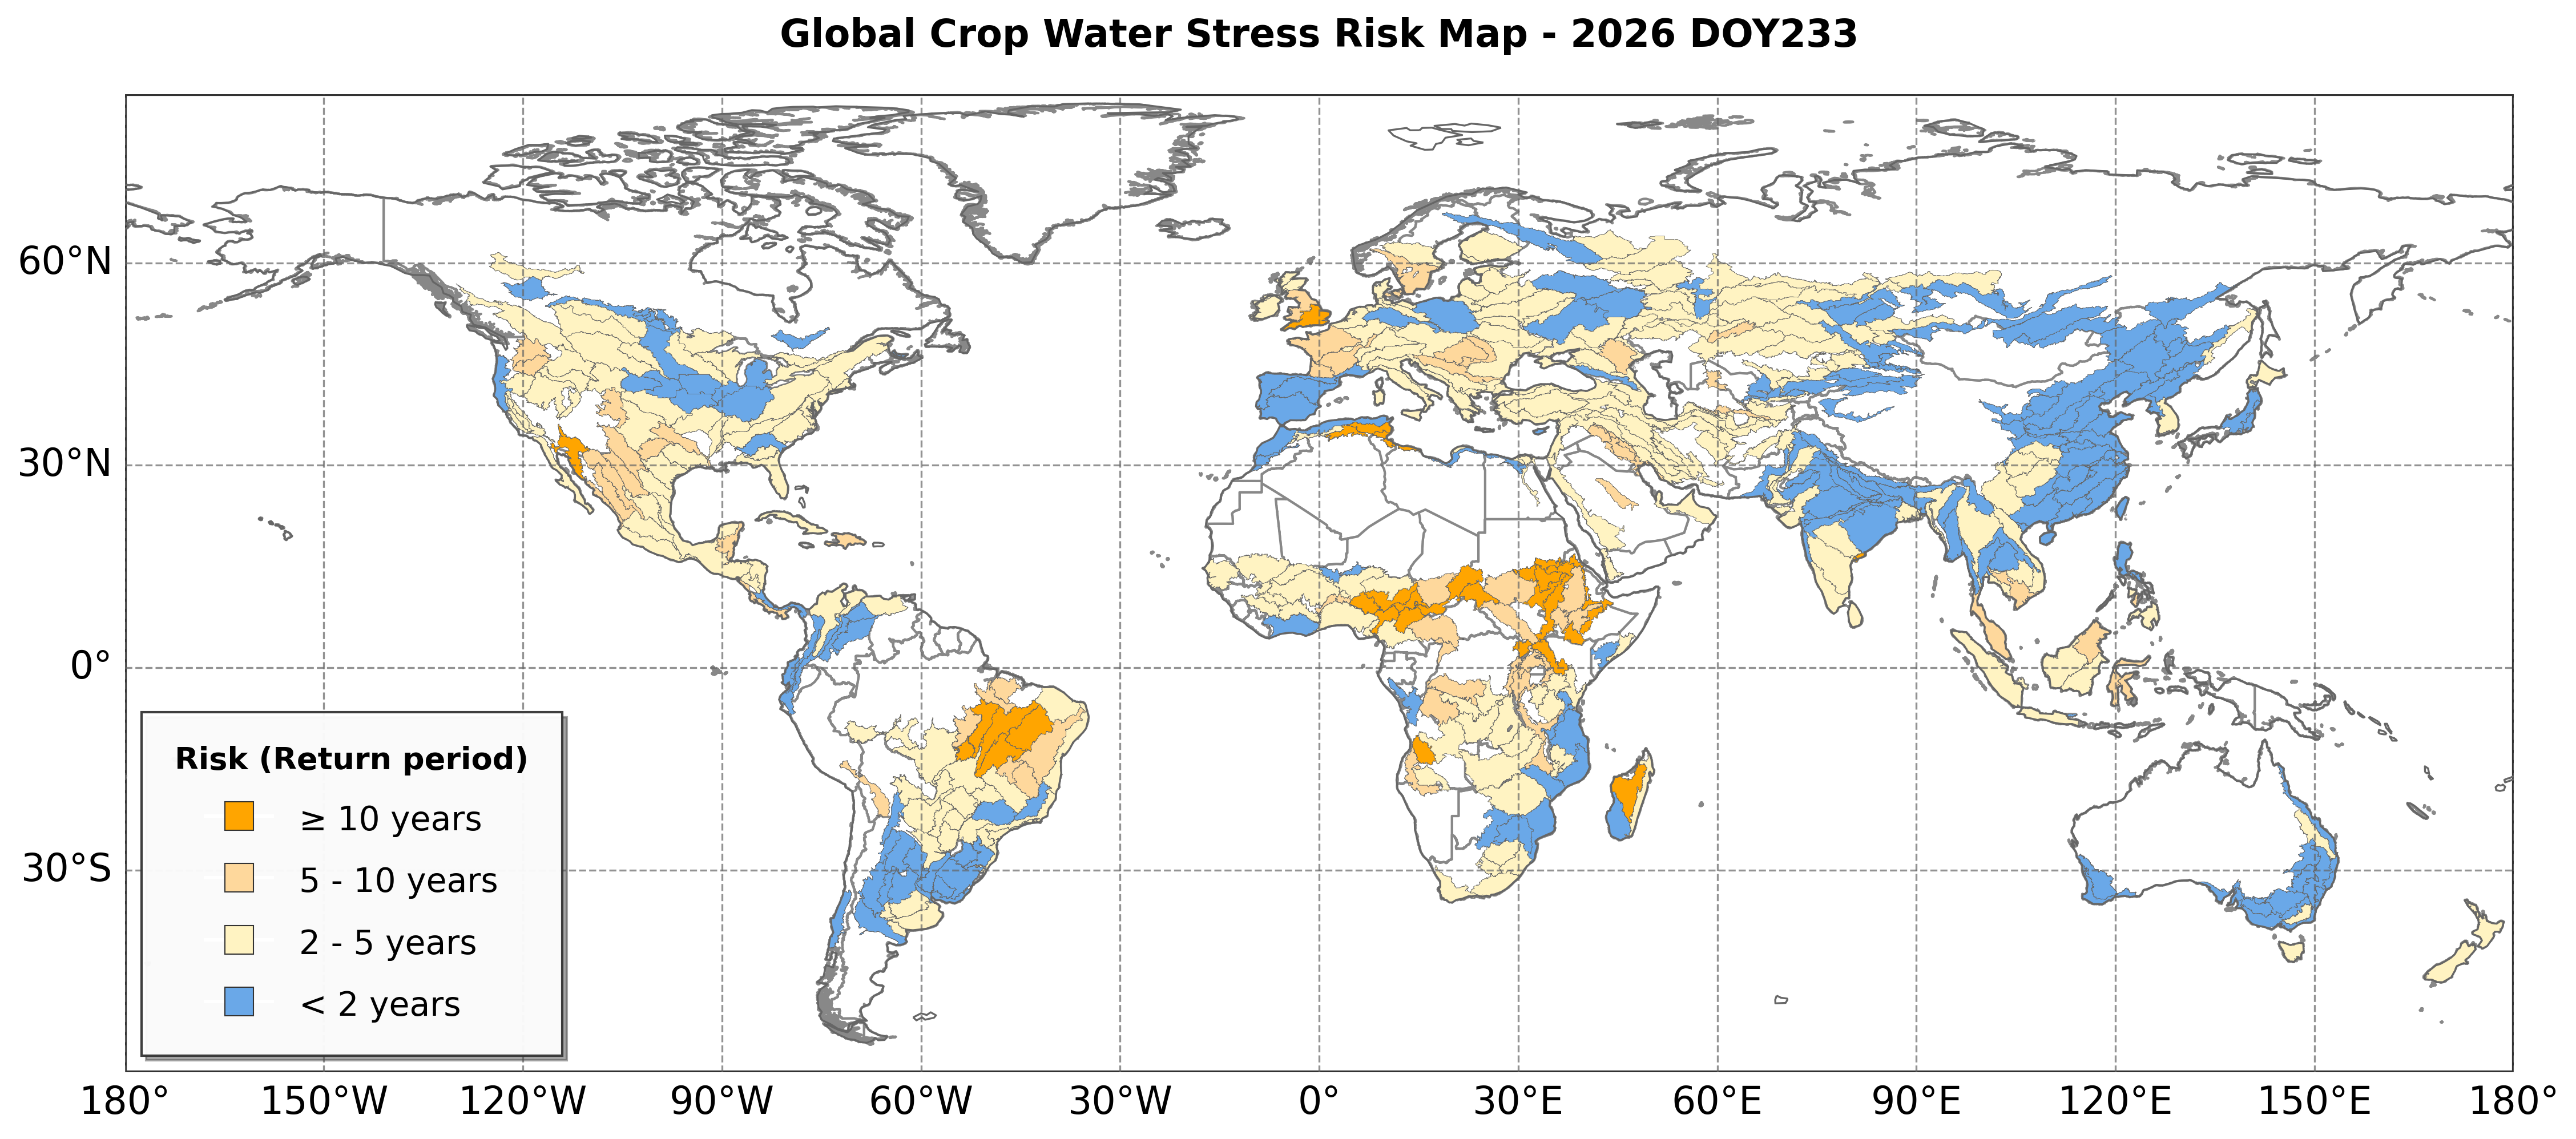
(b) 21–28 August 2026
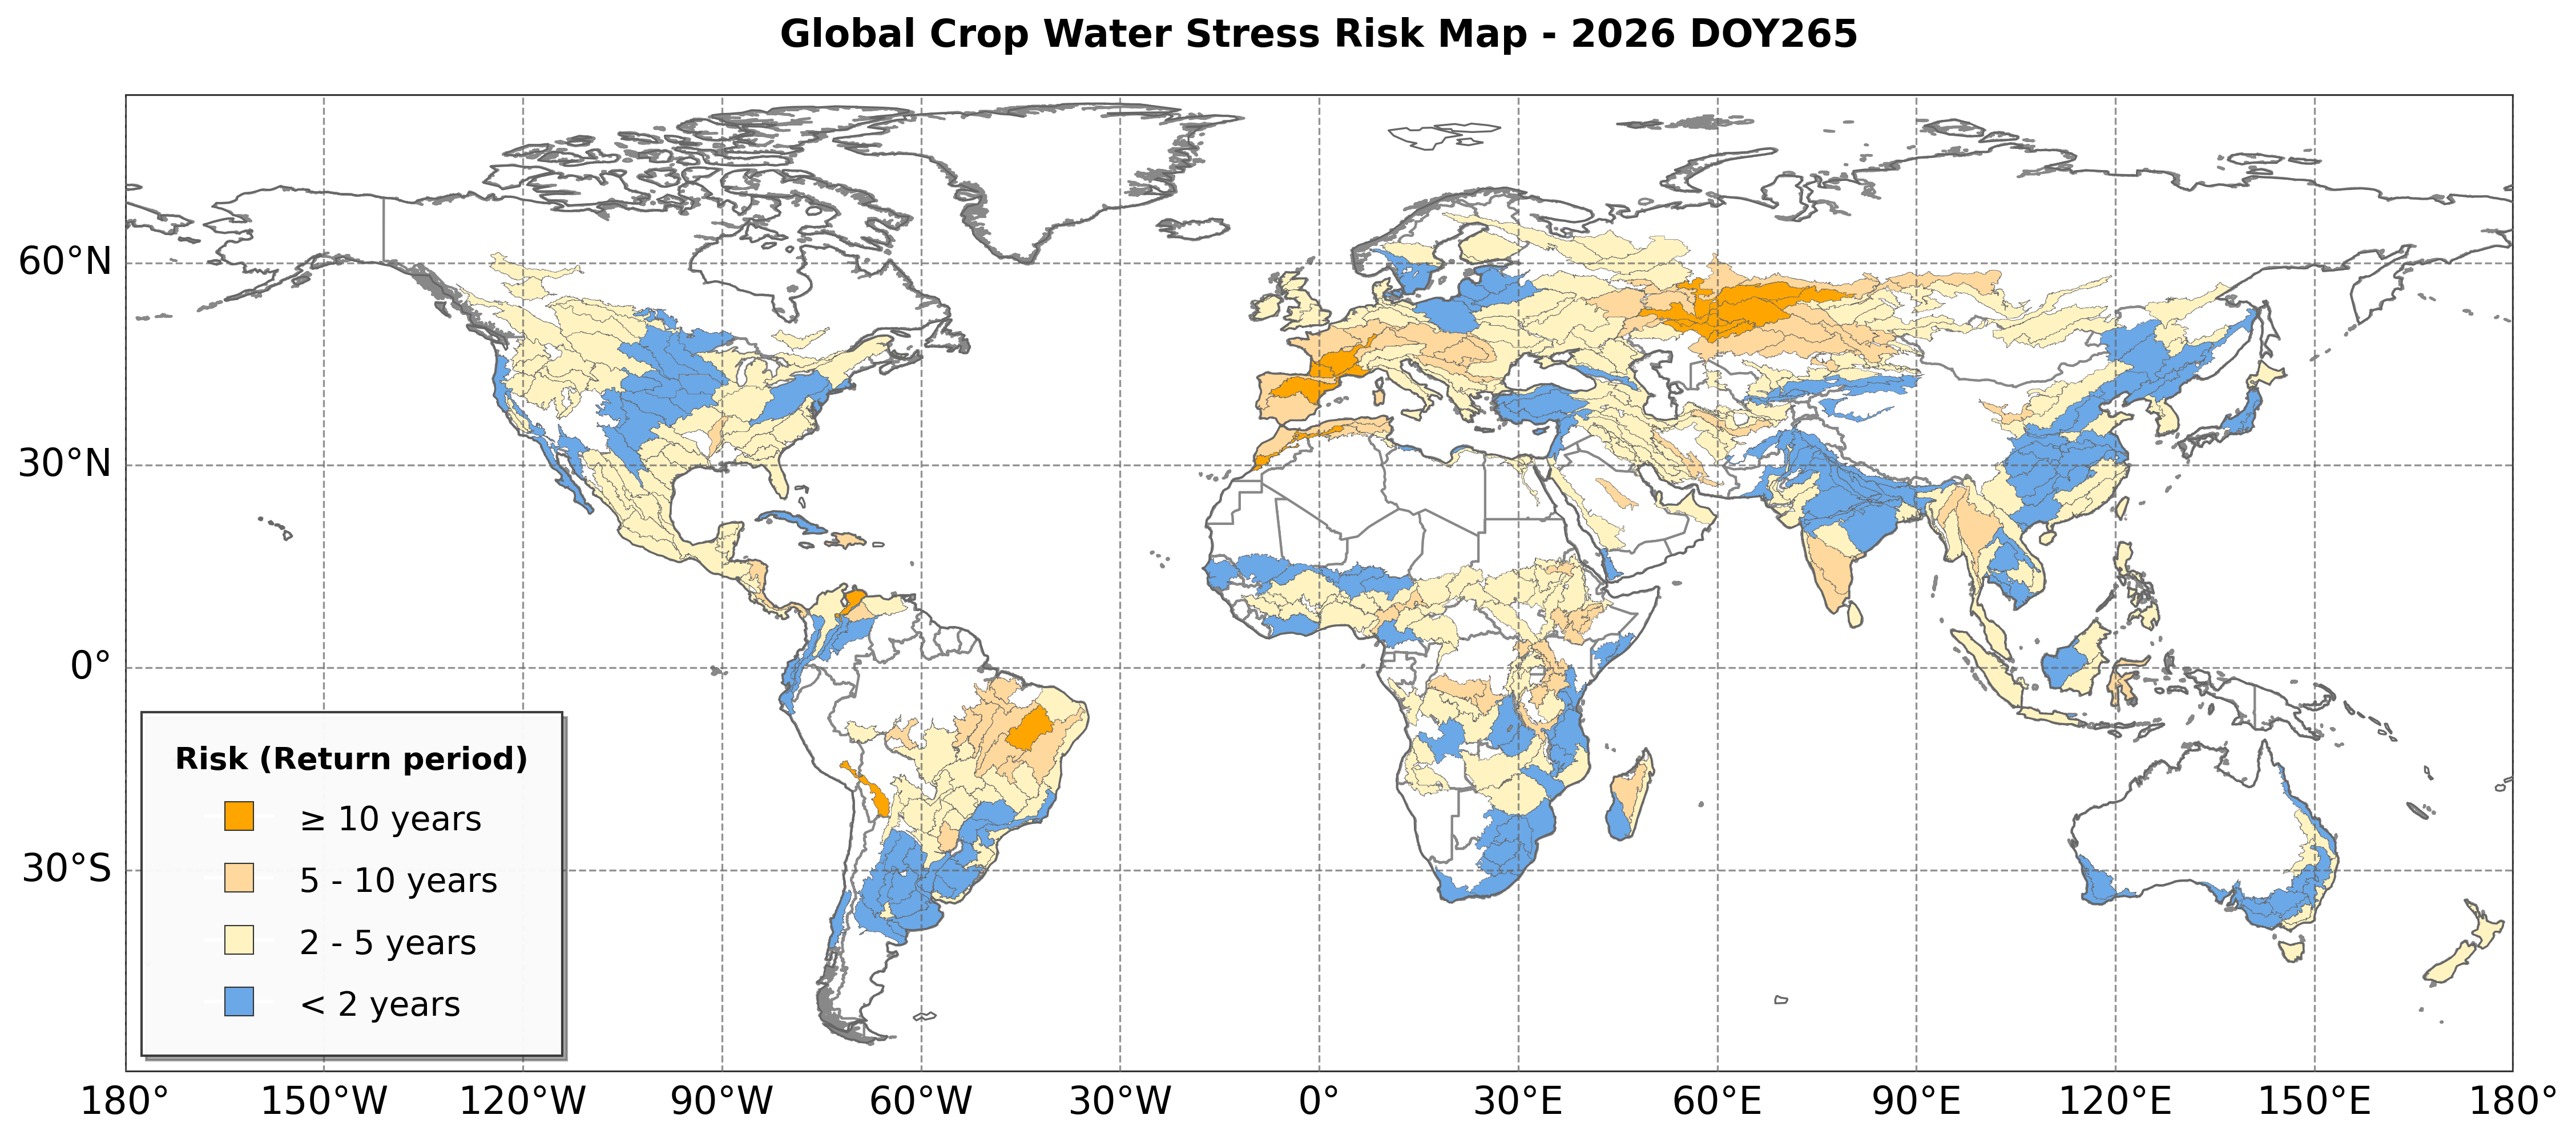
(c) 22–29 September 2026
Figure 1.6 Global agro-ecological zoning map of farmland water stress drought risk.
(2)Temperature Anomalies in Cropland since July 2026: Warming in the North, Cooling in the South
According to the WMO (8 October 2026), the ongoing El Niño is projected to strengthen until its December peak, raising the likelihood of above-average temperatures, altered precipitation regimes, and elevated drought and flood risks worldwide. CropWatch TCI monitoring shows that global cropland TCI fell from 41 in July to 29.18 by mid-to-late October 2026, indicating an overall warming trend relative to historical norms. Continental-scale temperature anomalies became increasingly divergent, exhibiting a north–south contrast: Europe experienced rare positive anomalies, while South America and Africa showed marked negative anomalies (Fig. 1.5a). In Week 41 (early-to-mid October 2026), warm anomalies were concentrated in the 30°N–50°N belt and parts of southwestern India; European TCI dropped to 6.33, Argentina was largely under cold anomalies, while South America and Africa recorded TCI values of 71.29 and 57.69, respectively (Fig. 1.7b).
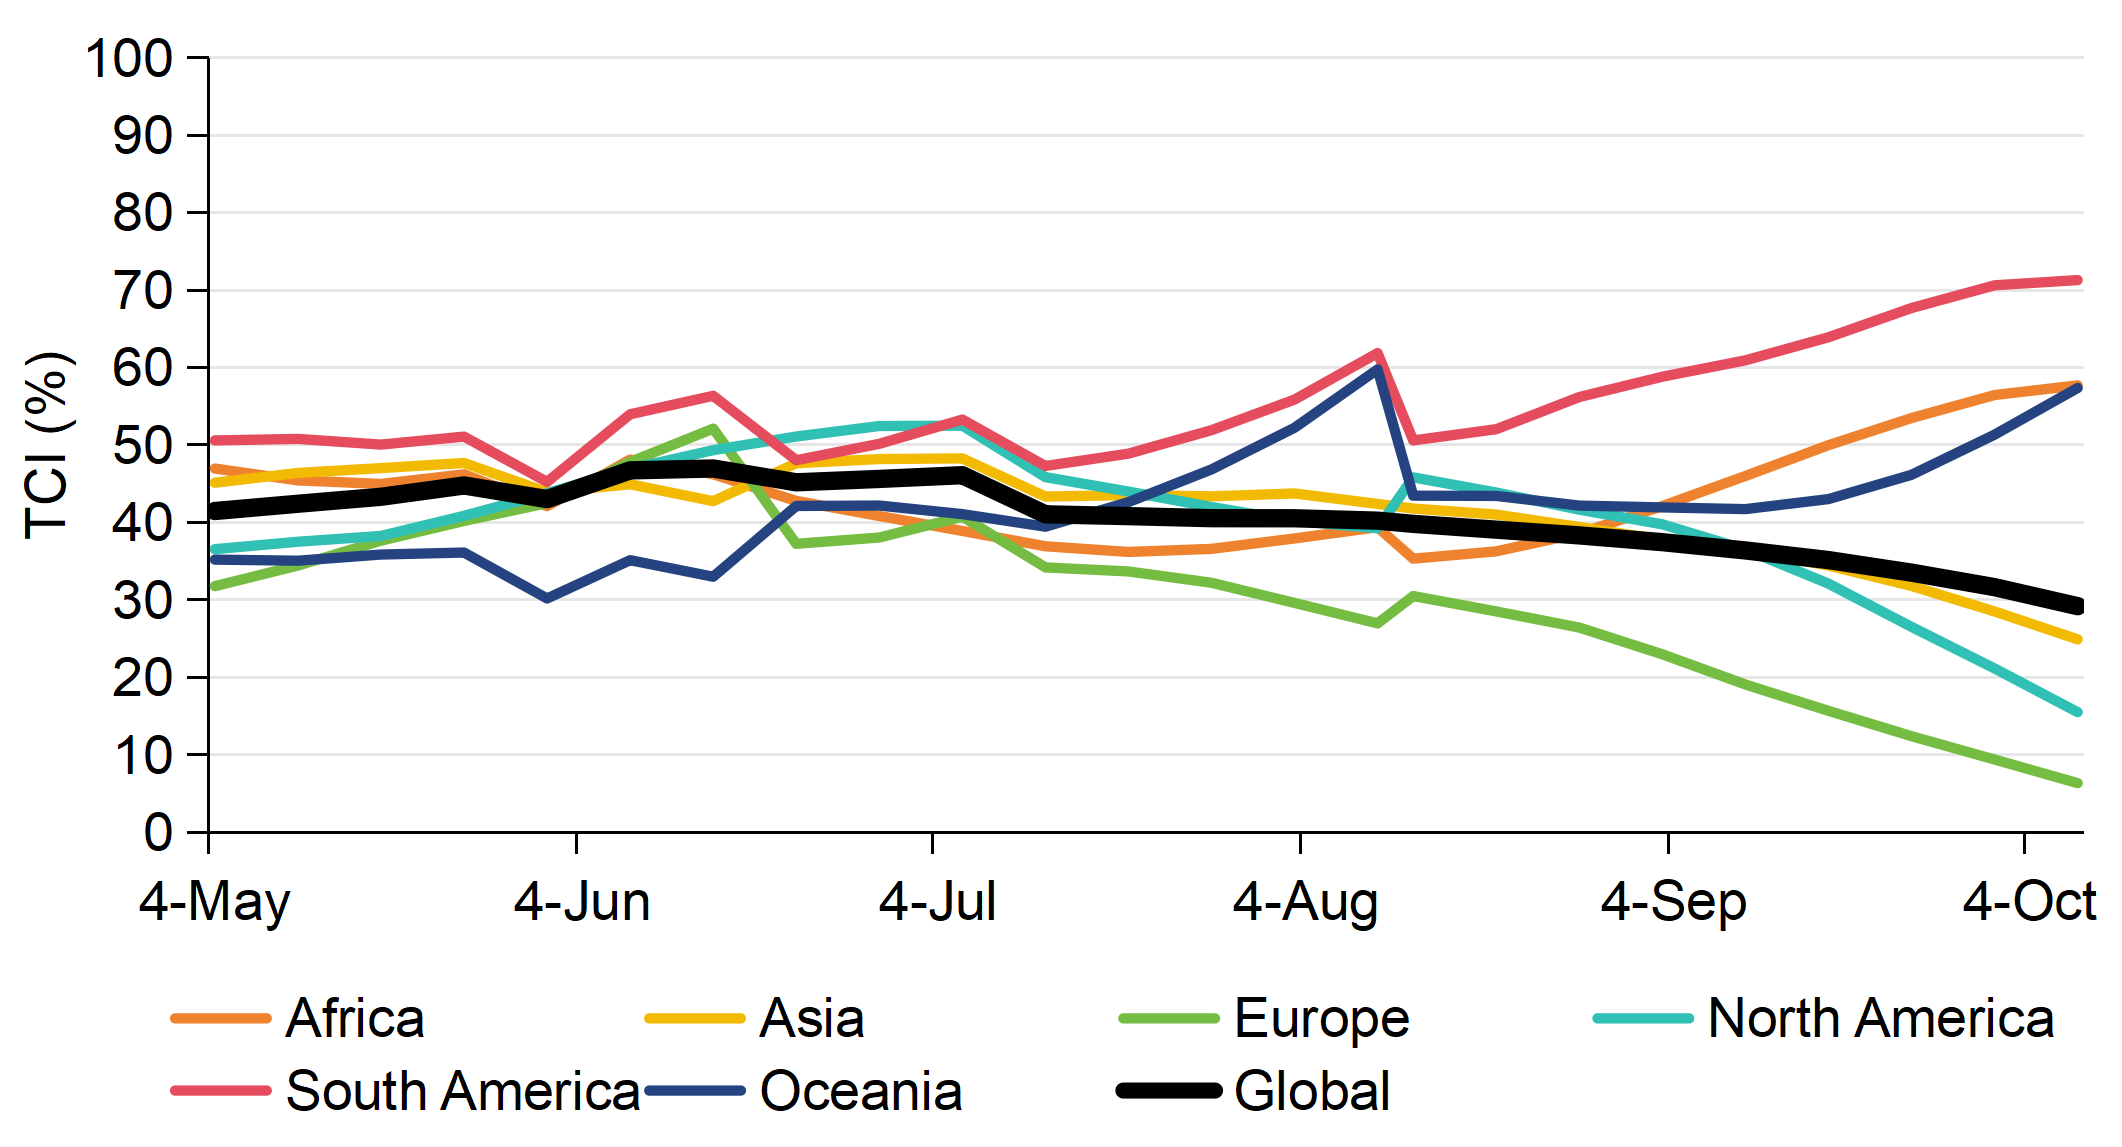
(a) Temporal series of TCI for global and continental farmland
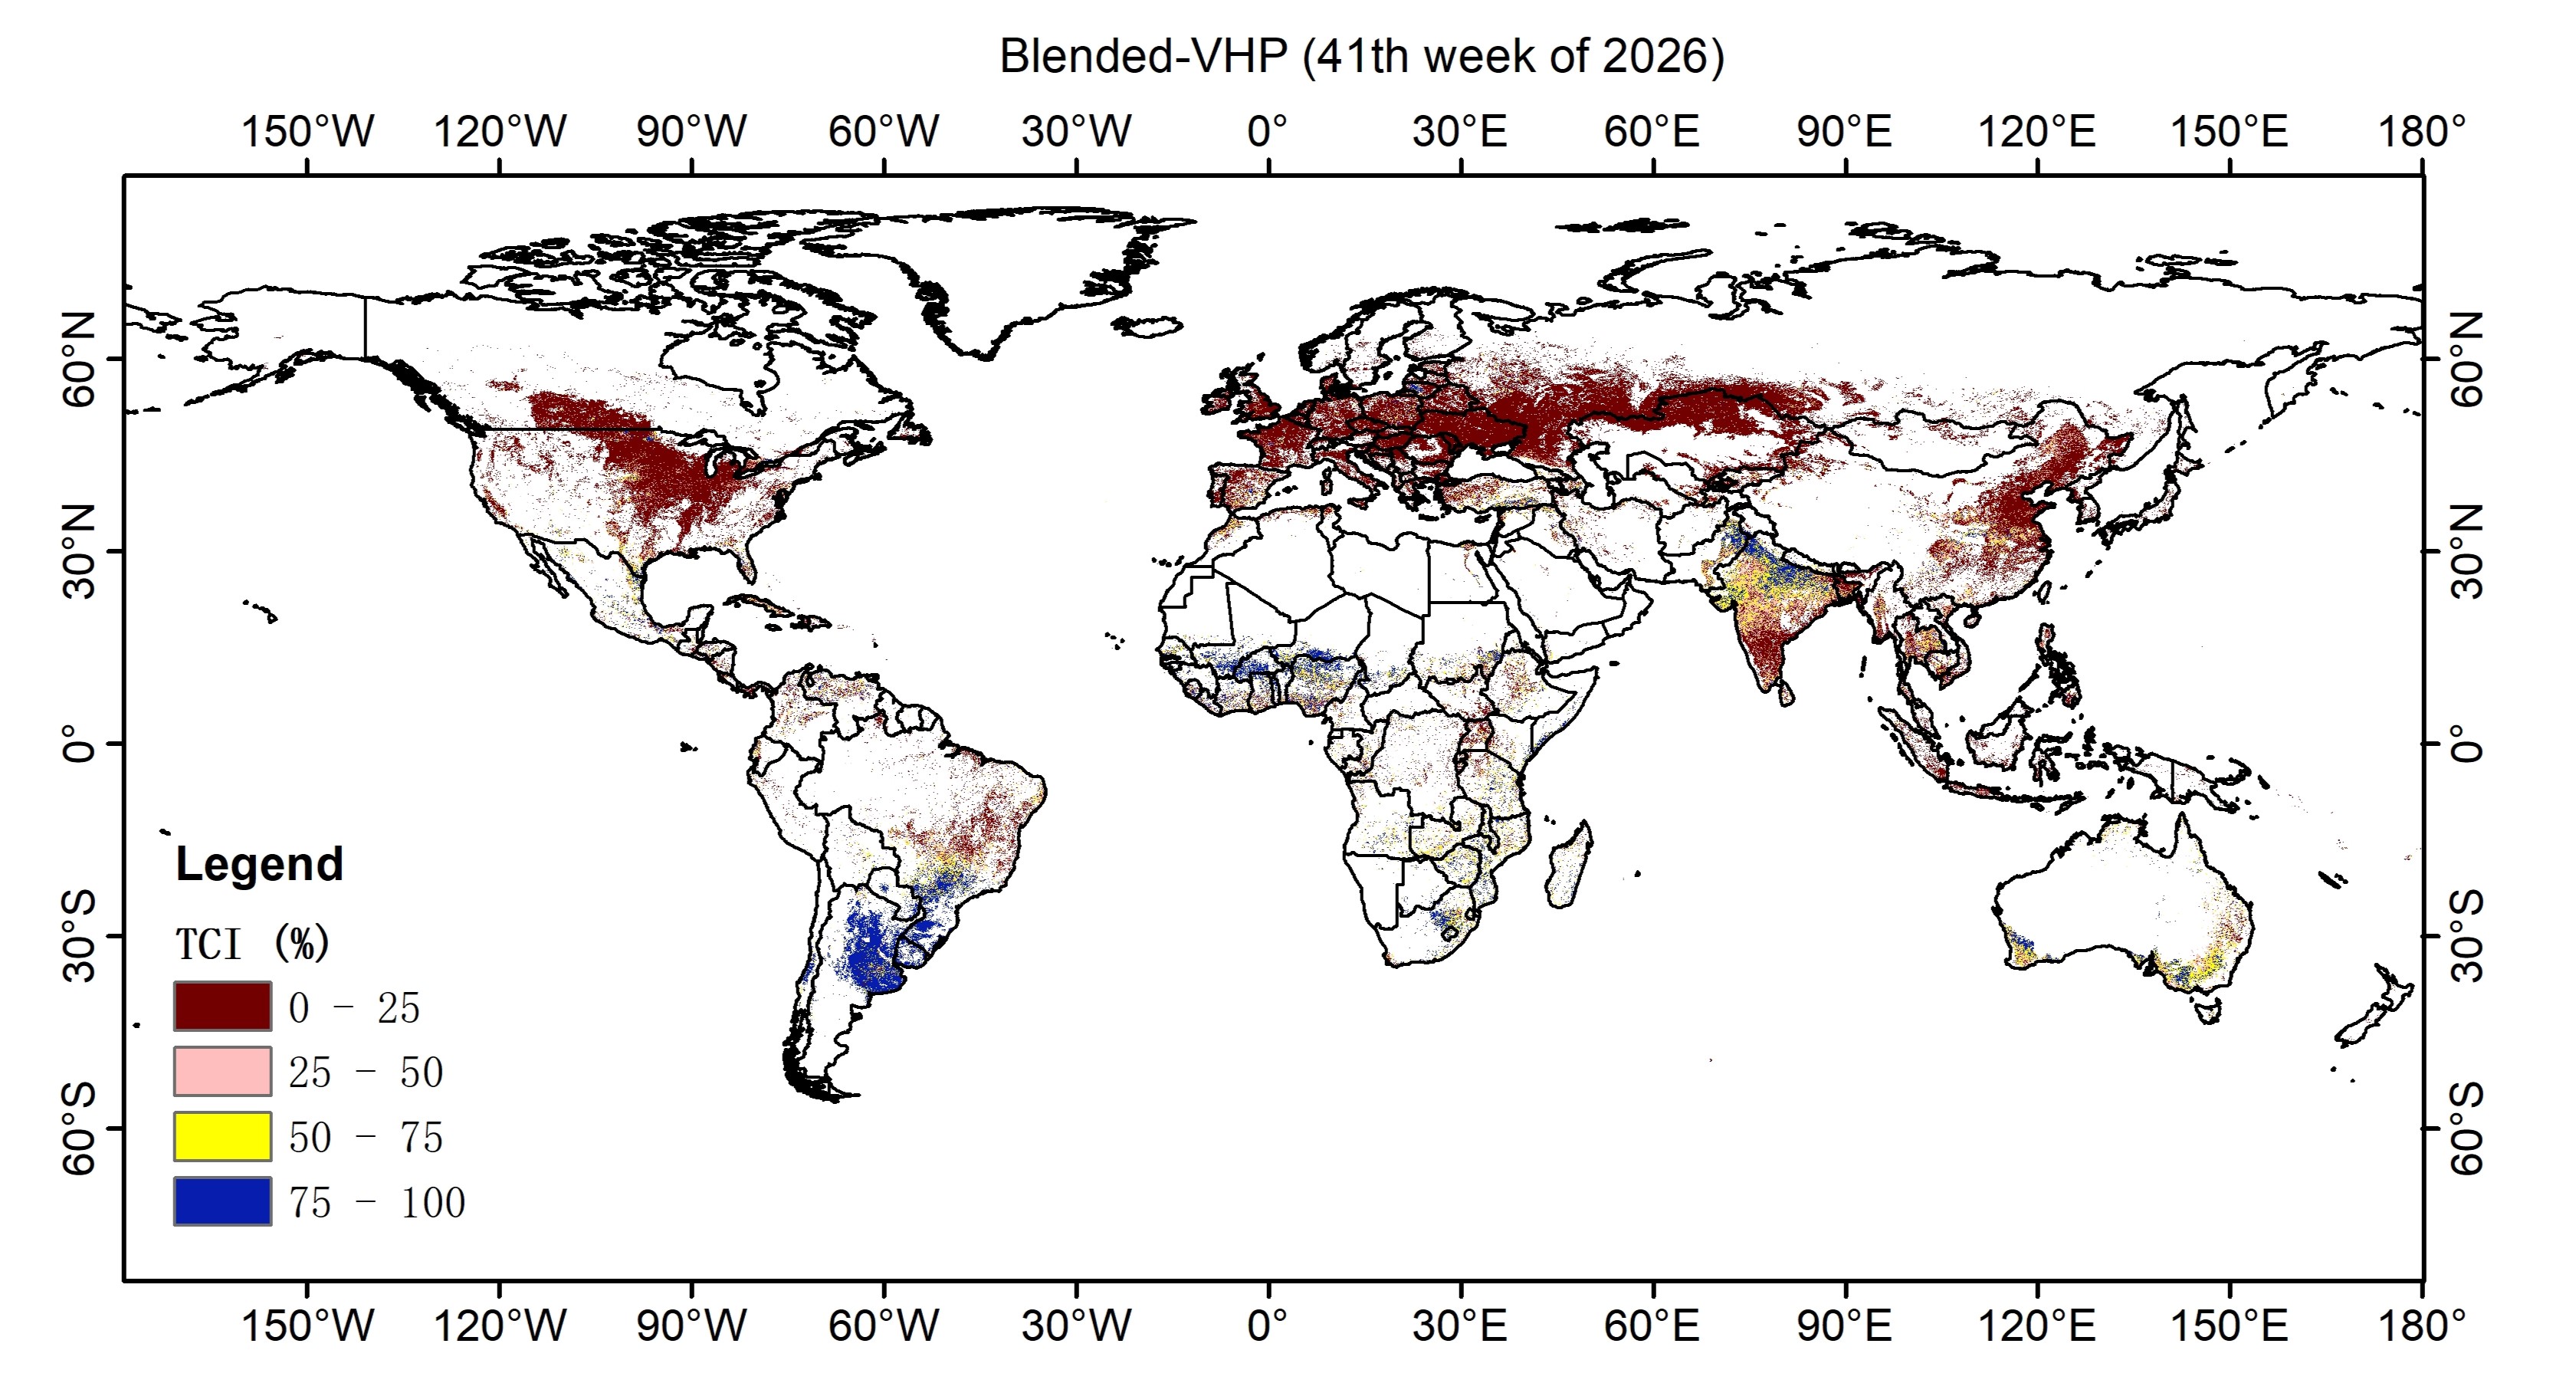
(b) Global farmland TCI during 5–11 October 2026
Figure 1.7 Global farmland vegetation temperature condition index (TCI)
(3)Europe Worsening, South America Mitigating over Next Three Months
Based on combined late-October short-range and November–December long-range numerical weather predictions, PDSI-based projections for October–December 2026 indicate that meteorological drought intensity over global rainfed farmland will further intensify amid continued high temperatures. Europe will face aggravated drought during the critical winter wheat sowing and emergence period, heightening risk. Conversely, drought is expected to ease in South America, Oceania, and southern and southeastern Asia, favoring crop growth. North America will exhibit a "dry north, moderate center" pattern, while Africa will show an "east easing, west worsening" pattern, with the Sahel experiencing intensified drought and sustained threats to agriculture and pastoralism (Fig. 1.8 / Fig. 1.9).
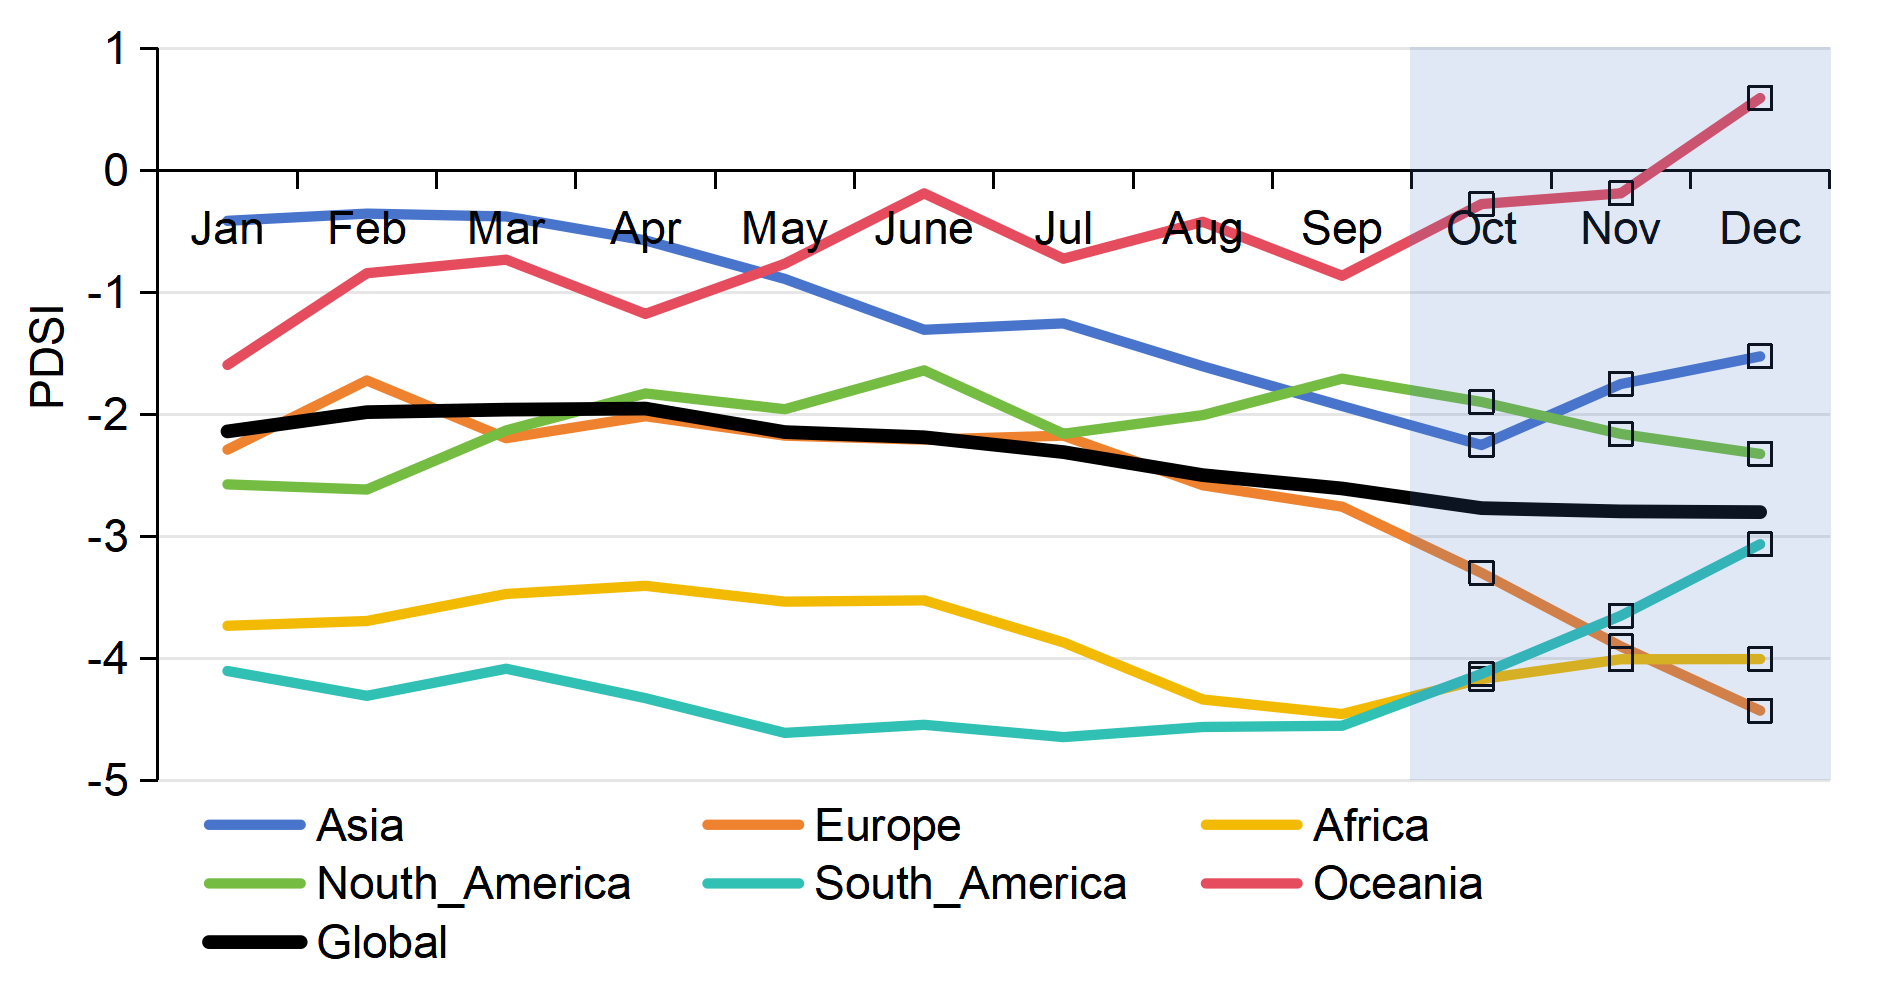
Figure 1.8 PDSI-based drought monitoring (Jan–Sep 2026) and forecast (Oct–Dec 2026) for rainfed agricultural zones across global continents.
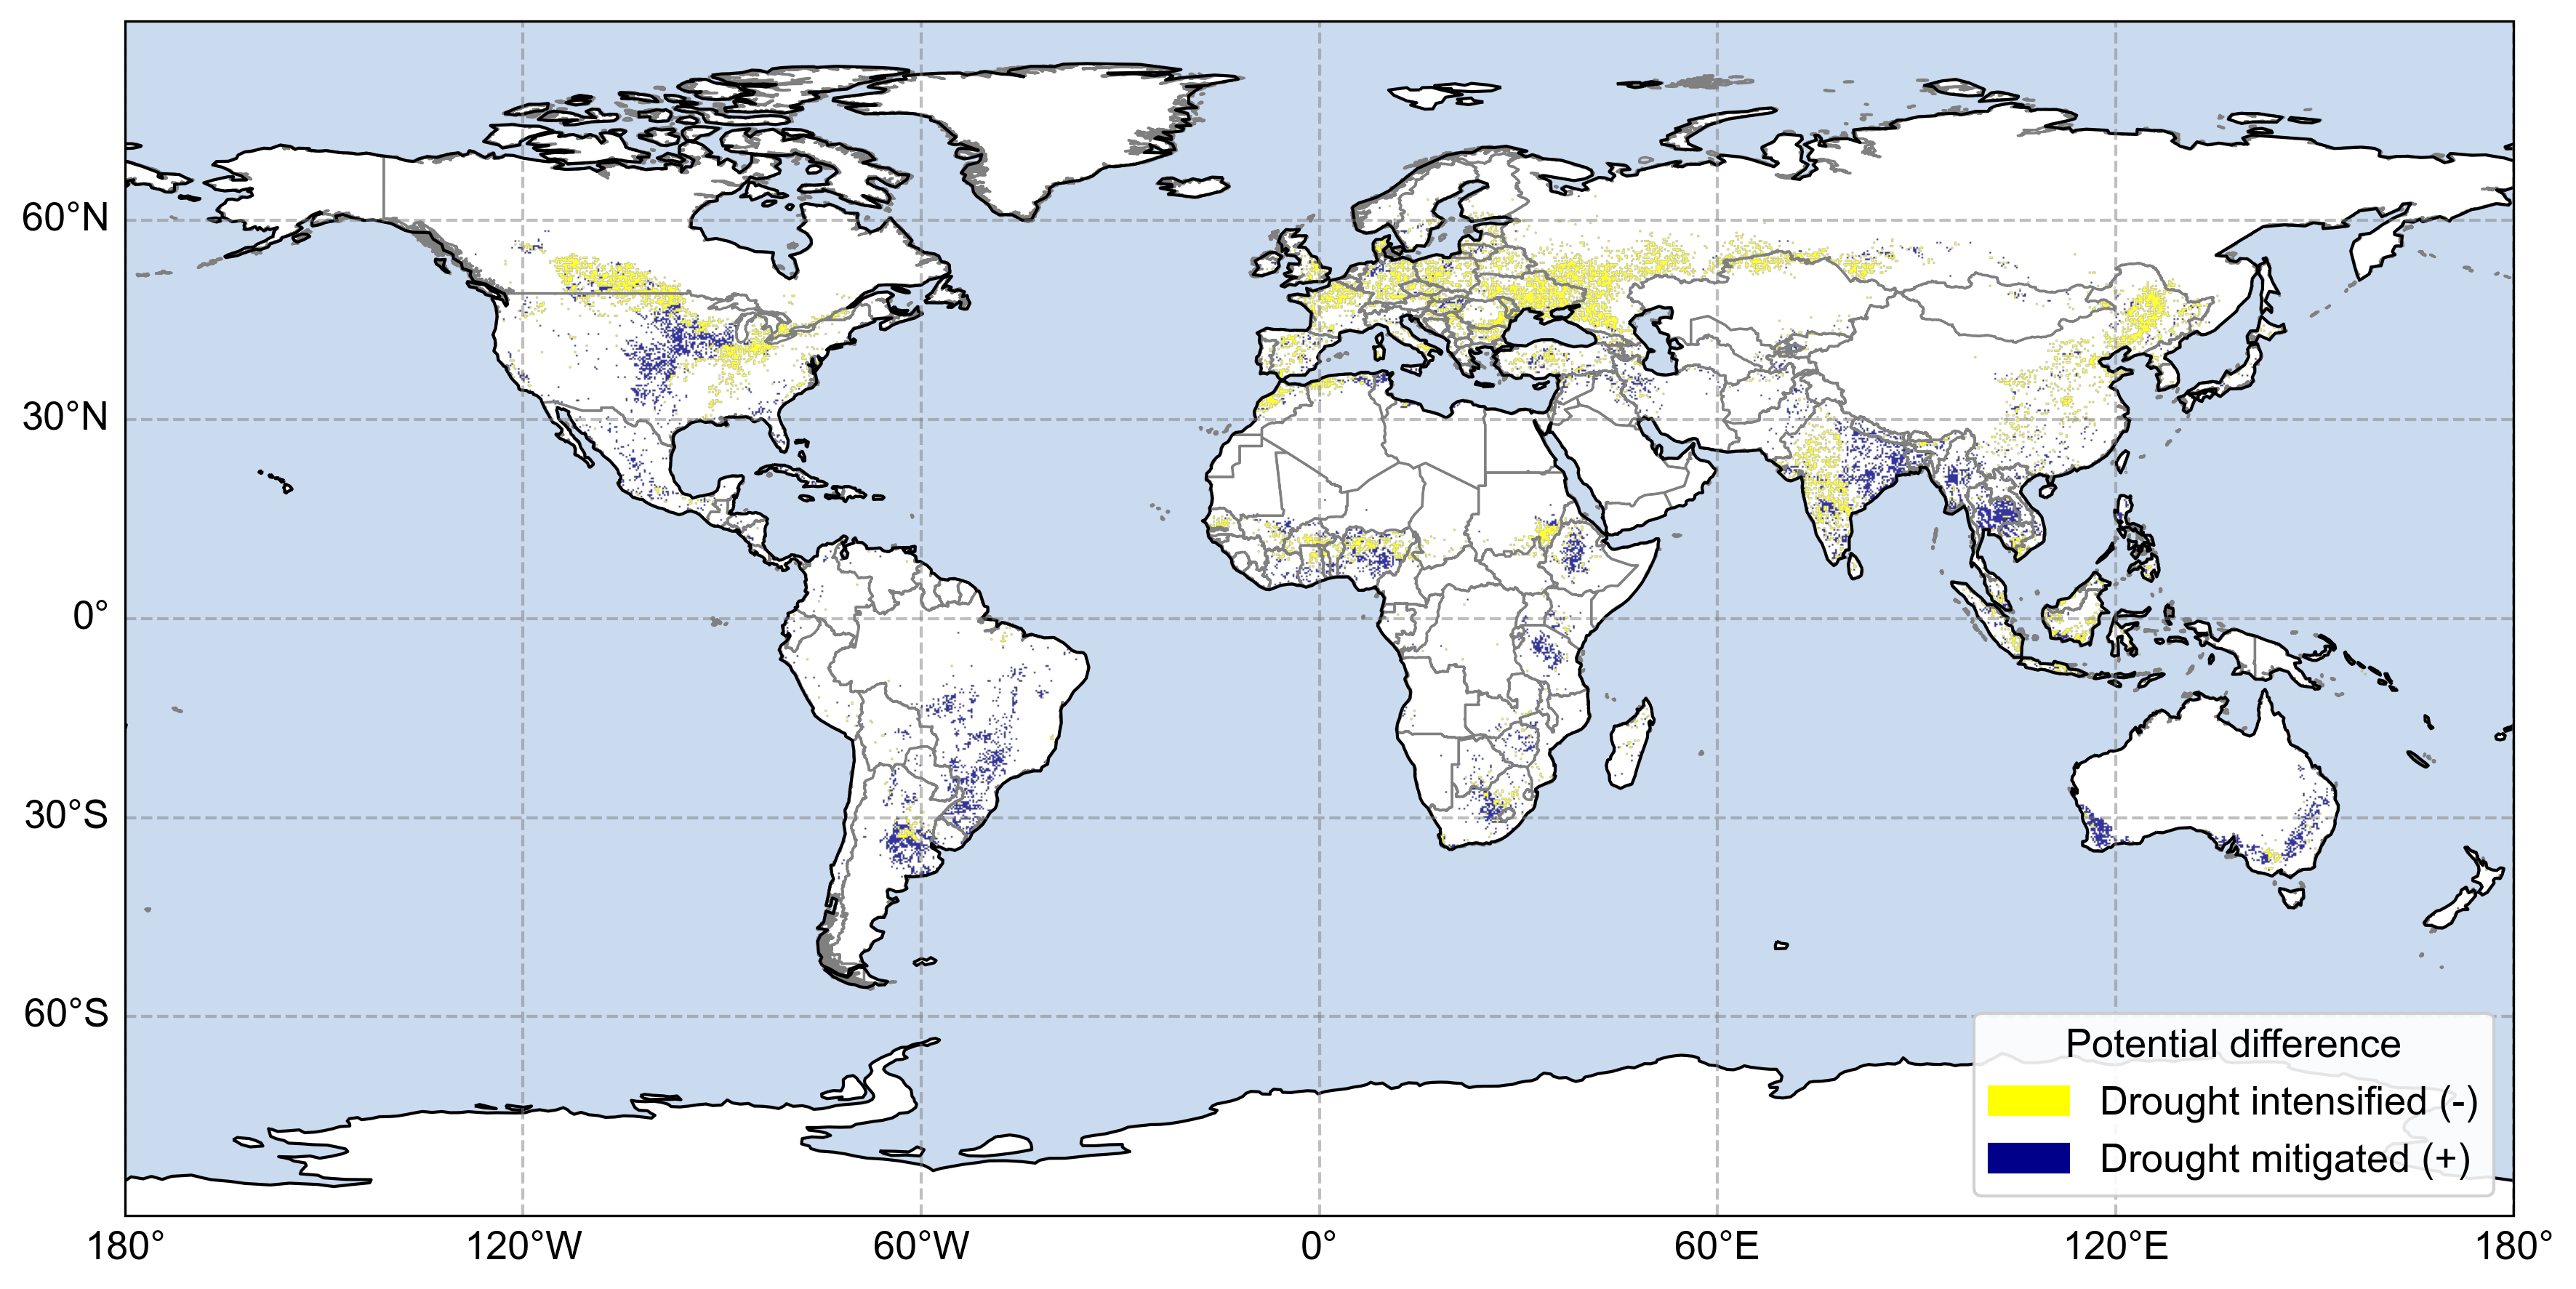
Figure 1.9 Predicted difference in the Palmer Drought Severity Index (PDSI) between October–December 2026 and July–September 2026.
(4) CropWatch ENSO 2026/27 – Global Agricultural Risk Summary
El Niño 2026/27 continues to strengthen and is expected to remain in strong to very strong conditions through early 2027. CropWatch’s phenology aligned ENSO exposure analysis shows that the most significant impacts will occur where ENSO anomalies coincide with the growth stages of major cereals. The six ENSO impact maps (Figure 1.10 a–f ) included in this bulletin summarize the spatial distribution of negative impacts (red) and positive impacts (blue) for maize, rice, and wheat across both the full crop cycle and the reproductive phase.
Maize (Figure 1.10 a&b): Negative ENSO impacts dominate key maize-producing regions in North America, Central and Eastern Europe, China, and Central Asia, where heat and moisture deficits overlap with the growth phase (June–September). Positive conditions are observed in South Asia, West Africa, and tropical Brazil. In Central America, El Niño has already produced prolonged drought and an extended canícula, posing a serious threat to Postrera maize planting (August–September) and increasing the likelihood of poor establishment and reduced yields.
Rice (Figure 1.10 c&d): Strong negative anomalies affect China, Central Asia, and Europe, coinciding with heading and flowering (July–August). Positive anomalies dominate South Asia, West Africa, and parts of South America, supporting favorable moisture conditions during August–October.
Wheat (Figure 1.10 e&f): Negative impacts are widespread across China, Central Asia, Europe, and North America during the wheat growth phase (May–June). In the Southern Hemisphere, Argentina/Paraguay show increased risk during September–October, while Australia faces strong negative anomalies during August–September.
CropWatch Forward-Looking Assessment
CropWatch’s internal ENSO exposure modeling indicates elevated risk for:
· Maize in Southern Africa, Central America, Northeast Brazil, India, China, Central Asia, Europe, and North America.
· Rice in South Asia, Southeast Asia, China, Central Asia, and Europe.
· Wheat in Australia, Southern Africa, Argentina/Paraguay, and parts of East Asia and Europe.
Potentially favorable conditions may emerge in Central Asia, southeastern South America, and eastern East Africa, where persistent anomalies could support crop development.
The 2026/27 El Niño is developing under record global and oceanic temperatures, increasing the likelihood of atypical teleconnections and more intense hydrometeorological extremes. These conditions may amplify agricultural vulnerability and introduce uncertainty into traditional ENSO impact patterns.

Figure 1.10 Global ENSO-related impact patterns for maize, rice, and wheat during the 2026/27 season. Panels (a, c and e) show crop-cycle impacts, while panels (b, d and f) show reproductive-phase impacts. Red areas indicate regions where El Niño is associated with negative stress signals—such as heat anomalies, moisture deficits, or reduced evapotranspiration efficiency—while blue areas indicate regions with positive or mitigating effects.