
 English
 中文

Bulletin
CropWatch bulletinMenu
Authors: MH18174088459 | Edit: qinxl
During the monitoring period (July–September), influenced by the continuing El Niño event, Australia's cumulative precipitation was 16% below average, the average temperature was 0.7°C above average, photosynthetically active radiation (PAR) was 6% below average, and potential biomass accumulation (BIOMSS) was 11% below average.
The Cropped Arable Land Fraction (CALF) nationwide was 94%, the maximum Vegetation Condition Index (VCI) was 0.91, and the Crop Production Index (CroPI) was 1.12. Due to below-average precipitation and above-average temperatures, the national Palmer Drought Severity Index (PDSI) stood at -0.95, and the Crop Water Stress Index (CWSI) rose to 1.81. Water stress was particularly significant in the southwestern wheat-growing region and the sub-humid/sub-tropical region, where local soil moisture was overdrawn, exerting adverse constraints on wheat from the stem elongation to grain-filling stages.
Affected by the combined impacts of a pre-season reduction in planting scale and severe subsequent drought stress, Australia's winter wheat production generally maintained a weak pattern in 2026. According to the latest CropWatch monitoring results, this year's wheat planting area is 11,717 thousand hectares, a decrease of 5.06% compared to last year; the national average yield is projected at 2,329 kg/ha, down slightly by 0.27% year-on-year; and due to the dual effect of contracting planting area and a minor drop in yield, this year's total winter wheat production is forecasted to be 27.285 million tonnes, a reduction of 5.31% compared to last year.
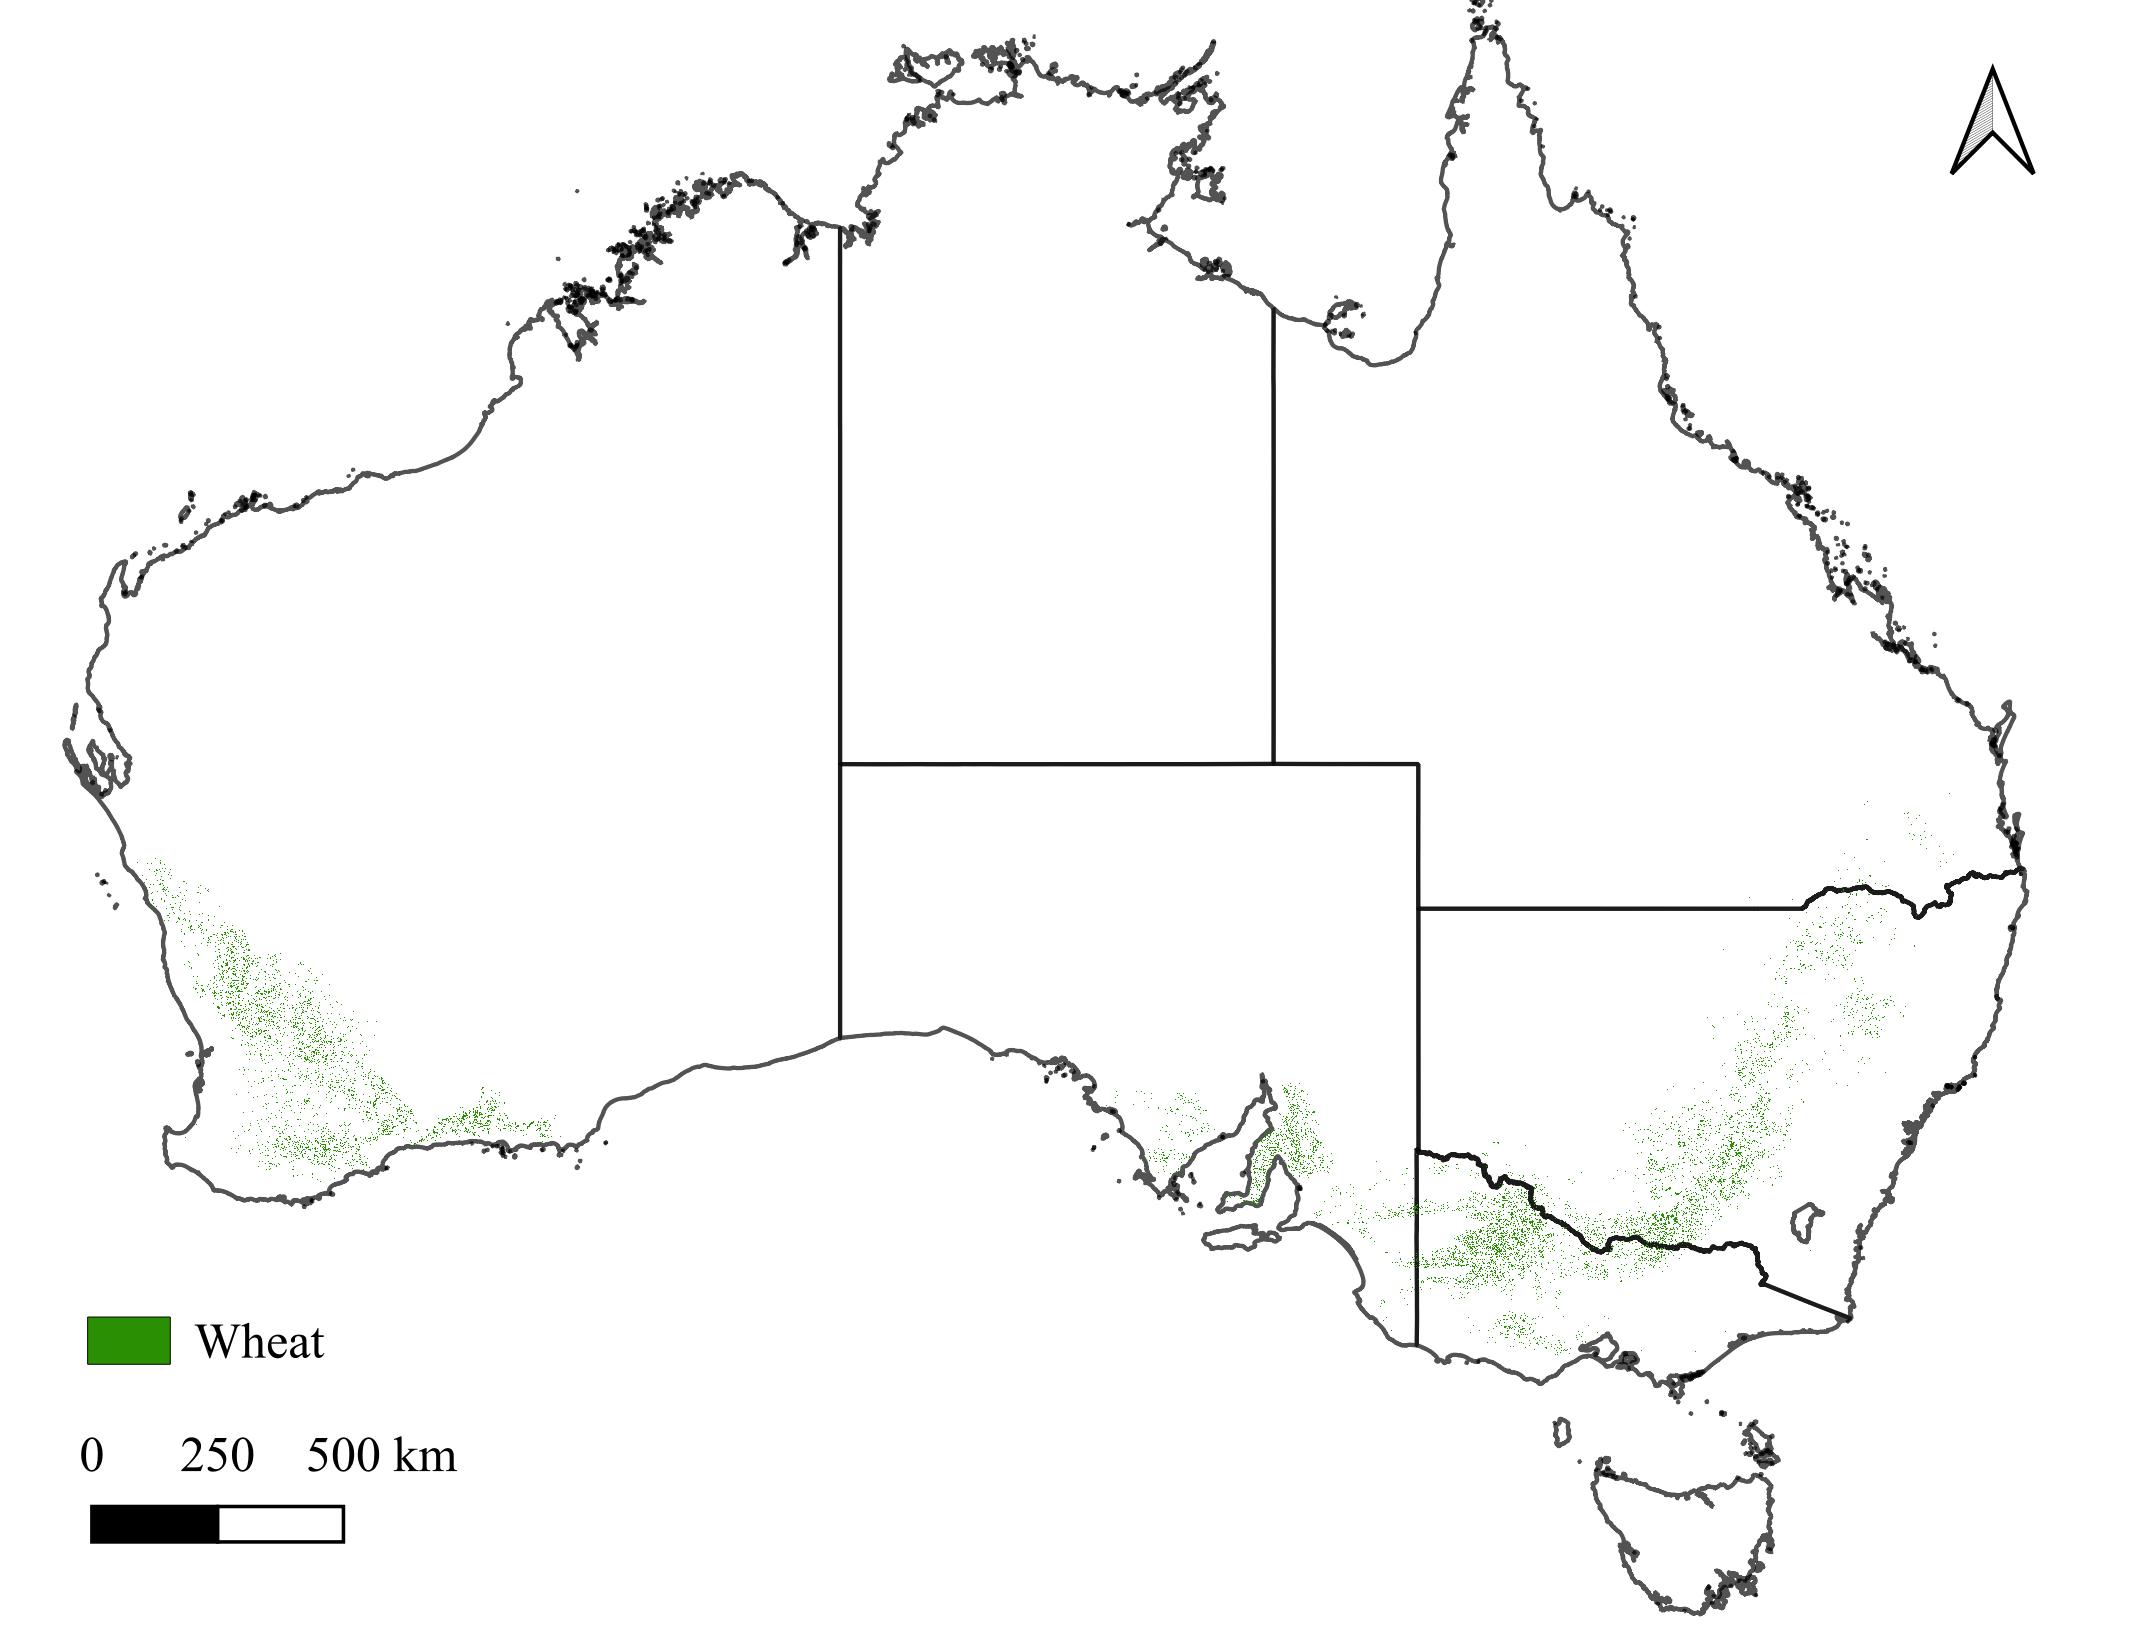
Figure 2.2 Distribution of Wheat in Australia in 2026
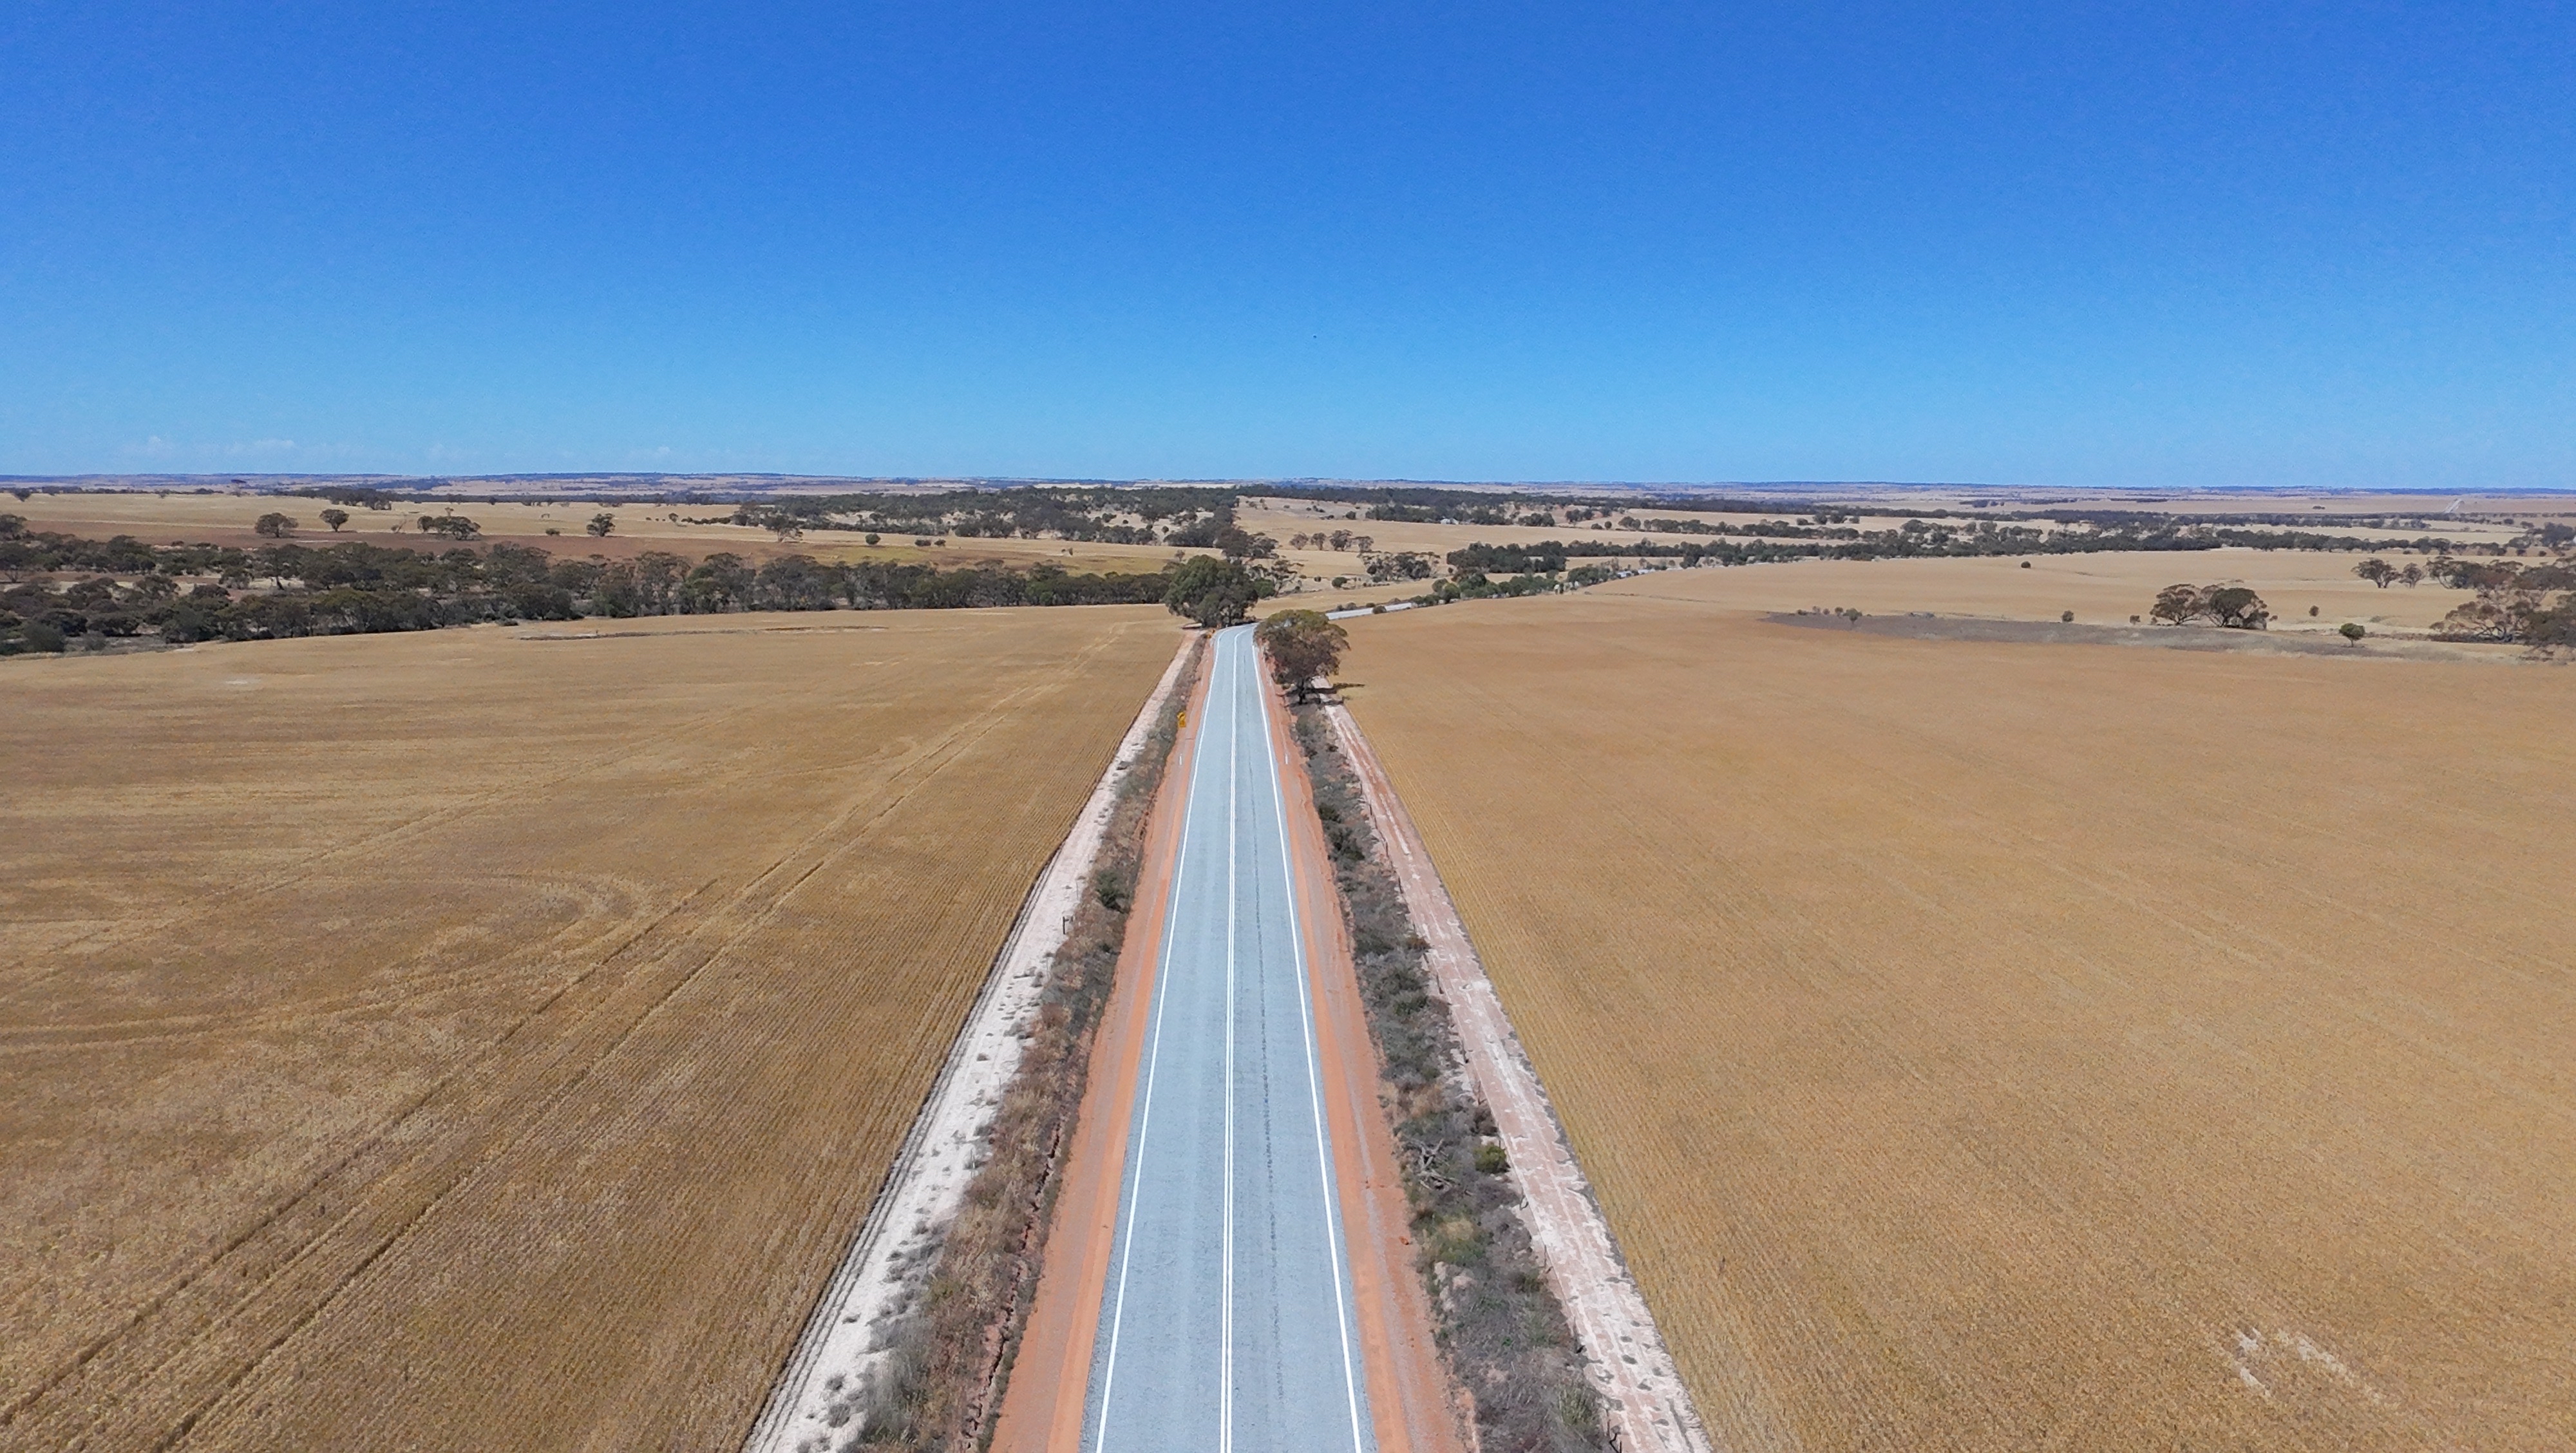
Figure 2.3 October 2026 Drone Imagery (Cereal crops)
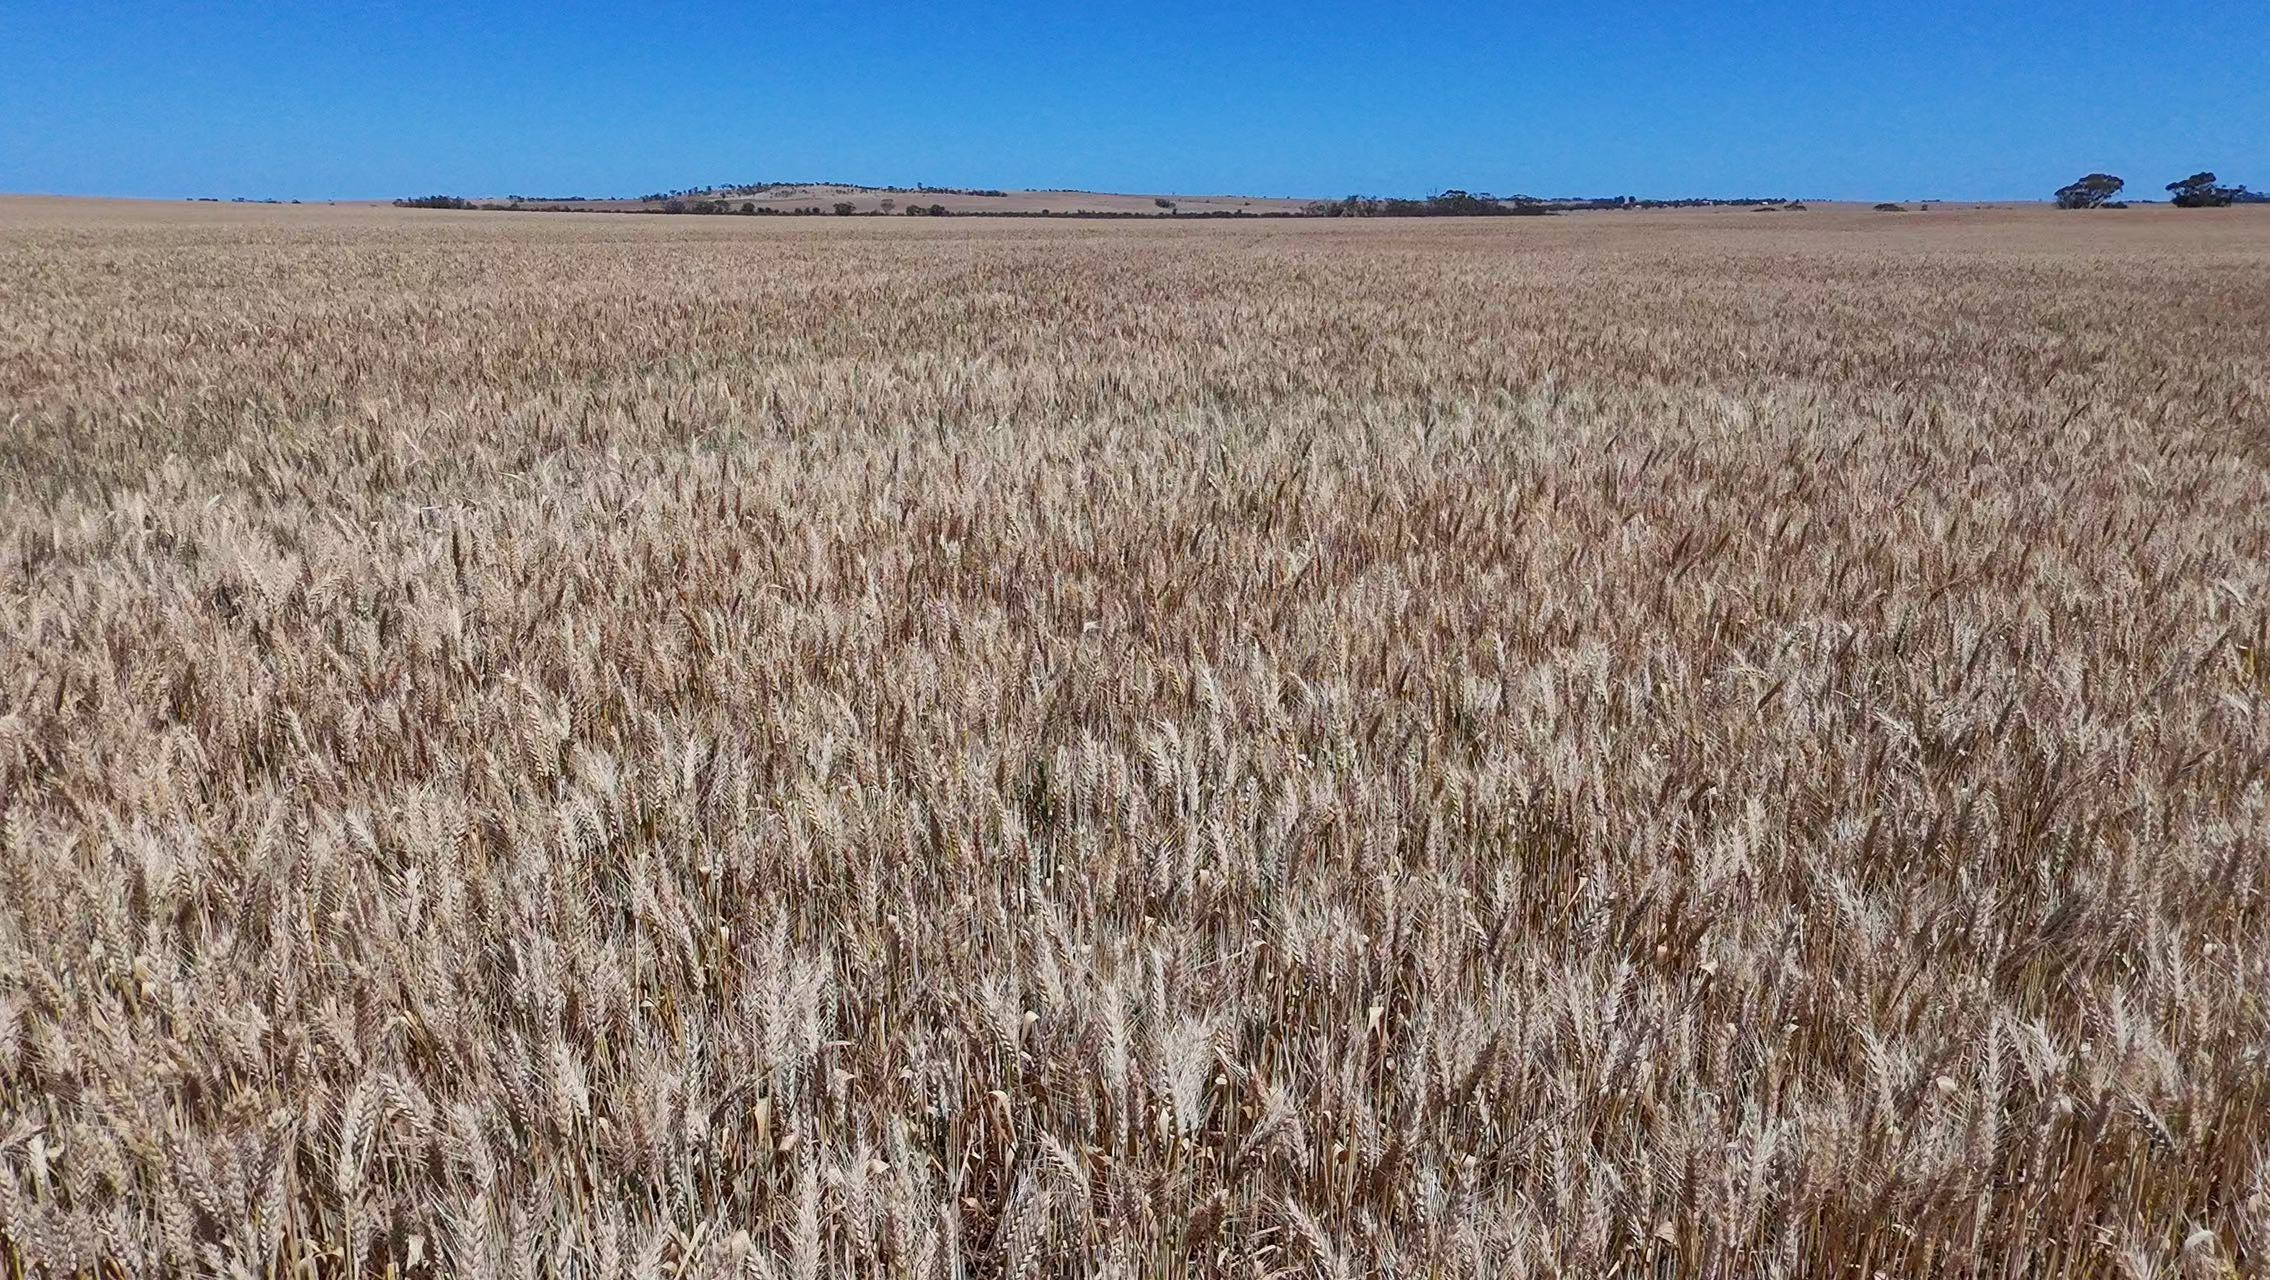
Figure 2.4 October 2026 Drone Imagery (wheat)