
 English
 中文

Bulletin
CropWatch bulletinMenu
Authors: Miao,limengxiao,MH18174088459,lirui,chentianle | Edit: qinxl
Using multi-source remote sensing data as of mid-October from Fengyun meteorological satellites, ESA Sentinel-1/2 satellites, and US Landsat-8/9 satellites, combined with agrometeorological information and crop yield monitoring models, CropWatch conducted a re-assessment of the yield and output of major grain and oil crops in China. The revised estimates indicate that national grain production in 2026 showed an overall moderate growth trend, with both autumn grain production and annual grain production increasing year-on-year. Remote sensing monitoring indicates that national autumn grain production in 2026 is estimated at 507.74 million tonnes, up about 1.0% year-on-year, and annual grain production is estimated at 685.05 million tons, also up about 1.0%. In terms of the structure of the increase, autumn grain, as the main component of annual grain production, remained the most critical contributor to the annual increase; optimized planting structures and field management in some areas contributed to steady increases in both autumn grain yield and production.
In 2026, the regional distribution of grain production showed a pattern of “declines in the Northeast and production gains across several provinces in the Southwest and Northwest.” North China and the provinces along the middle and lower reaches of the Yangtze River showed pronounced production increases and became the main sources of the national increase. Henan's autumn grain production reached 22.89 million tons, up 5.4% year-on-year, and its annual grain production reached 62.41 million tons, up 2.7%, contributing notably to the increase among major producing provinces. Shandong's autumn grain production was 17.78 million tons (-5.5%), but its annual grain production reached 46.74 million tons, up 2.3% year-on-year, showing a structural pattern of weak autumn grain production but a recovery in annual grain production. Shanxi's autumn grain production was 10.03 million tons, up 7.1%, and its annual grain production increased by 4.7%, providing a degree of regional support. Jiangsu's autumn grain production was 20.69 million tons, up 7.6%, and its annual grain production was 34.59 million tons, up 6.6%; both autumn grain production and annual grain production recorded strong growth, indicating relatively light disturbance from adverse weather during critical growth stages and more favorable overall production conditions. Anhui's autumn grain production was 20.88 million tons, up 3.8%, but due to fluctuations in summer grain and early rice production, its annual grain production was 36.20 million tons, down 1.8% year-on-year. Hubei's autumn grain production was 25.81 million tons, up 2.7%, and its annual grain production was 32.76 million tons, up 5.2%. Hunan's autumn grain production and annual grain production increased by 2.7% and 2.1%, respectively; Jiangxi's autumn grain production increased by 2.2% and annual grain production by 1.8%. The middle Yangtze region as a whole maintained a stable-to-positive trend.
The Northeast continued to play a prominent "ballast" role in national grain supply, but its growth momentum in 2026 slowed markedly compared with the previous year, and some provinces experienced output declines. Heilongjiang's annual grain production was 84.40 million tons, down 1.6% year-on-year, partially offsetting the national increase in autumn grain production. Liaoning's annual grain production was 23.05 million tons, down 2.7%. By contrast, Jilin maintained relatively strong growth momentum, with annual grain production of 48.13 million tons, up 5.1%, continuing to serve as an important source of incremental support within the Northeast. Inner Mongolia's autumn grain and annual grain production both declined by 0.6% year-on-year, with relatively moderate fluctuations.
Grain production in the Northwest was generally favorable and became one of the important sources of incremental national grain production in 2026. Gansu's autumn grain production was 6.75 million tons, up 7.3% year-on-year, and its annual grain production was 10.48 million tons, up 9.0%, with a markedly better production situation than last year. Ningxia's annual grain production increased by 3.6%, maintaining relatively rapid growth. Shaanxi's autumn grain production was 7.26 million tons, up 2.3%; with the additional contribution of a substantial increase in summer grain, its annual grain production was 11.51 million tons, up 6.6%. Xinjiang showed a structural pattern of “a decline in autumn grain production and significant growth in annual grain production”: its autumn grain production was 11.91 million tons, down 2.4% year-on-year, but its annual grain production reached 19.17 million tons, up 8.7%.
Southwest and South China maintained steady growth overall, with both autumn grain production and annual grain production in Sichuan, Yunnan, Zhejiang and other areas increasing year-on-year; Guangdong, Guangxi and Fujian were generally stable.
Overall, the revised estimates based on multi-source remote sensing data and crop yield models indicate a slight increase in China's grain production in 2026: both national autumn grain production and annual grain production achieved year-on-year growth of about 1.0%, further strengthening the stability of national grain supply. The growth momentum came mainly from the simultaneous increases in Henan, Jiangsu, Hubei, Jilin, Gansu, Yunnan and other provinces.
Table 2.1 Revised Estimates and Year-on-Year Changes in Autumn Grain Production and Annual Grain Production in China's Major Grain-Producing Provinces, 2026
Province / Autonomous Region | Autumn grain production (10,000 tons) | Annual grain production (10,000 tons) | ||
2026 | Change (%) | 2026 | Change (%) | |
Anhui | 2088 | 3.8 | 3620 | -1.8 |
Chongqing | 754 | -1.6 | 754 | -0.4 |
Fujian | 525 | 1.8 | 612 | 1.2 |
Gansu | 675 | 7.3 | 1048 | 9.0 |
Guangdong | 665 | 0.9 | 1126 | 0.5 |
Guangxi | 909 | 0.7 | 1421 | 0.5 |
Guizhou | 734 | 1.3 | 1236 | 0.8 |
Hebei | 1761 | -0.3 | 3249 | 2.3 |
Heilongjiang | 8440 | -1.6 | 8440 | -1.6 |
Henan | 2289 | 5.4 | 6241 | 2.7 |
Hubei | 2581 | 2.7 | 3276 | 5.2 |
Hunan | 1918 | 2.7 | 2790 | 2.1 |
Inner Mongolia | 4531 | -0.6 | 4531 | 1.6 |
Jiangsu | 2069 | 7.6 | 3459 | 6.6 |
Jiangxi | 1067 | 2.2 | 1696 | 1.8 |
Jilin | 4813 | 5.1 | 4813 | 4.4 |
Liaoning | 2305 | -2.7 | 2305 | -3.0 |
Ningxia | 362 | 3.6 | 362 | 7.1 |
Shaanxi | 726 | 2.3 | 1151 | 6.6 |
Shandong | 1778 | -5.5 | 4674 | 2.3 |
Shanxi | 1003 | 7.1 | 1242 | 4.7 |
Sichuan | 2864 | 2.4 | 3295 | 2.4 |
Xinjiang | 1191 | -2.4 | 1917 | 8.7 |
Yunnan | 1496 | 7.9 | 1496 | 8.7 |
Zhejiang | 700 | 3.4 | 759 | 1.4 |
Subtotal | 48243 | 1.4 | 65515 | 1.7 |
National total | 50774 | 1.0 | 68505 | 1.0 |
2.6.1 Maize Production Re-assessment
China's maize production in 2026 was generally stable, with area, yield and total production continuing a slight upward trend. Based on the latest revised estimates, the national maize production has been revised down by 0.70 million tons from the August forecast of 266.18 million tons to 265.48 million tons, with the year-on-year increase narrowing from 1.0% in the August forecast to 0.8%. Of this total, maize production in the major producing provinces was revised up from 251.97 million tons in the August forecast to 253.60 million tons, an increase of approximately 2.5 million tons year-on-year.
Maize production in Northeast China was generally stable, but differences among provinces remained evident. According to the latest revised estimates, Heilongjiang's maize production was revised down by 0.85 million tons from the August forecast, mainly because its revised maize yield estimate was lowered from 7,451 kg/ha to 7,358 kg/ha. This was mainly due to waterlogging and lodging in low-lying plots caused by periods of heavy precipitation in parts of the north, which adversely affected grain filling and thousand-kernel weight and offset the gains from the expansion in maize planted area. By contrast, Jilin had relatively good light and temperature conditions from late August to early September, and grain-filling conditions were better than estimated in August; maize growth was favorable, with yield rising from 7,562 kg/ha to 7,684 kg/ha, and total production was revised up from 38.31 million tons to 40.35 million tons, an increase of 2.04 million tons (+5.3%). Liaoning's yield edged up 0.3% to 7,938 kg/ha, but its planted area shrank 2.4% year-on-year, and total production decreased 2.2% year-on-year.
North China and the Huang-Huai-Hai region remained generally stable, but inter-provincial differences in production changes were relatively large. Shandong was one of the provinces with a relatively large downward revision in this re-assessment: persistent low rainfall in the late grain-filling period in mid-to-late September adversely affected yield, and maize matured faster, leading to a year-on-year decline in yield, reversing the increase projected in August; combined with the reduction in area, total production fell to 16.76 million tons, a year-on-year decrease of 1.04 million tons (-5.8%). Henan was affected by waterlogging and lodging caused by heavy rainfall from Typhoon Dolphin in August and local dike breaches, but the heavy precipitation also brought abundant moisture supply to other areas; in addition, overall conditions in mid-to-late September were favorable for grain filling and maturity, and crop growth in southern Henan and other areas recovered well. As a result, Henan's maize production was 17.23 million tons, up 0.97 million tons year-on-year, an increase of 5.9%. The revised estimates for Hebei and Shanxi were close to the August forecast.
The Northwest was generally stable. Gansu's yield was revised up slightly from the August forecast to 5,281 kg/ha, and total production increased to 5.42 million tons, mainly due to a 5.9% increase in area. Shaanxi's yield increased to 5,601 kg/ha, with total production of 4.68 million tons. Maize production in Xinjiang and Ningxia changed little compared with the August forecast.
Most provinces in Southwest and Central China had higher production than the August forecast. Yunnan's total production was 6.65 million tons, slightly higher than the 6.61 million tons forecast in August. Sichuan's maize yield remained at 4,696 kg/ha, with total production of 6.57 million tons. Hubei's total production was 5.24 million tons, an increase of 0.22 million tons over the August forecast, mainly due to a slight increase in yield in the revised estimates.
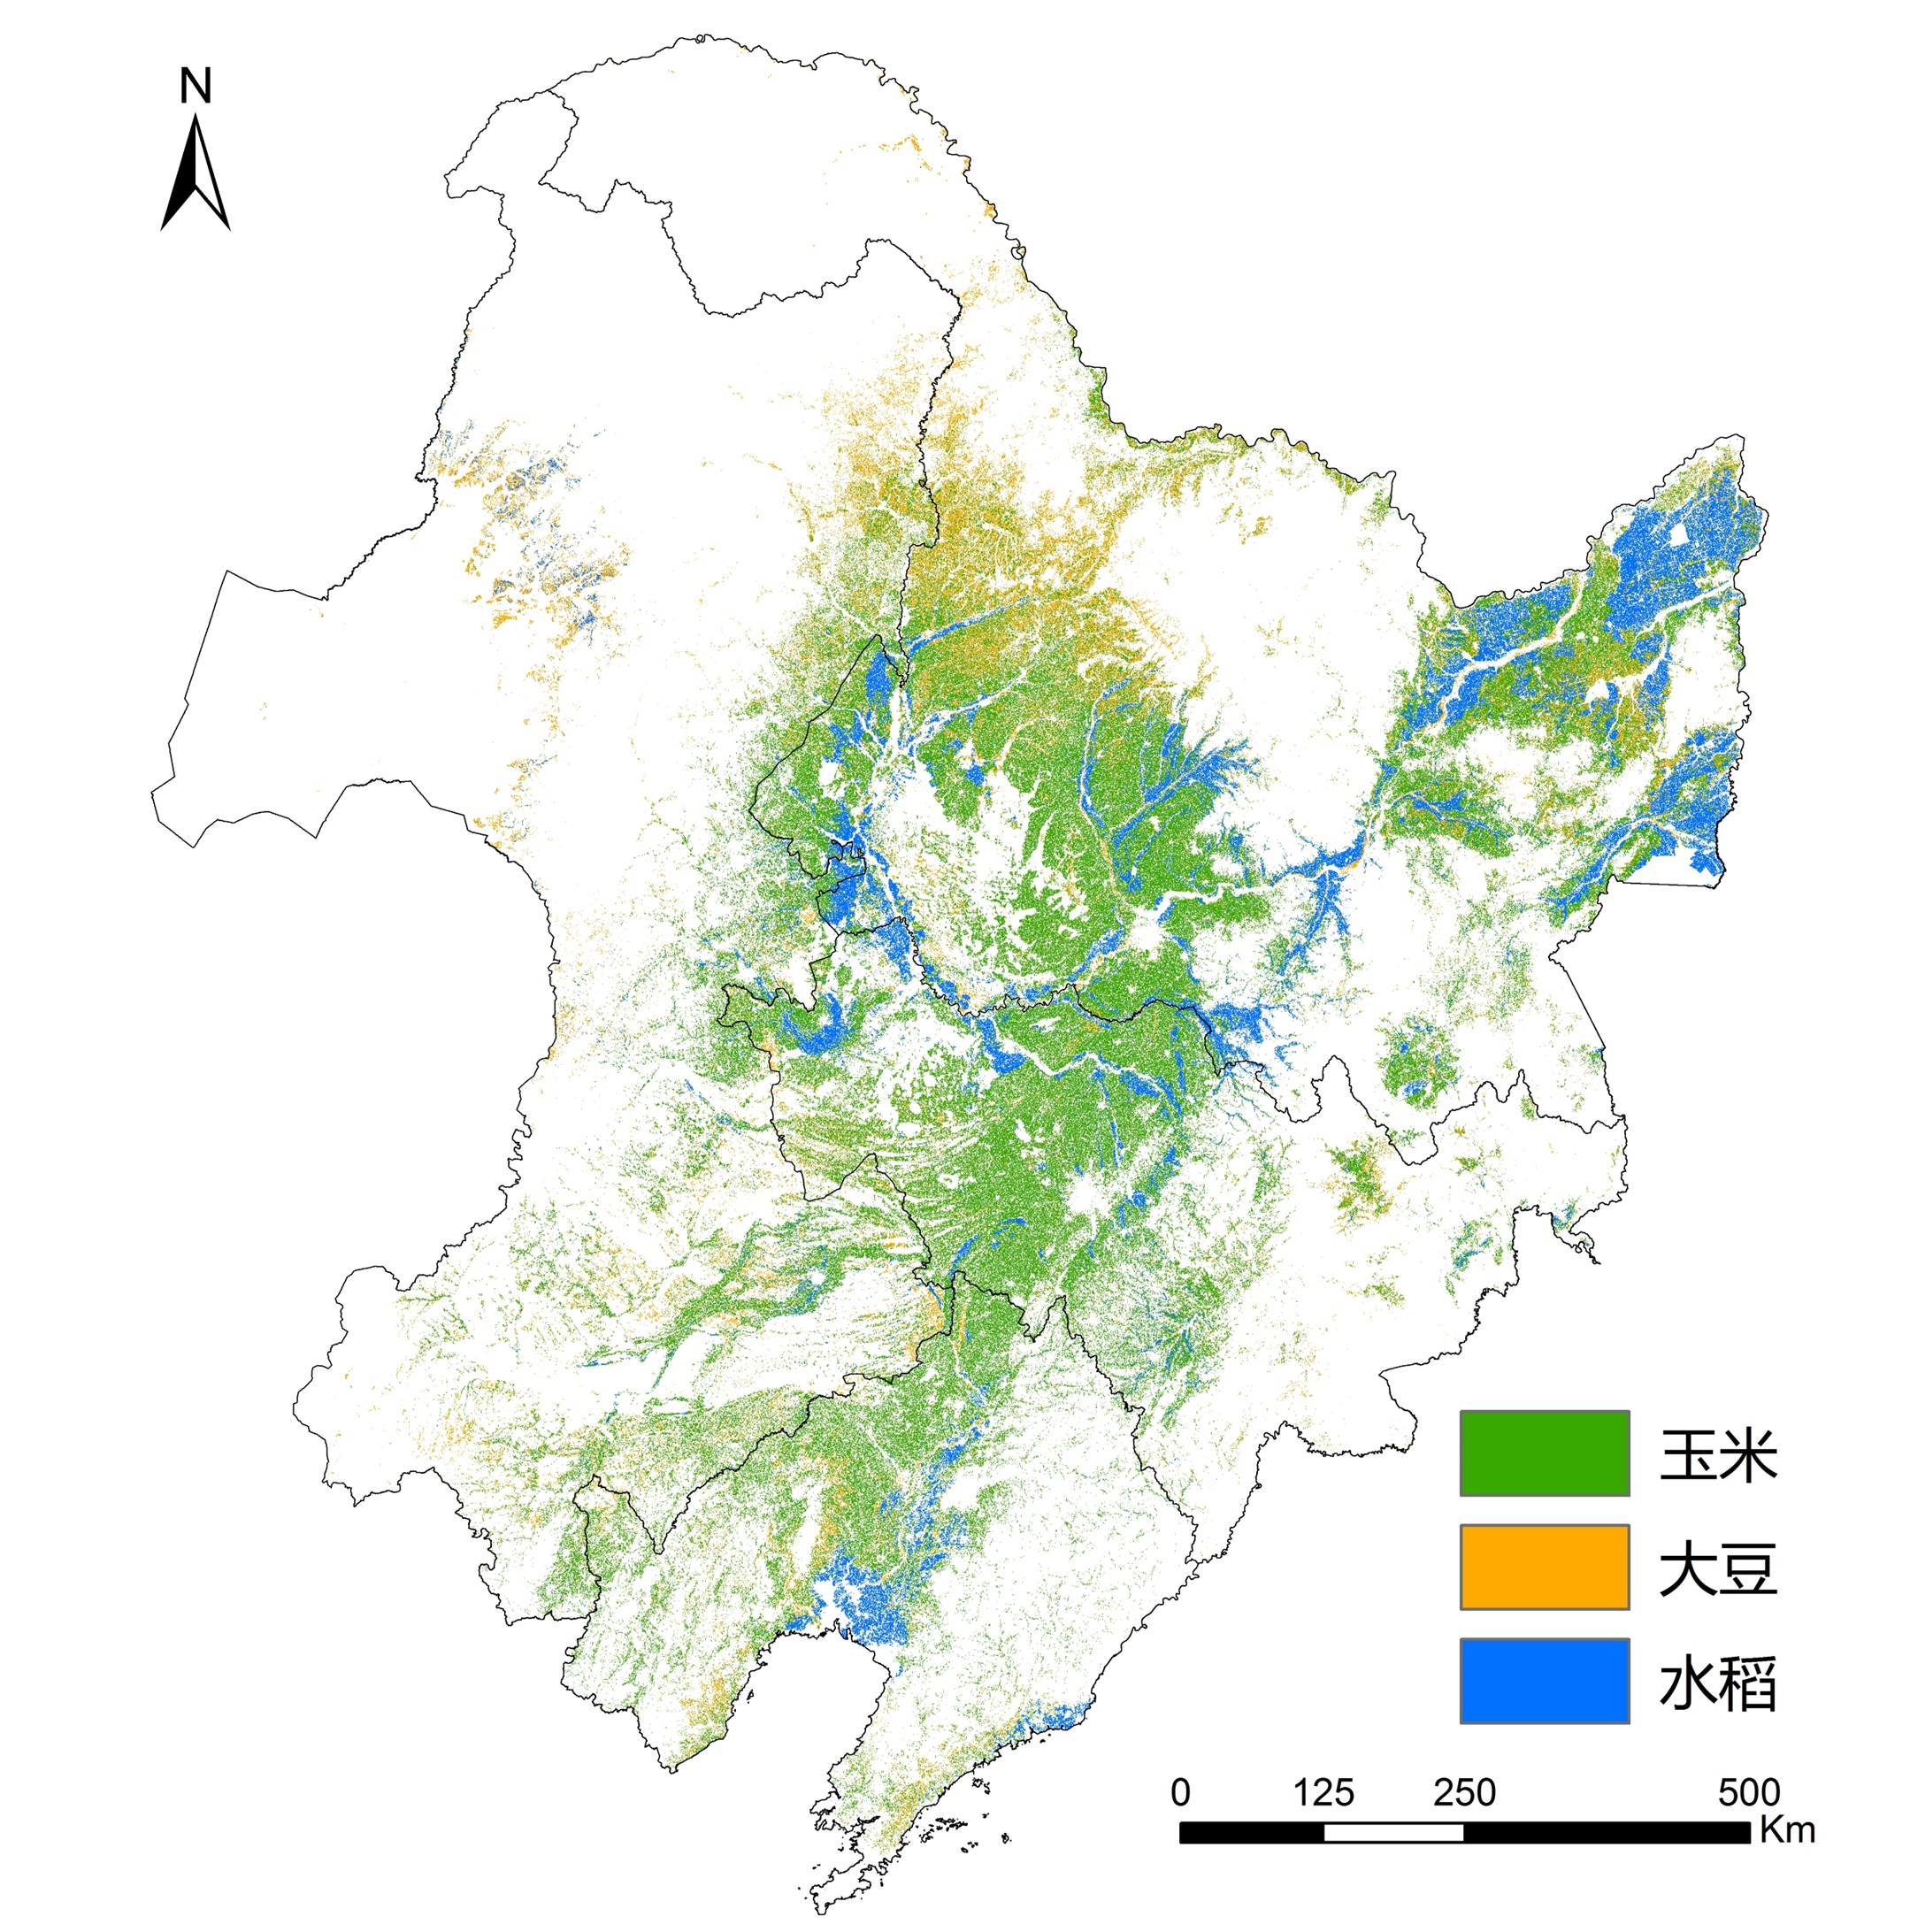
Figure 2.8 Crop Distribution in North China and Northeast China, 2026
Table 2.2 Provincial Maize Production and Year-on-Year Changes in China, 2026
Area (1,000 ha) | Yield (kg/ha) | Production (10,000 tons) | |||||||
2025 | 2026 | Change (%) | 2025 | 2026 | Change (%) | 2025 | 2026 | Change (%) | |
Anhui | 841 | 849 | 1.0 | 5259 | 5312 | 1.0 | 442 | 451 | 2.0 |
Chongqing | 435 | 445 | 2.3 | 4448 | 4299 | -3.3 | 193 | 191 | -1.1 |
Gansu | 970 | 1027 | 5.9 | 5179 | 5281 | 2.0 | 502 | 542 | 8.0 |
Hebei | 2930 | 2852 | -2.7 | 5637 | 5771 | 2.4 | 1652 | 1646 | -0.3 |
Heilongjiang | 6838 | 7022 | 2.7 | 7681 | 7358 | -4.2 | 5252 | 5167 | -1.6 |
Henan | 3087 | 3146 | 1.9 | 5269 | 5477 | 3.9 | 1627 | 1723 | 5.9 |
Hubei | 821 | 827 | 0.7 | 6049 | 6336 | 4.7 | 497 | 524 | 5.5 |
Inner Mongolia | 4411 | 4462 | 1.2 | 7872 | 7707 | -2.1 | 3472 | 3439 | -1.0 |
Jiangsu | 456 | 427 | -6.4 | 4965 | 4969 | 0.1 | 226 | 212 | -6.3 |
Jilin | 5079 | 5252 | 3.4 | 7543 | 7684 | 1.9 | 3831 | 4035 | 5.3 |
Liaoning | 2301 | 2246 | -2.4 | 7918 | 7938 | 0.3 | 1822 | 1783 | -2.2 |
Ningxia | 254 | 254 | 0.0 | 7892 | 7904 | 0.2 | 200 | 201 | 0.2 |
Shaanxi | 872 | 836 | -4.1 | 5294 | 5601 | 5.8 | 462 | 468 | 1.4 |
Shandong | 3104 | 3009 | -3.1 | 5736 | 5571 | -2.9 | 1780 | 1676 | -5.8 |
Shanxi | 1550 | 1599 | 3.2 | 6043 | 6271 | 3.8 | 937 | 1003 | 7.1 |
Sichuan | 1339 | 1399 | 4.5 | 4696 | 4696 | 0.0 | 629 | 657 | 4.5 |
Xinjiang | 1294 | 1288 | -0.5 | 7760 | 7579 | -2.3 | 1004 | 976 | -2.8 |
Yunnan | 1471 | 1648 | 12.0 | 3952 | 4037 | 2.2 | 581 | 665 | 14.4 |
Subtotal | 38053 | 38588 | 1.4 | 6599 | 6568 | -0.5 | 25110 | 25360 | 1.0 |
National total | 41139 | 41707 | 1.4 | 6404 | 6365 | -0.6 | 26345 | 26548 | 0.8 |
2.6.2 Mid-season Rice Production Re-assessment
The revised estimates indicate a modest increase in China's mid-season rice production in 2026. The national mid-season rice planted area was 21,648 thousand hectares, a slight year-on-year increase of 0.2%; yield was 6,298 kg/ha, up 0.7% year-on-year; and total production was 136.33 million tons, an increase of 1.21 million tons, or 0.9%, year-on-year. Overall, the largely stable planted area and moderate recovery in yield together turned total production from a slight decrease in the August forecast to a slight increase. During the year, typhoon events still caused periodic disturbances along the eastern coast and parts of the middle and lower reaches of the Yangtze River, resulting in lodging and interrupted grain filling in some fields, but the affected area was relatively limited and no large-scale agricultural disasters occurred in major producing areas. In most producing areas, solar radiation, temperature and moisture conditions were generally favorable and field management was adequate, so national mid-season rice production maintained an increasing trend.
From a regional perspective, the middle and lower reaches of the Yangtze River remained the core region of national mid-season rice production increase, with Jiangsu and Anhui contributing most prominently. Jiangsu's area expanded by 7.9% and its yield increased by 1.9%, with total production of 16.59 million tons, an increase of 1.51 million tons, or 10.0% year-on-year, maintaining a strong role in driving the increase. Anhui's area increased by 2.4% and its yield rose by 2.7%, with total production reaching 13.52 million tons, an increase of 0.66 million tons, or 5.1%; the increase was mainly driven by simultaneous improvements in area expansion and yield. Hubei and Hunan steadily expanded their planted area, and yields rose steadily, with production increasing by 0.23 million tons and 0.32 million tons, respectively. Zhejiang's area and yield both improved, and production increased by 0.19 million tons. Jiangxi's planted area shrank slightly by 0.8%, but a 3.5% yield increase offset the area loss, and production still increased by 0.09 million tons year-on-year.
Single-season rice production in the Northeast generally declined slightly. In Jilin, the planted area decreased by 2.2% year-on-year while yield was flat, and production decreased by 0.13 million tons, or 2.2%. In Liaoning, both area and yield declined, and production fell by 0.23 million tons (-4.8%), making it the main province with reduced production in the region. The revised estimates for Heilongjiang indicate that the planted area decreased by 0.9% year-on-year and yield decreased by 0.7%, with total production of 23.72 million tons, a year-on-year decrease of 0.37 million tons (-1.5%).
Southwest China, Northwest China and the Huang-Huai region generally recorded stable or increased production. Sichuan's mid-season rice area increased by 2.0% and yield remained basically stable, with production increasing by 0.27 million tons. Guizhou's production increased by 0.08 million tons driven by a slight yield improvement. Yunnan, despite a 1.0% decline in area, achieved a 2.2% yield increase, with production still up by 0.07 million tons. Chongqing was affected by persistent cloudy and rainy weather with insufficient sunlight, with yield down 1.9% and production down 0.09 million tons. Henan had generally suitable light and temperature conditions, with both area and yield increasing, and production increased by 0.12 million tons. In the Northwest, Ningxia and Shaanxi benefited from expanded planting and improved yields, increasing production by 0.09 million tons (+13.2%) and 0.07 million tons (+7.4%), respectively, with relatively high growth rates.
The latest revised estimates indicate a small increase in China's mid-season rice production in 2026: major producing areas such as Jiangsu and Anhui in the middle and lower reaches of the Yangtze River increased steadily, and provinces such as Hubei, Hunan, Zhejiang and Sichuan also contributed to the production increase. Although single-season rice in the Northeast declined slightly, mid-season/single-season rice still achieved a year-on-year production increase, supported by the largely stable national planted area and moderate recovery in yield.
Table 2.3 Revised Estimates of Mid-season Rice Production in China, 2026
Province / Autonomous Region | Area (1,000 ha) | Yield (kg/ha) | Production (10,000 tons) | |||||||
2025 | 2026 | Change (%) | 2025 | 2026 | Change (%) | 2025 | 2026 | Increase/ Decrease | Change (%) | |
Anhui | 1942 | 1988 | 2.4 | 6620 | 6799 | 2.7 | 1286 | 1352 | 66 | 5.1 |
Chongqing | 768 | 769 | 0.1 | 6420 | 6296 | -1.9 | 493 | 484 | -9 | -1.8 |
Guizhou | 765 | 764 | -0.1 | 7873 | 7990 | 1.5 | 602 | 610 | 8 | 1.3 |
Heilongjiang | 4891 | 4848 | -0.9 | 4926 | 4893 | -0.7 | 2409 | 2372 | -37 | -1.5 |
Henan | 620 | 632 | 1.8 | 6259 | 6338 | 1.3 | 388 | 400 | 12 | 3.1 |
Hubei | 1359 | 1386 | 1.9 | 7927 | 7945 | 0.2 | 1077 | 1101 | 23 | 2.2 |
Hunan | 1279 | 1314 | 2.7 | 7055 | 7108 | 0.7 | 903 | 934 | 32 | 3.5 |
Jiangsu | 2446 | 2640 | 7.9 | 6167 | 6286 | 1.9 | 1509 | 1659 | 151 | 10.0 |
Jiangxi | 467 | 464 | -0.8 | 7030 | 7277 | 3.5 | 329 | 338 | 9 | 2.7 |
Jilin | 915 | 894 | -2.2 | 6294 | 6294 | 0.0 | 576 | 563 | -13 | -2.2 |
Liaoning | 772 | 754 | -2.4 | 6127 | 5959 | -2.7 | 473 | 450 | -23 | -4.8 |
Ningxia | 86 | 93 | 8.1 | 8283 | 8671 | 4.7 | 71 | 81 | 9 | 13.2 |
Shaanxi | 162 | 172 | 6.2 | 5655 | 5723 | 1.2 | 91 | 98 | 7 | 7.4 |
Sichuan | 2162 | 2205 | 2.0 | 7426 | 7404 | -0.3 | 1606 | 1632 | 27 | 1.7 |
Yunnan | 889 | 880 | -1.0 | 6493 | 6638 | 2.2 | 577 | 584 | 7 | 1.2 |
Zhejiang | 637 | 651 | 2.2 | 8183 | 8300 | 1.4 | 522 | 540 | 19 | 3.6 |
Subtotal | 20160 | 20451 | 1.4 | 6404 | 6473 | 1.1 | 12910 | 13199 | 289 | 2.2 |
China | 21601 | 21648 | 0.2 | 6255 | 6298 | 0.7 | 13512 | 13633 | 121 | 0.9 |
2.6.3 Recovery in Late Rice Production
Based on high-resolution remote sensing monitoring data, the planted area of late rice in China's major producing provinces increased to 7,388 thousand hectares in 2026, up 2.4% year-on-year; the average yield was 4,710 kg/ha, up 0.3% year-on-year; and total production was 34.80 million tons, up 2.7% year-on-year. Compared with 2025, this year's increase was mainly driven by area recovery.
From a regional perspective, yield increases in the central provinces were more pronounced. Hunan's late rice area was 1,434 thousand hectares, up 0.5% year-on-year, with a yield of 5,159 kg/ha, up 1.3%, and production reached 7.40 million tons, an increase of 1.8%. Jiangxi's late rice planted area was 1,346 thousand hectares, up 0.4% year-on-year, with a yield of 4,449 kg/ha, up 1.4%, and production reached 5.99 million tons (+1.9%), reversing the previous year's situation of “increased area but decreased yield.” Hubei's late rice planted area and yield were basically flat, and production remained stable at 3.21 million tons. Anhui's area was 323 thousand hectares, up 0.6%, with a yield of 4,891 kg/ha, up 0.8% year-on-year, and production of 1.58 million tons, an increase of 1.4%.
In South China's late rice producing areas, yields increased slightly, promoting production increases of 0.9% and 0.7% in Guangdong and Guangxi, respectively; production in Fujian and Zhejiang increased by 1.8% and 1.9%, respectively. The four major late-rice-producing provinces/regions reversed the previous year's area contraction and yield decline, but their increases were weaker than those in the middle and lower reaches of the Yangtze River.
Overall, adverse weather such as excessive rainfall, low sunshine and typhoons in the late growth stage of late rice in 2026 had a certain negative impact on late rice yield. Although the national yield increased year-on-year, it remained below the 2024 level; thanks to the recovery in planted area, national late rice still achieved a year-on-year production increase.
Table 2.4 Remote Sensing Estimates of Late Rice Production in China, 2026
Province / Autonomous Region | Area (1,000 ha) | Yield (kg/ha) | Production (10,000 tons) | ||||||
2025 | 2026 | Change (%) | 2025 | 2026 | Change (%) | 2025 | 2026 | Change (%) | |
Anhui | 321 | 323 | 0.6 | 4851 | 4891 | 0.8 | 156 | 158 | 1.4 |
Hubei | 521 | 521 | 0.1 | 6169 | 6163 | -0.1 | 321 | 321 | 0.0 |
Hunan | 1427 | 1434 | 0.5 | 5092 | 5159 | 1.3 | 727 | 740 | 1.8 |
Jiangxi | 1340 | 1346 | 0.4 | 4388 | 4449 | 1.4 | 588 | 599 | 1.9 |
Zhejiang | 146 | 146 | 0.2 | 5758 | 5858 | 1.7 | 84 | 86 | 1.9 |
Guangdong | 1051 | 1053 | 0.2 | 5296 | 5331 | 0.7 | 557 | 562 | 0.9 |
Guangxi | 1133 | 1134 | 0.0 | 4690 | 4721 | 0.7 | 531 | 535 | 0.7 |
Fujian | 215 | 217 | 1.0 | 7016 | 7069 | 0.8 | 151 | 154 | 1.8 |
Subtotal | 6154 | 6173 | 0.3 | 5061 | 5108 | 0.9 | 3114 | 3153 | 1.2 |
China | 7218 | 7388 | 2.4 | 4695 | 4710 | 0.3 | 3389 | 3480 | 2.7 |
2.6.4 Soybean Production Forecast
In October 2026, CropWatch's revised estimates indicate a continued increase in China's soybean production, slightly higher than the August forecast. Based on the latest revised area and yield estimates, China's soybean production in 2026 is estimated at 19.70 million tons, an increase of 0.44 million tons, or 2.3%, over 19.26 million tons in 2025. The national soybean planted area was about 11,006 thousand hectares, up 0.4% year-on-year, while the national average yield rose to 1,790 kg/ha, up 1.9% year-on-year. This year's soybean production increase was mainly driven by yield improvement.
Within the core producing region of Northeast China, changes were mixed. Heilongjiang's soybean production was revised down from 8.34 million tons in the August forecast to 8.22 million tons (-1.5%), mainly because its yield estimate was revised down from 1,654 kg/ha in August to 1,636 kg/ha, a year-on-year decrease of 1.1%, while area decreased slightly by 0.4%. The main reasons for the yield reduction were persistently excessive precipitation and periodic low sunshine, which led to insufficient photosynthetically active radiation and limited soybean seed filling. In contrast, Inner Mongolia's soybean production was revised up from 2.88 million tons in the August forecast to 2.98 million tons (+3.6%), with yield rising from 1,760 kg/ha to 1,809 kg/ha (+2.8%), mainly benefiting from improved moisture and temperature conditions since August, alleviated drought, and an extended grain filling and maturity period.
The Huang-Huai-Hai producing region maintained an overall production increase, and compared with August, the contribution of yield improvement became more prominent. Henan remained a major contributor to the regional production increase, with production of about 0.61 million tons, up 7.0% year-on-year, yield rising to 1,521 kg/ha (+4.7%) and area expanding simultaneously (+2.2%). Shaanxi also showed a notable yield improvement (1,569 kg/ha, +6.7%), consistent with relatively favorable light and temperature conditions since September and better windows for grain filling, maturity, and harvesting and drying. Shandong's soybean yield also increased, contributing to higher provincial soybean production. Anhui's revised soybean planted area estimate shrank 2.4% year-on-year; although yield increased 1.3% year-on-year, this did not offset the impact of the area reduction, and production was revised down from 0.99 million tons in the August forecast to 0.98 million tons.
Overall, China's soybean production in 2026 continued the upward trend of previous years, but this was driven mainly by higher yields, while the trend of planted area expansion slowed significantly.
Table 2.5 Revised Estimates of Soybean Production in China, 2026
Province / Autonomous Region | Area (1,000 ha) | Yield (kg/ha) | Production (10,000 tons) | ||||||
2025 | 2026 | Change (%) | 2025 | 2026 | Change (%) | 2025 | 2026 | Change (%) | |
Anhui | 765 | 747 | -2.4 | 1299 | 1316 | 1.3 | 99 | 98 | -1.1 |
Guizhou | 259 | 259 | 0.0 | 1178 | 1189 | 0.9 | 31 | 31 | 0.9 |
Henan | 394 | 402 | 2.2 | 1452 | 1521 | 4.7 | 57 | 61 | 7.0 |
Heilongjiang | 5045 | 5024 | -0.4 | 1654 | 1636 | -1.1 | 834 | 822 | -1.5 |
Hubei | 264 | 272 | 3.2 | 1488 | 1526 | 2.6 | 39 | 42 | 5.9 |
Jilin | 340 | 337 | -0.9 | 1934 | 1957 | 1.2 | 66 | 66 | 0.3 |
Jiangsu | 311 | 319 | 2.7 | 2301 | 2293 | -0.3 | 72 | 73 | 2.4 |
Inner Mongolia | 1636 | 1649 | 0.8 | 1760 | 1809 | 2.8 | 288 | 298 | 3.6 |
Shandong | 289 | 295 | 2.2 | 2157 | 2191 | 1.6 | 62 | 65 | 3.8 |
Shaanxi | 192 | 193 | 0.5 | 1471 | 1569 | 6.7 | 28 | 30 | 7.2 |
Sichuan | 580 | 586 | 1.0 | 1903 | 1905 | 0.1 | 110 | 112 | 1.2 |
Subtotal | 10075 | 10085 | 0.1 | 1674 | 1684 | 0.5 | 1687 | 1698 | 0.6 |
China | 10966 | 11006 | 0.4 | 1756 | 1790 | 1.9 | 1926 | 1970 | 2.3 |