
 English
 中文

Bulletin
CropWatch bulletinMenu
Authors: yannn | Edit: qinxl
During July–September 2026, South Africa’s national agro-remote-sensing signals exhibited a pronounced “winter-crop–dominated” pattern. The crop calendar indicates that wheat continued active growth throughout the quarter, while summer crops such as maize and soybean were largely in the off-season. Extensive summer-crop areas therefore remained mostly fallow or under low vegetation cover. As a result, national vegetation dynamics during this period should be interpreted primarily as the combined response of the winter wheat belt and parts of natural vegetation, rather than as a signal of summer-crop conditions.
From an agrometeorological perspective, national cumulative rainfall (RAIN) reached 104 mm, which is 47% above the 15-year average. Mean temperature (TEMP) was 14.1°C with an anomaly of +0.1°C, close to normal. Cumulative photosynthetically active radiation (RADPAR) totaled 640 MJ/m², 10% below average, suggesting increased cloudiness and weaker radiation. Despite reduced radiation, national potential biomass (BIOMSS) still reached 413 gDM/m² with a +24% anomaly, consistent with favorable agricultural condition indicators such as VCIx (vegetation condition index, best state) and CroPI (crop production situation index). Overall, this indicates that, at the national scale, improved moisture conditions provided a net positive effect on vegetation growth, outweighing the negative influence of lower radiation.
The national monthly rainfall profile shows that July–August were relatively dry, with rainfall near to or below the multi-year average. Rainfall increased markedly only in September, with more pronounced event peaks. This “dry early, wet later” sequence is particularly critical for rainfed winter wheat: sowing and early stand establishment depend more on steady rainfall during June–August (or earlier) to build soil moisture, secure emergence, and support tillering. Therefore, the wetter conditions in September function more as a late-season replenishment and partial recovery for already planted crops, and are unlikely to reverse area-reduction or crop-switching decisions that were made earlier within the sowing window.
Subregional statistics reveal a clear spatial contrast between national averages and the core wheat zone. The Mediterranean climate zone, which closely corresponds to the southwestern winter-rainfall rainfed farming belt, displayed a distinctly drier and weaker signal in July–September 2026: RAIN was 85 mm with an anomaly of −48%; TEMP anomaly reached +1.7°C (warmer conditions increasing evaporative demand); RADPAR was 542 MJ/m² with an anomaly of −5%; and BIOMSS was 354 gDM/m² with an anomaly of −33%. Agriculturally, this zone covers the core rainfed wheat area of Western Cape, and extends into parts of Northern Cape that fall within winter-rainfall or transitional regimes. Hence, the Mediterranean zone’s combination of “dry conditions + low potential biomass” aligns with the assessment that rainfed wheat in Western/Northern Cape was constrained during a critical period, and it also explains why the national picture can simultaneously show overall wetter conditions and better vegetation indices, while the core wheat belt does not benefit in the same way. In contrast, other zones (e.g., arid/desert areas and the Highveld maize zone) show markedly positive anomalies in RAIN and BIOMSS; when aggregated nationally, these regions elevate the moisture and biomass signals, thereby masking localized deficits in the winter-rainfall zone.
In terms of production outcomes, South African wheat in 2026 shows a structure of lower yield, reduced area, and lower total production. CropWatch monitoring indicates that wheat area declined from 664 kha in 2025 to 636 kha in 2026 (−4.2%). Yield decreased from 2,737 kg/ha to 2,506 kg/ha (−8.5%), and total production fell from 1.82 Mt to 1.59 Mt (−12.3%). Area changes diverged notably across provinces: wheat area in Western Cape and Northern Cape decreased by 7.4% and 8.5% year-on-year, respectively, while Free State increased by 4.5%. Economic factors (input costs and price expectations) drove the nationwide area contraction to a near-century low. Meanwhile, the limited rainfall during June–August, the delayed shift to wetter conditions in September, and the strong dry anomaly in the Mediterranean zone further reinforced area reduction and crop-switching in the core rainfed regions. At the same time, production systems with irrigation or more reliable water access (e.g., parts of Free State) showed greater resilience, maintaining or even expanding planting area under combined economic and climatic pressures.
For the next stage (September–November), monitoring priorities will shift from canopy development toward yield realization and quality-risk management, while also tracking the establishment of pre-plant soil moisture for summer crops. For wheat, if rainfall remains above normal after September and coincides with persistently low RADPAR (cloudy conditions), risks increase for harvest delays, field losses, and quality degradation, as well as spike/leaf diseases and lodging under wet conditions. If October–November turns drier and sunnier, conditions would be more favorable for maturation, dry-down, and timely harvest, reducing quality losses; however, attention should be paid to late-sown or slower-developing fields where a rapid shift to dry weather could affect final grain-filling and kernel weight formation. For summer crops (maize/soybean), stronger rainfall in September supports soil-moisture replenishment and improves planting preparation in some areas. Nevertheless, because this season’s rainfall pattern features early dryness followed by event-driven strengthening later, continued tracking is needed to determine whether October–November rainfall can sustain and whether its spatial distribution covers the main summer-grain belt, in order to assess planting-window stability and early-season risk.
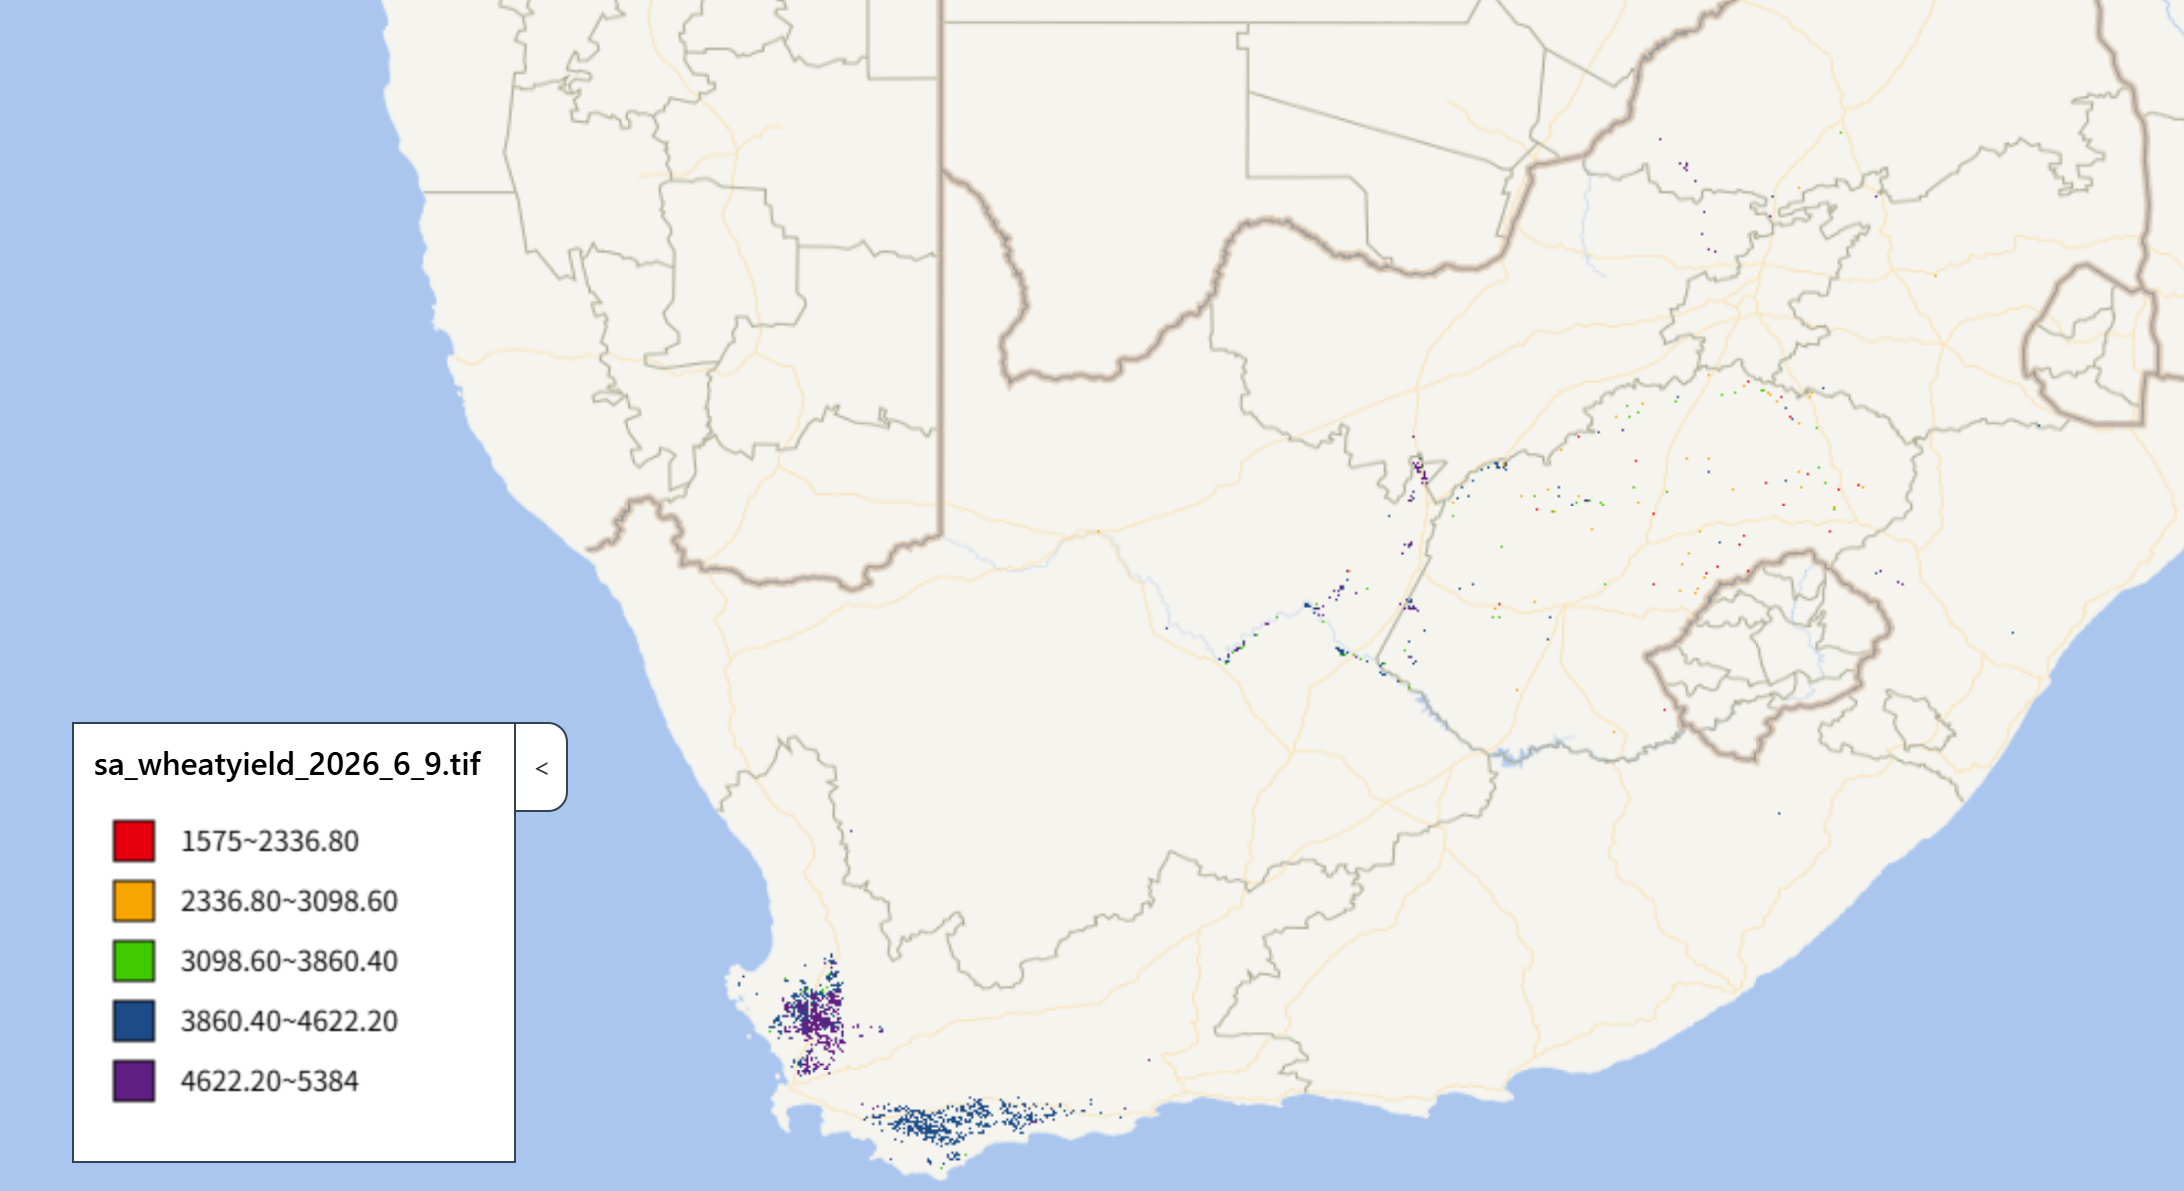
Figure 2.21 2026 Wheat Production Forecast for South Africa