
 English
 中文
中文
Bulletin
CropWatch bulletinMenu
Authors: 超级管理员 | Edit: tanshen
Chapter 1. Global agroclimatic patterns
Chapter 1 describes the CropWatch agroclimatic indicators (CWAIs) for rainfall (RAIN), temperature (TEMP), and radiation (RADPAR), along with the agronomic indicator for potential biomass (BIOMSS) for sixty-five global Monitoring and Reporting Units (MRU). Rainfall, temperature, and radiation indicators are compared to their average value for the same period over the last fifteen years (called the “average”), while BIOMSS is compared to the indicator’s average of the recent five years. Indicator values for all MRUs are included in Annex A table A.1. For more information about the MRUs and indicators, please see Annex C and online CropWatch resources at www.cropwatch.com.cn.
1.1 Overview
Chapter 1 in each CropWatch bulletin aims to identify the features that synthesize recent global agroclimatic patterns. Given the bewildering number of different situations, the purpose is to highlight a limited number of characteristics that are relevant for agriculture, have spatial coherence, and have some persistence over time (as the reference period covers four months) while also being easy to recognize in the maps that illustrate this chapter.
This reporting period, one of those persistent and large-scale features is a continent-wide patch of above average rainfall that affects the semi-arid and arid areas stretching from Senegal in West Africa (Sahel MRU-08) to Southern Mongolia (MRU-47) and beyond. It crosses the Arabian peninsula (MRU-64, Sahara to Afghan desert) and semi-arid Central Asia (western Asia MRU-31). The patch was noted more than one year ago and has apparently become relatively persistent. It is stressed that this patch exists within the context of the CropWatch Agroclimatic Indices (CWAIs), which includes a built-in bias to increase the weight of agricultural areas. It is also important to remember that CWAIs are compared against the average of the previous 15 years, as opposed to the standard 30-year period adopted by climatology. This is because the response time of farming to environmental changes is much faster than 30 years, which represents approximately one generation. The time of 15 years is considered an acceptable compromise between the needs for statistical representation and addressing agricultural adaptations.
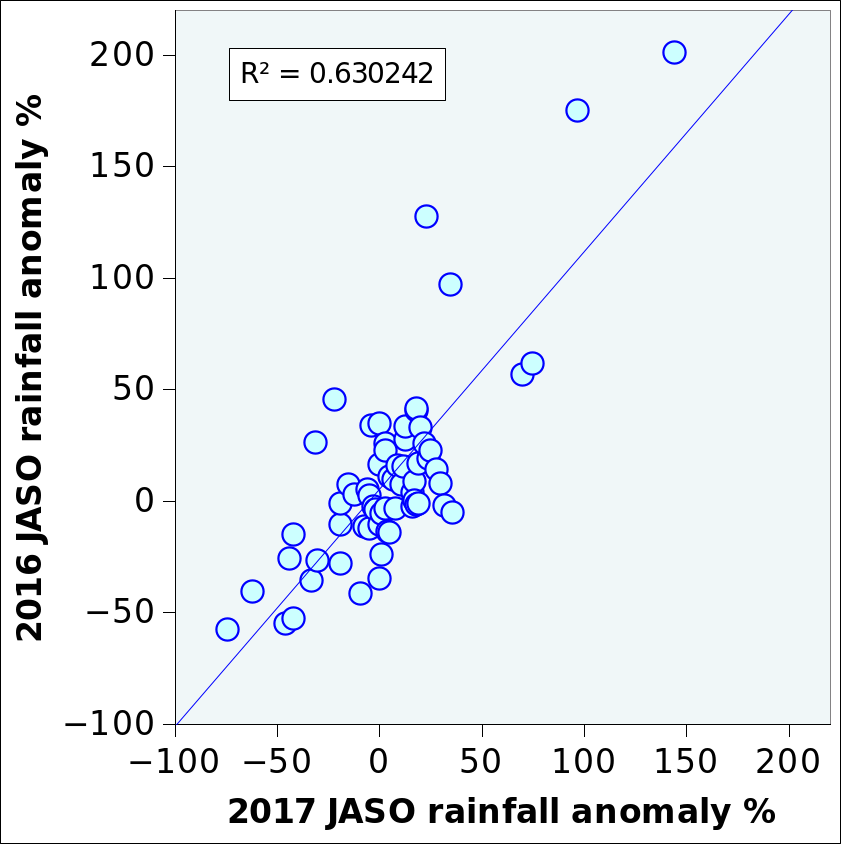
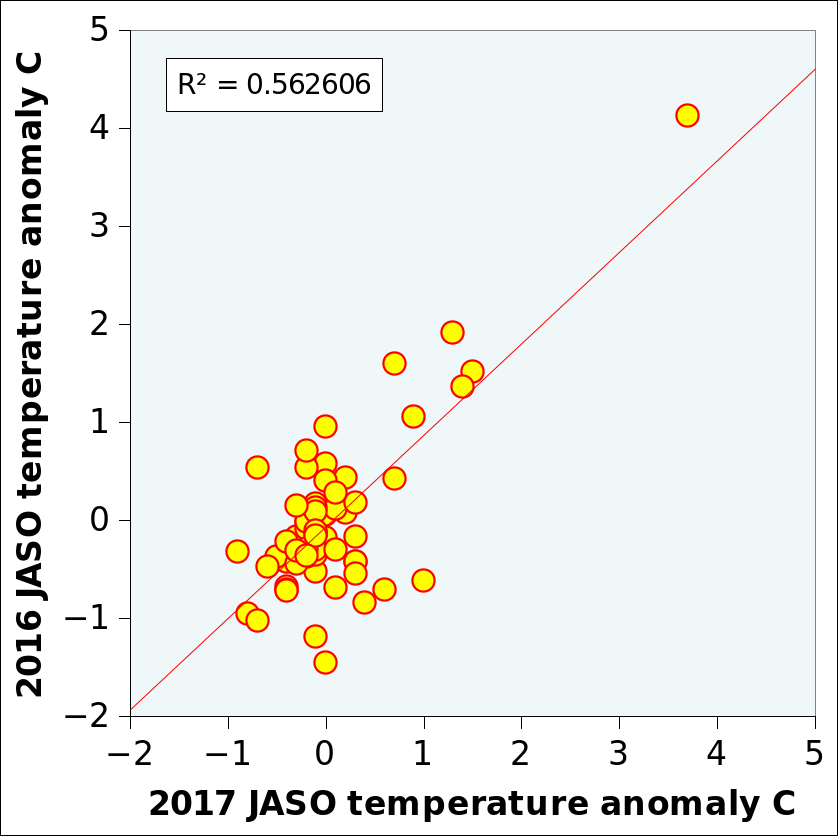
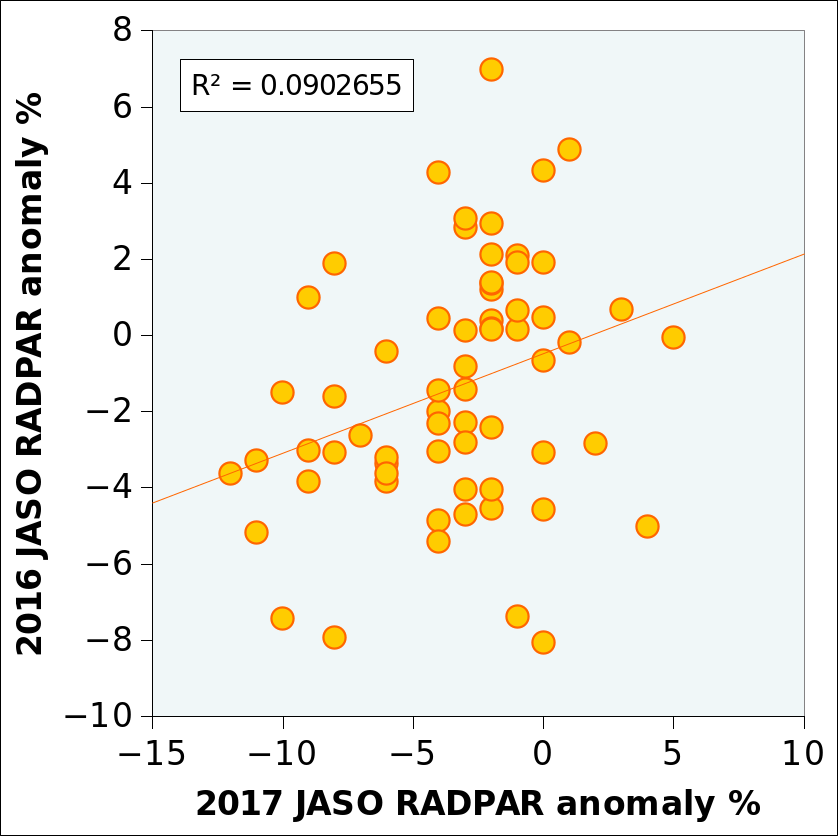
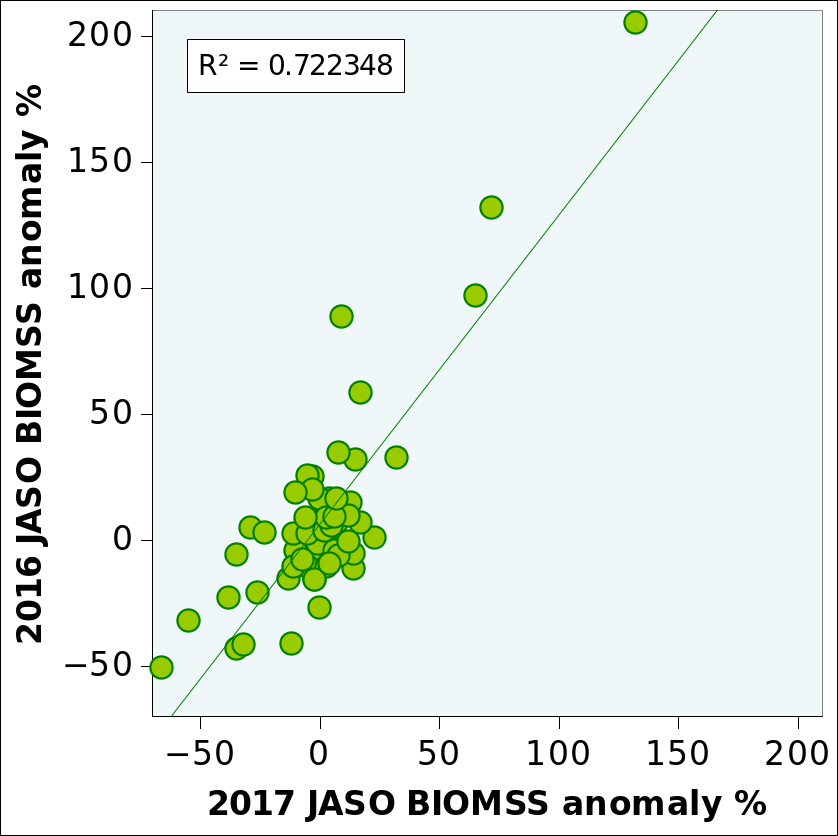
As an additional confirmation of the stability of the large area of above-average rainfall, marked correlations were found between the departures from the reference period for several agroclimatic indicators in 2017 and 2016 (Figure 1).
Figure 1.1. Comparison of departures from the recent fifteen-year July-October average of CWAI between 2017 and 2016
(a) RAIN
(b) TEMP
(c) RADPAR
(d) BIOMSS
Note: Each graph has 65 points corresponding to the 65 MRUs.
It is remarkable that the patterns are so similar for rainfall (R=0.794; significance level well below 0.0005 corresponding to R=0.410) and, to a slightly lesser degree, for temperature (R=0.750). The highest correlations are those for biomass (R=0.85). This results partially from the definition of the BIOMSS index, which is a function of both RAIN and TEMP, but nevertheless shows that impacts are more persistent over time than the factors causing them. As to RADPAR, the positive correlation between the two years is so weak that it is best ignored.
The introduction to the section on disasters, which were particularly severe during the current reporting period, pays attention to the fact that it is becoming more likely that the patterns of droughts, floods, and cyclones may well be a harbinger of the often announced increase of disasters under climate change conditions (see Chapter 5). The current observations are also compatible with climate change. In their methodological description of the CropWatch indicators, Gommes and Wu and their colleagues (2016) quote evidence of the fact that high temperature brought about by global warming tends to be associated with higher rainfall in currently semi-arid areas (Spaulding 1991, Guo et al. 2000, and Petit-Maire and Bouysse 2000) at geological time scales. At shorter time periods, the issue is well addressed in a paper by De Paola and Giugnia (2013), which shows that in the United States long-term (secular) temperature increases have been associated with increased rainfall; the study showed that for an overall increment of the mean of annual average temperatures of +4°C the global increase of precipitation will be about 38 percent, while for an increment of +2°C the increase will be about 22 percent.
The section on African rangeland in Chapter 5 lists the work of Sachs and Myhrvold (2011), who posit that climate change may imply a shift to the north of the Inter-tropical Convergence Zone in Africa. This could account for the improved rainfall in MRU-08 (Sahel) across the Arabian peninsula (MRU-64, Sahara to Afghan desert), and the intensification of the South Asian monsoon, which has resulted in frequent floods recently. Obviously for semi-arid inner Asia (for example, MRU-47, southern Mongolia), where the dominant climates belong to the Bsk and Bwk Köppen categories, other mechanisms must be invoked.
It remains that, in terms of food security, two consecutive years with rainfall deficits (and thus little soil water storage) create situations where even a slight additional shortage can potentially lead to widespread crop failures.
1.2 Rainfall
Globally, precipitation was about 6 percent above average over the July-October (JASO) reporting period, with extreme departures ranging from -75 to +144 percent. Relative departures tend to be larger in high precipitation areas (R=0.303; in 2016, the correlation was weaker with R=0.159, indicating near independence between magnitude of the departure from average and rainfall amounts).
Most of Eurasia and Africa, North and Central America recorded average or above-average precipitation (Figure 2).
Figure 1.2. Global map of July-October 2017 rainfall anomaly (as indicated by the RAIN indicator) by MRU, departure from 15YA (percentage)

Highest departures were recorded in MRU-47 (Southern Mongolia, 477 mm and RAIN, +144 percent), MRU-32 (Gansu-Xinjiang, 300 mm or +97 percent) and MRU-35 (Inner Mongolia, 487 mm or +70 percent). Excesses close to 30 percent occurred in China in areas where average rainfall amounts to at least 400 mm, so that the increases are indeed significant: in the Loess Region (MRU-36, +28 percent), Qinghai-Tibet (MRU-39, +30 percent), and Huanhuaihai (MRU-34, +36 percent). Large positive departures must also be mentioned for much of the island of Madagascar (MRU-05, +32 percent with 159 mm) and the northern Great Plains (MRU-12), which recorded 409 mm, up +35 percent over the average of the recent 15 years.
Large and spatially coherent rainfall deficits are reported for five areas, with the largest in South America. The first two areas had the most serious rainfall deficits, including those in (1) Africa's MRU-10 (Western Cape with 38 mm, a shortfall of 74 percent) and MRU-06, semi-arid Southwest Madagascar (22 mm, -62 percent); and in (2) Oceania, MRU-56 (New Zealand, 152 mm or -46 percent) and MRU-55 (Nullarbor to Darling, 115 mm, equivalent to -42 percent). In Europe (3) the overall impact was probably limited on maturing summer crops, but dry conditions have delayed the planting of winter crops. The areas most affected include the whole Mediterranean basin (MRU-59, Mediterranean Europe and Turkey, 91 mm or -44 percent; and MRU-07, Mediterranean North Africa with 58 mm, -42 percent), as well as the adjacent area to the east, the Caucasus (MRU-29) with 117 mm (-30 percent). (4) Although the deficit is less severe than in some of the just listed regions, East Asia (MRU-43, including the Korean peninsula) is mentioned because of the length of the ongoing drought (486 mm, -19 percent). Finally, in South America (5), while the Pampas (MRU-26), the major agricultural area, underwent globally average precipitation (+3 percent), the following areas were stressed by water deficits of decreasing intensity: MRU-27, Western Patagonia (245 mm or -33 percent), the Brazilian Nordeste (MRU-22, 40 mm or -31 percent), MRU-23 (Central eastern Brazil, 166 mm or -19 percent), and MRU-21, the Central-northern Andes (280 mm, -19 percent).
The North American West Coast (MRU-16) recorded a rainfall deficit of 22 percent, which resulted in widespread fires (see also the section in Chapter 5 that reports on disaster events over the reporting period.)
1.3 Temperature
Globally, temperature was close to average. The correlation between TEMP and its departure from average is negative but non-significant, nevertheless indicating that departures tend to concentrate in non-tropical areas, as shown in Figure 3.
Figure 1.3. Global map of July-October 2017 temperature anomaly (as indicated by the TEMP indicator) by MRU, departure from 15YA (degrees Celsius)
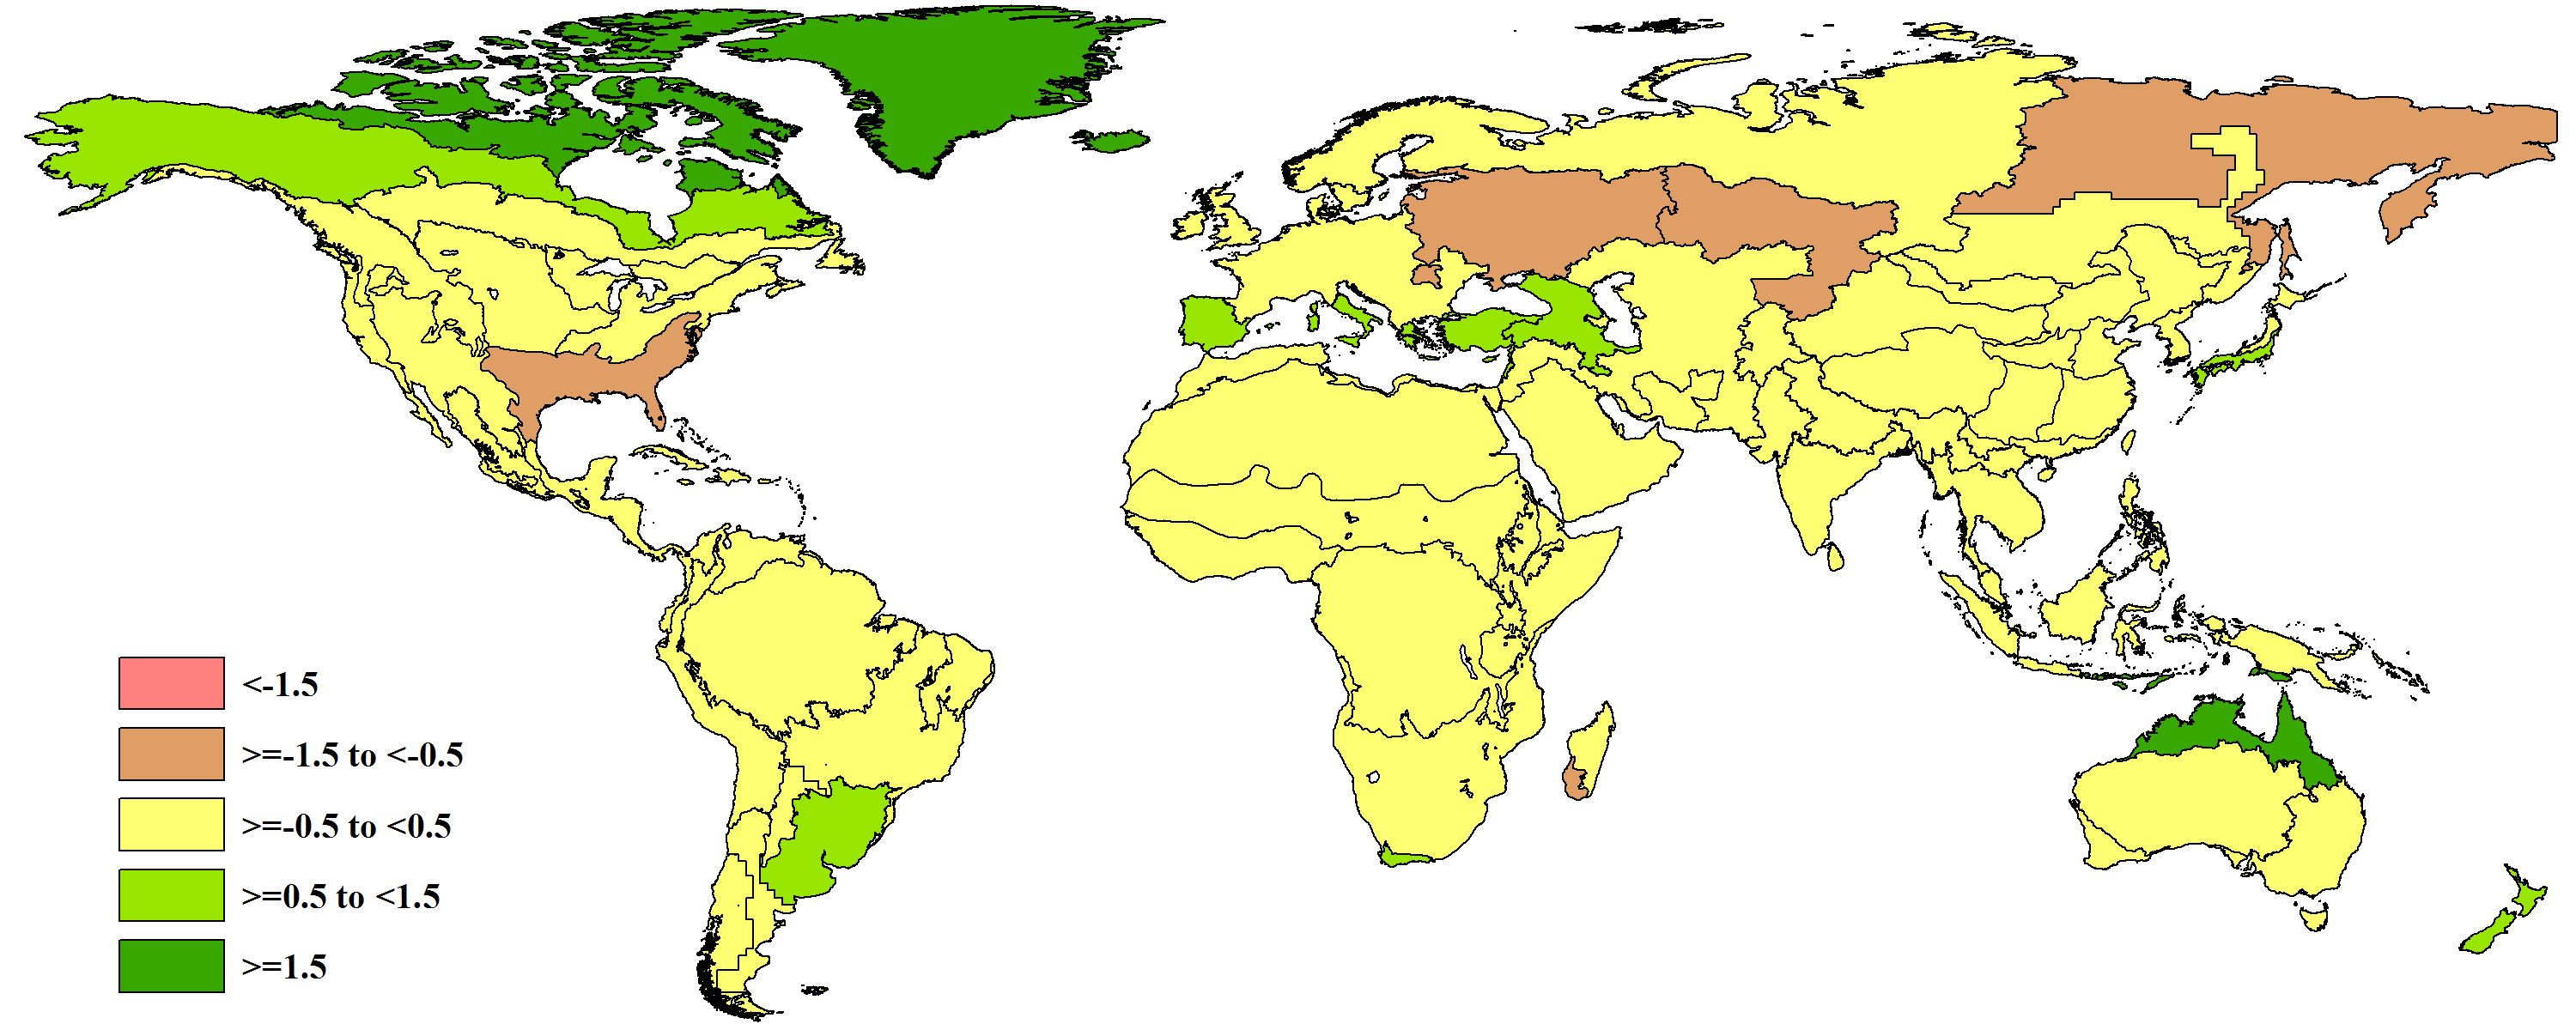
Relatively low temperature (departure in excess of -0.5°C) was recorded in eastern Europe and western Russia (MRU-58, Ukraine to Ural mountains, TEMP -0.6°C) and the neighboring MRU-62, Urals to Altai mountains (MRU-62, -0.9°C), which covers parts of Russia and Kazakhstan. Eastern Siberia (MRU-51, -0.7°C) is part of the same general area but can be ignored as it is not relevant for agriculture. Southwest Madagascar (MRU-06, -0,8°C) was already mentioned because the area was unusually dry.
The last “cool” area to mention is the North American Cotton Belt and Mexican Nordeste (MRU-14) with a temperature 0.7°C below average. In adjacent areas temperature deficits were less marked, for instance in MRU-17 (Sierra Madre), MRU-18 (Southwest United States and North Mexican highlands), and MRU-12 (northern Great Plains).
Above average, but not excessively so, TEMP was recorded in part of eastern Asia, culminating in MRU-46 (Southern Japan and the southern fringe of the Korea peninsula, +1.3°C). More significant warm weather is to be mentioned for northern Australia (MRU-53, +1.5°C), New Zealand (MRU-56, +0.7°C), Mediterranean South Africa (MRU-10, Western Cape, +0.9°C), the Pampas in South America (MRU-26, +1°C), the northern Mediterranean and Turkey in Europe (MRU-59, +1.4°C), and the adjacent area to the east, the Caucasus (MRU-29, +0.6°C). Several of the listed areas also experienced below average RAIN (New Zealand, the Caucasus, the western Cape province in South Africa, and the Mediterranean countries in Europe).
1.4 Solar Radiation
As mentioned, global radiation patterns show little resemblance to other 2017 CropWatch indicators, and this year’s spatial variability is rather different from the one observed in 2016. In addition, the average departure from normal reached -3.4 percent in 2017 (compared to -1.4 percent in 2016), which is significant considering that sunshine tends to be much less variable spatially compared to for example RAIN and TEMP. In 2017, the extreme departures were -12 percent and +5 percent (against -8 percent and +7 percent last year).
In 2017, as also shown by Figure 4, the majority of MRUs recorded below average solar radiation at ground level, with only few areas recording close to average values: MRU-64 (Sahara to the Afghan desert) to MRU-62 (Ural to Altai mountains) across MRU-30 (the Pamir Area) and MRU-31 (Western Asia). The East African Highlands (MRU-02) can be added to the area. Above-average sunshine occurred in three disjointed areas, most noticeably in (1) MRU-59 (Mediterranean Europe and Turkey, RADPAR, +3 percent) and MRU-29 (Caucasus, +5 percent), two areas that also had record temperature; (2) MRU-42 (Taiwan, +4 percent) and (3) MRU-47 (Southern Mongolia, +2 percent).
Figure 1.4. Global map of July-October 2017 PAR anomaly (as indicated by the RADPAR indicator) by MRU, departure from 15YA (percentage)

The majority of the largest deficits occur in Asia, more specifically in China: Huanghuaihai (MRU-34, RADPAR -12 percent), the Loess region (MRU-36, -11 percent), Southwest China (MRU-41, -10 percent), Lower Yangtze (MRU-37, -8 percent), Southern China (MRU-40, -7 percent), Gansu-Xinjiang (MRU-32, -6 percent), and Inner Mongolia (MRU-35, -6 percent). The remaining Asian areas include southern Japan and the southern fringe of the Korea peninsula (MRU-46, -8 percent), the Southern Himalayas (MRU-44, -6 percent), and Maritime Southeast Asia (MRU-49, -9 percent).
Remaining low sunshine areas include MRU-56 (New Zealand, RADPAR -10 percent) and MRU-55 (Nullarbor to Darling, -6 percent) in Oceania as well as, in central and southern America, MRU-25 (central-north Argentina, -9 percent), MRU-22 (Brazilian Nordeste with -8 percent), MRU-27 (Western Patagonia, -8 percent), and MRU-26 (the Pampas, with a RADPAR of -6 percent).
1.5 Biomass production potential BIOMSS and combinations of anomalies
The section leaves out high latitude areas that are of limited agricultural significance. Due to the large sunshine anomalies, it is unlikely that the positive effect of rainfall has been realized in areas with abundant precipitation.
For this reporting period, the areas that are characterized by the most unfavorable combination of high rainfall, usually low temperature, and low RADPAR, are almost all located in China. They include Gansu-Xinjiang (MRU-32, RAIN +97 percent; TEMP -0.4°C compared with normal; and RADPAR -6 percent), Huanghuaihai (MRU-34, +36 percent; +0.1°C; -12 percent respectively), Loess region (MRU-36, +28 percent; +0°C; -11 percent), Southern China (MRU-40, +17 percent; -0.2°C; -7 percent), and Inner Mongolia (MRU-35, +70 percent; -0.1°C; -6 percent), followed by three more regions, namely Southwest China (MRU-41), Northeast China (MRU-38), and the Lower Yangtze region (MRU-37) where rainfall exceeded average by 10 to 20 percent, while temperature was slightly below average and RADPAR varied between anomalies between -3 percent and -10 percent.
Figure 1.5. Global map of July-October 2017 biomass accumulation (BIOMSS) by MRU, departure from 5YA (percentage)

Four more MRUs in Asia deserve mentioning for similar conditions of excess precipitation (RAIN, +20 to +25 percent), TEMP slightly below average (up to -0.5°C), and markedly poor sunshine (RADPAR between -3 to -9 percent)). These are MRU-52, Eastern Central Asia; MRU-48, Punjab to Gujarat; MRU-44, Southern Himalayas; and MRU-49, Maritime South-east Asia.
Elsewhere, similar conditions prevailed essentially in MRU-58, Ukraine to Ural mountains.
Dry and warm areas occurred essentially in four general regions, including:
- The Mediterranean and the Caucasus. This includes Mediterranean Europe and Turkey (MRU-59, with RAIN, -44 percent; TEMP, +1.4°C); North Africa-Mediterranean (MRU-07, with RAIN -42 percent but average TEMP); and the Caucasus (MRU-29, RAIN, -30 percent and TEMP, +0.6°C).
- Parts of Oceania. Including Queensland to Victoria (MRU-54, RAIN, -15 percent; TEMP, +0.3°C), Nullarbor to Darling (MRU-55, RAIN, -42 percent, with average temperature), and New Zealand (MRU-56, RAIN, -46 percent and TEMP, +0.7°C).
- Parts of the American continent. The United States and Canadian West Coast (MRU-16, RAIN, -22 percent and TEMP, +0.3°C) and the Central-northern Andes (MRU-21, with RAIN -19 percent and TEMP, +0.2°C).
- Southern Africa. Western Cape (MRU-10), with RAIN -74 percent and TEMP +0.9°C.
References
De Paola F, Giugnia M, 2013. Coupled spatial distribution of rainfall and temperature in USA. Prog Environ Sci 19:178–187. doi:10.1016/j.Proenv 2013.06.020
Gommes R, Wu B, Zhang N, Feng X, Zeng Hi, Li Z, Chen B, 2016. Cropwatch agroclimatic indicators (CWAIs) for weather impact assessment on global agriculture. Int. J. Biometeorol. doi:10.1007/s00484-016-1199-7.
Guo, Z.T., N. Petit-Maire, and S. Kropelin, 2000. Holocene non-orbital climatic events in present-day arid areas of Northern Africa and China. Global Planet. Change, 26(1-3):97-103.
Petit-Maire N and Bouysse P, 2000. Geological records of the recent past a key to the near future world environments. Episodes 23(4):230–246.
Petit-Maire, N. 1999. Variabilité naturelle des environnements terrestres : les deux derniers extrêmes climatiques. CR. Acad. Sci. Paris, Sciences de la terre et des planètes, 328:273-279.
Sachs J and C L Myhrvold, 2011. A shifting band of rain. Scientific American, 3:60-65
Spaulding WG, 1991. Pluvial climatic episodes in North America and North Africa: types and correlation with global climate. Palaeogeogr Palaeoclimatol Palaeoecol 84(1–4):217–227