
 English
 中文
中文
Bulletin
CropWatch bulletinMenu
Authors: 超级管理员 | Edit: tanshen
2.3 North America
The reporting period (July to October, 2017) is the harvesting season of summer crops (maize, soybean, spring wheat, and rice) and the sowing season of 2017/18 winter crops. In general, poor crop condition was recorded in the south of the Canadian Prairies and some regions of the U.S. Northern Plains, while average or above average crop condition occurred in other regions.
For the region as a whole, moist weather occurred in North America, where rainfall (RAIN) was 11% above average, while temperature was slightly below by 0.4°C and RADPAR by 2%, which is more significant for this indicator. Drought was confined to Manitoba (RAIN, -20%) and Saskatchewan (RAIN, -23%) where the temperature was 2°C to 3°C above average at the beginning of July and in late August, resulting in -17% and -19% decreases in the indicator for the biomass accumulation potential (BIOMSS), respectively.
Drought conditions ended in the Northern Great Plains because abundant rainfall (RAIN, +35%) occurred in mid-July and in August and October. The U.S. Corn Belt, the major maize and soybean producing area in the world, recorded average rainfall and temperature. Normal rainfall was also reported from the Cotton Belt to the Mexican Nordeste region. It is worth noting that abnormally low temperature occurred in the eastern part of North America in late August and early September.
Poor crop condition in the southern Canadian Prairies and some regions of the U.S. Northern Plains is confirmed by maximum VCI (VCIx) and the BIOMSS departure map. In the south of Manitoba, Saskatchewan, and in the north of North Dakota and Montana, VCIx was even below 0.5, which indicates rather poor crops. Drought and warm weather are confirmed by the VHIn and resulted in a decrease of at least 20% for BIOMSS. Other agronomic indicators are average, in particular the Cropped Arable Land Fraction (CALF).
Altogether, CropWatch identified some poor crop condition in parts of Canada and the U.S. Northern Plains, while average and above average conditions prevail elsewhere.
Figure 2.2a. North America MPZ spatial distribution of rainfall profiles (left) and profiles of rainfall departure from average (mm) (right), July-October 2017
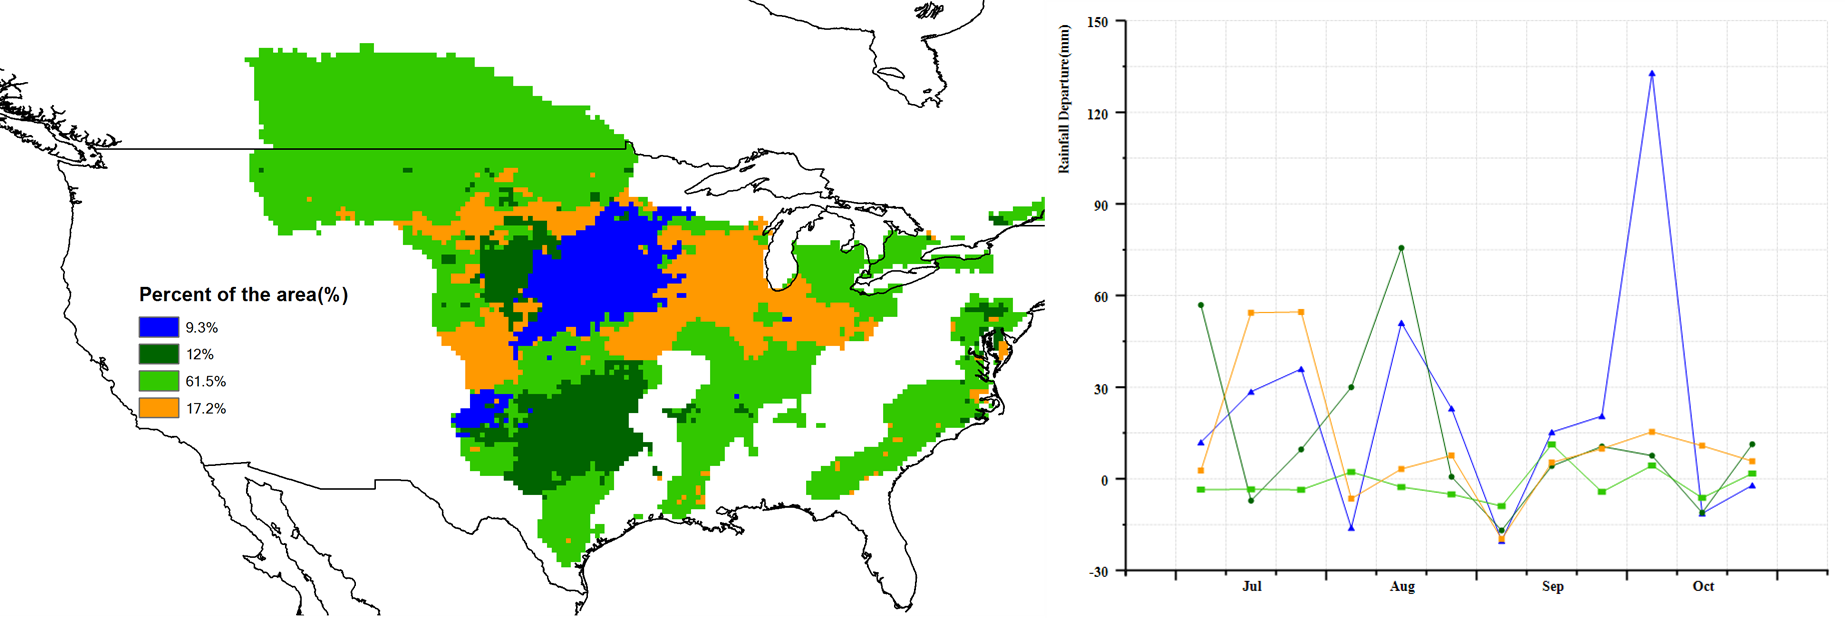
Figure 2.2b. North America MPZ spatial distribution of temperature profiles (left) and profiles of temperature departure from average (℃) (right), July-October 2017
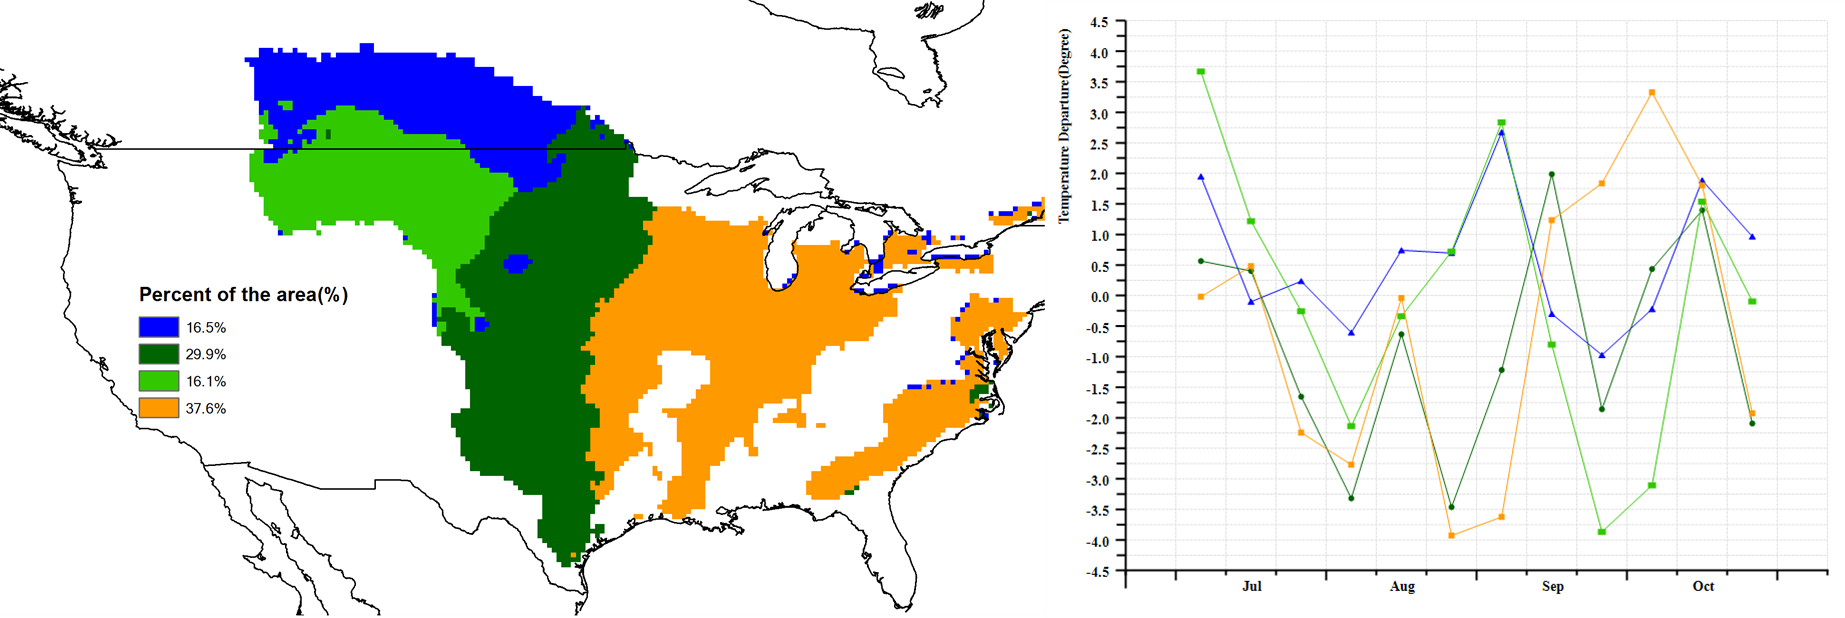
Figure 2.2c. North America MPZ maximum VCI, July-October 2017

Figure 2.2d. North America MPZ cropped and uncropped arable land, July-October 2017
Figure 2.2e. North America MPZ biomass accumulation potential departure, July-October 2017
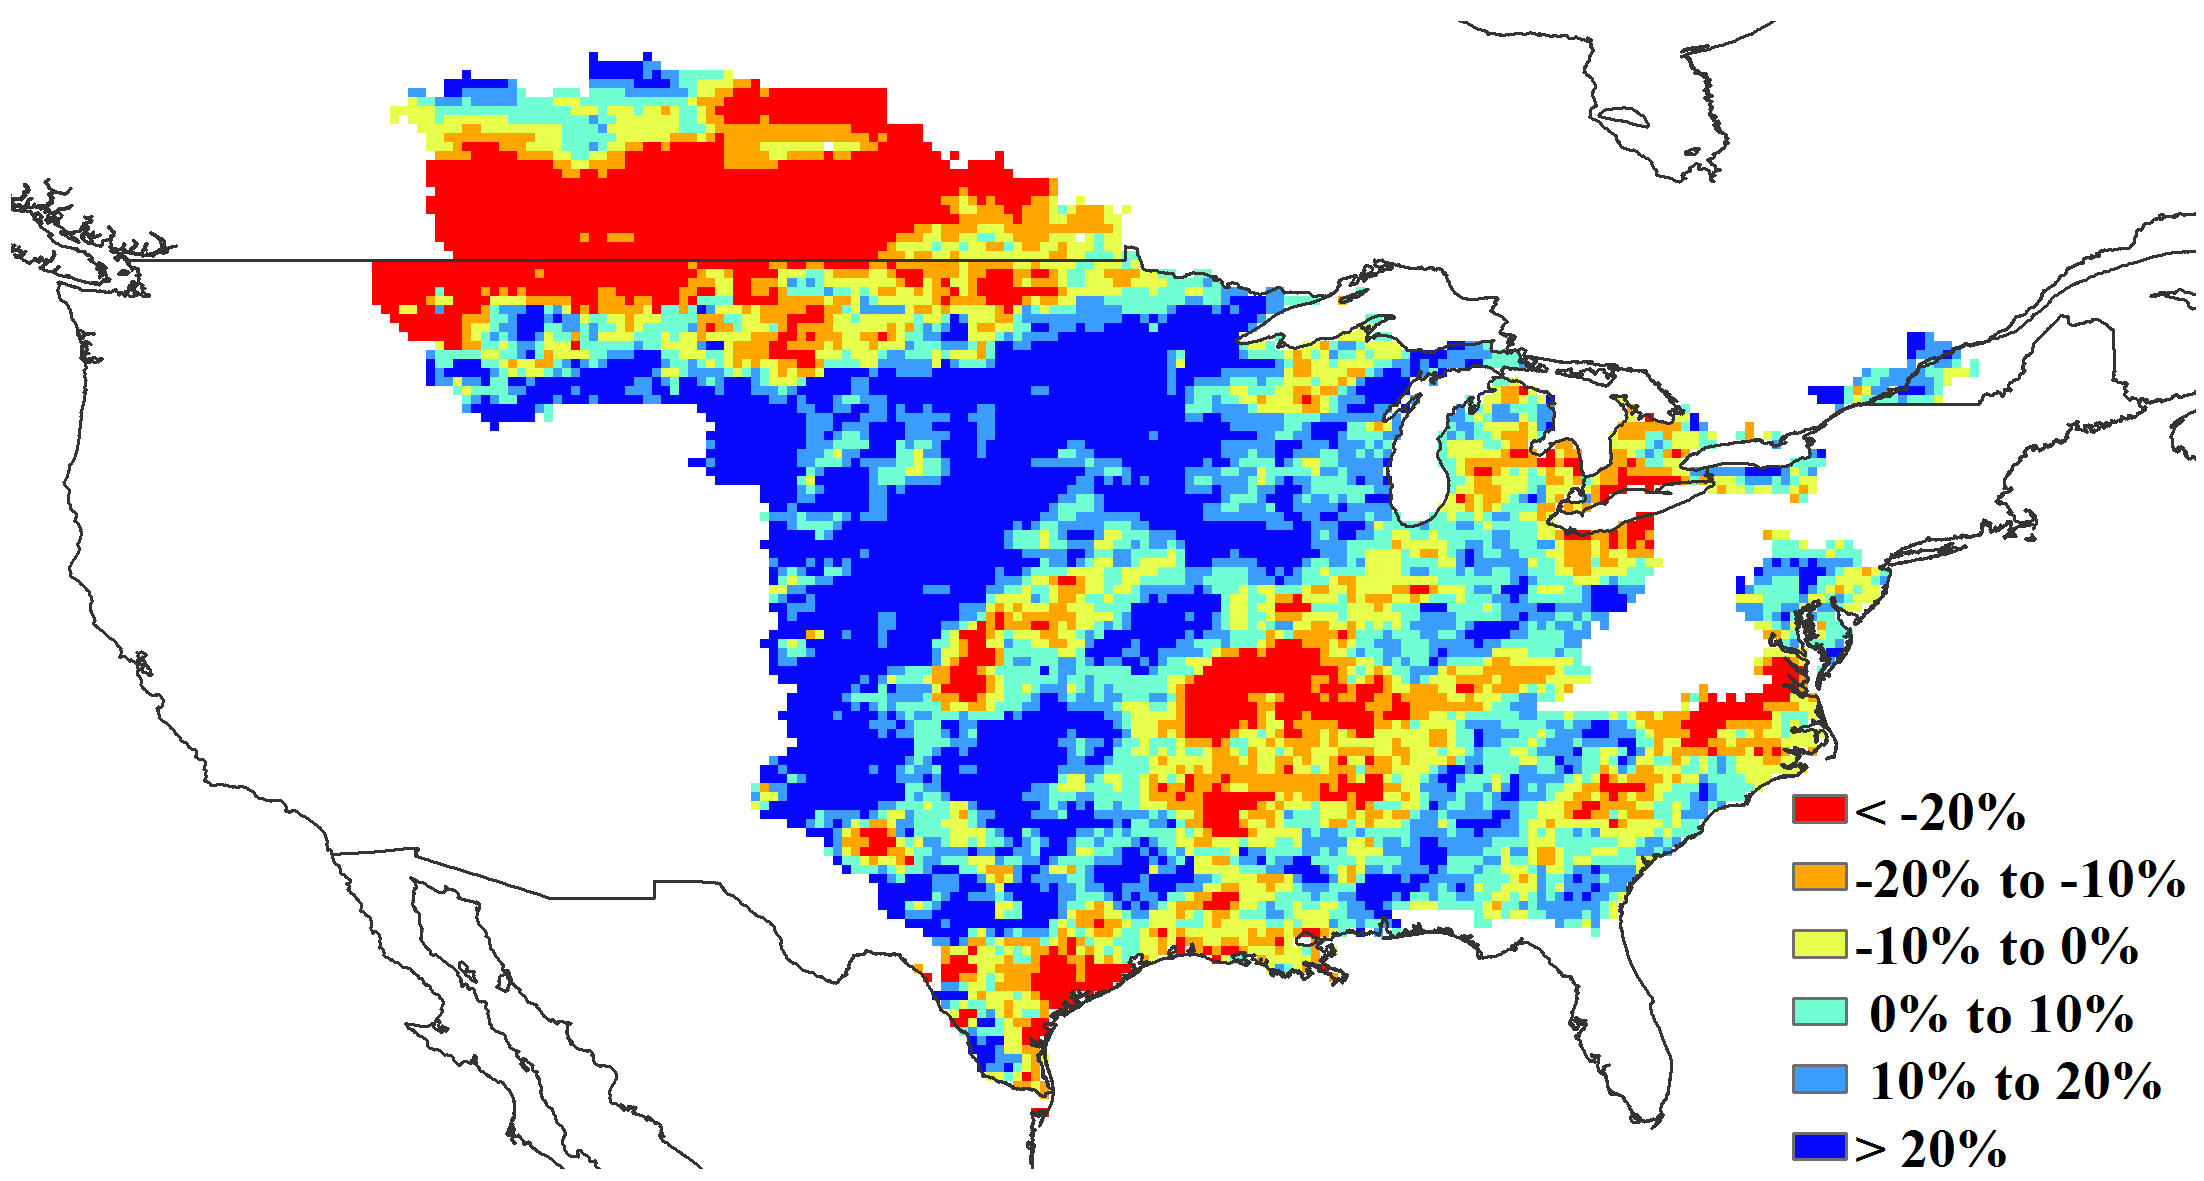
Figure 2.2f. North America MPZ VHI minimum, July-October 2017
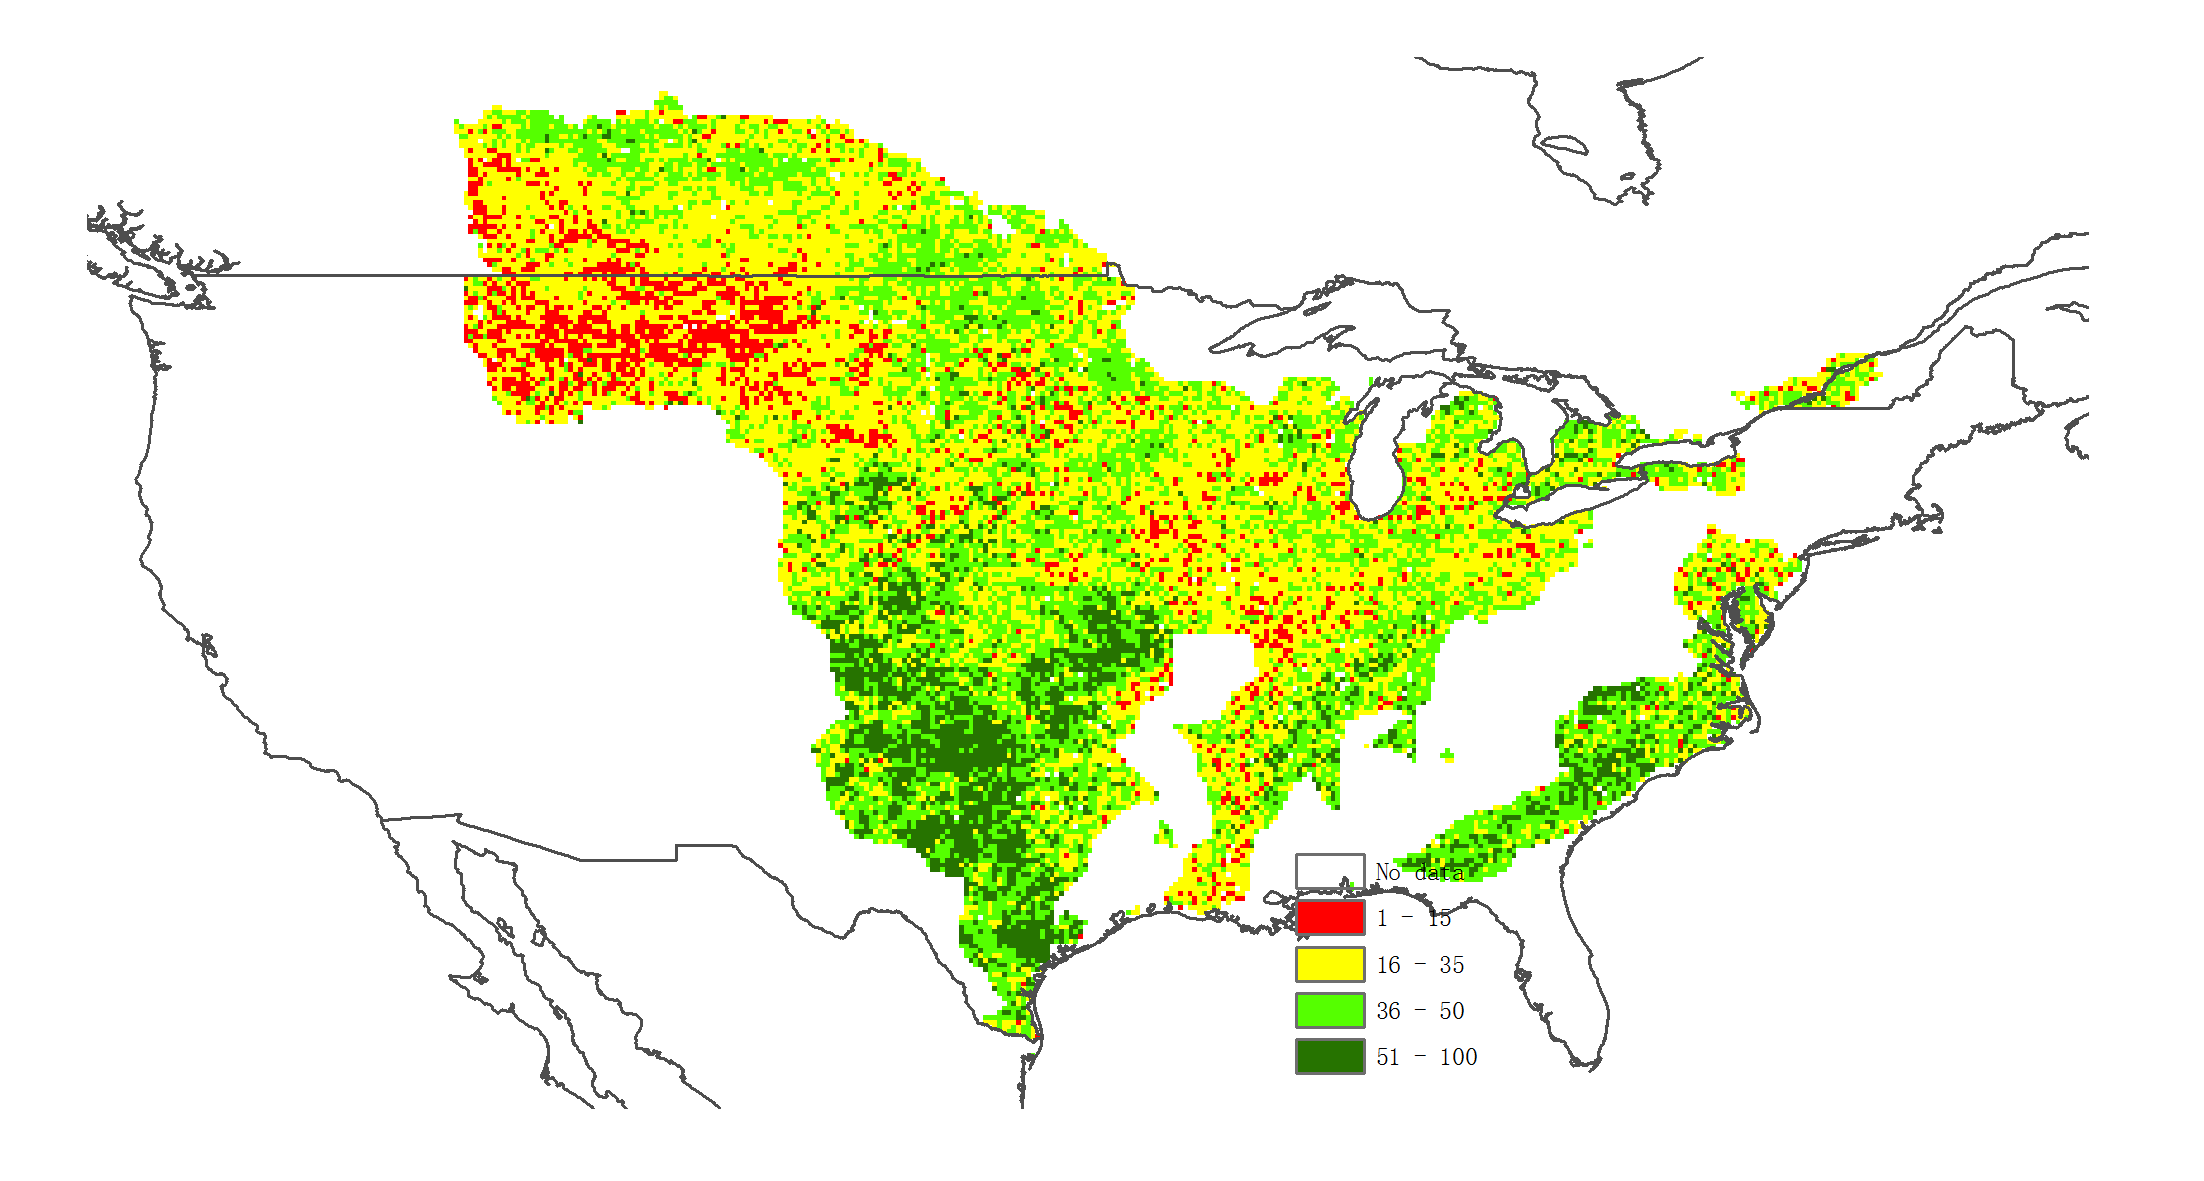
Figure 2.2g. North America MPZ cropping intensity, November 2016-October, 2017
