
 English
 中文
中文
Bulletin
CropWatch bulletinMenu
Authors: 超级管理员 | Edit: tanshen
Chapter 3. Main producing and exporting countries
3.1 Overview
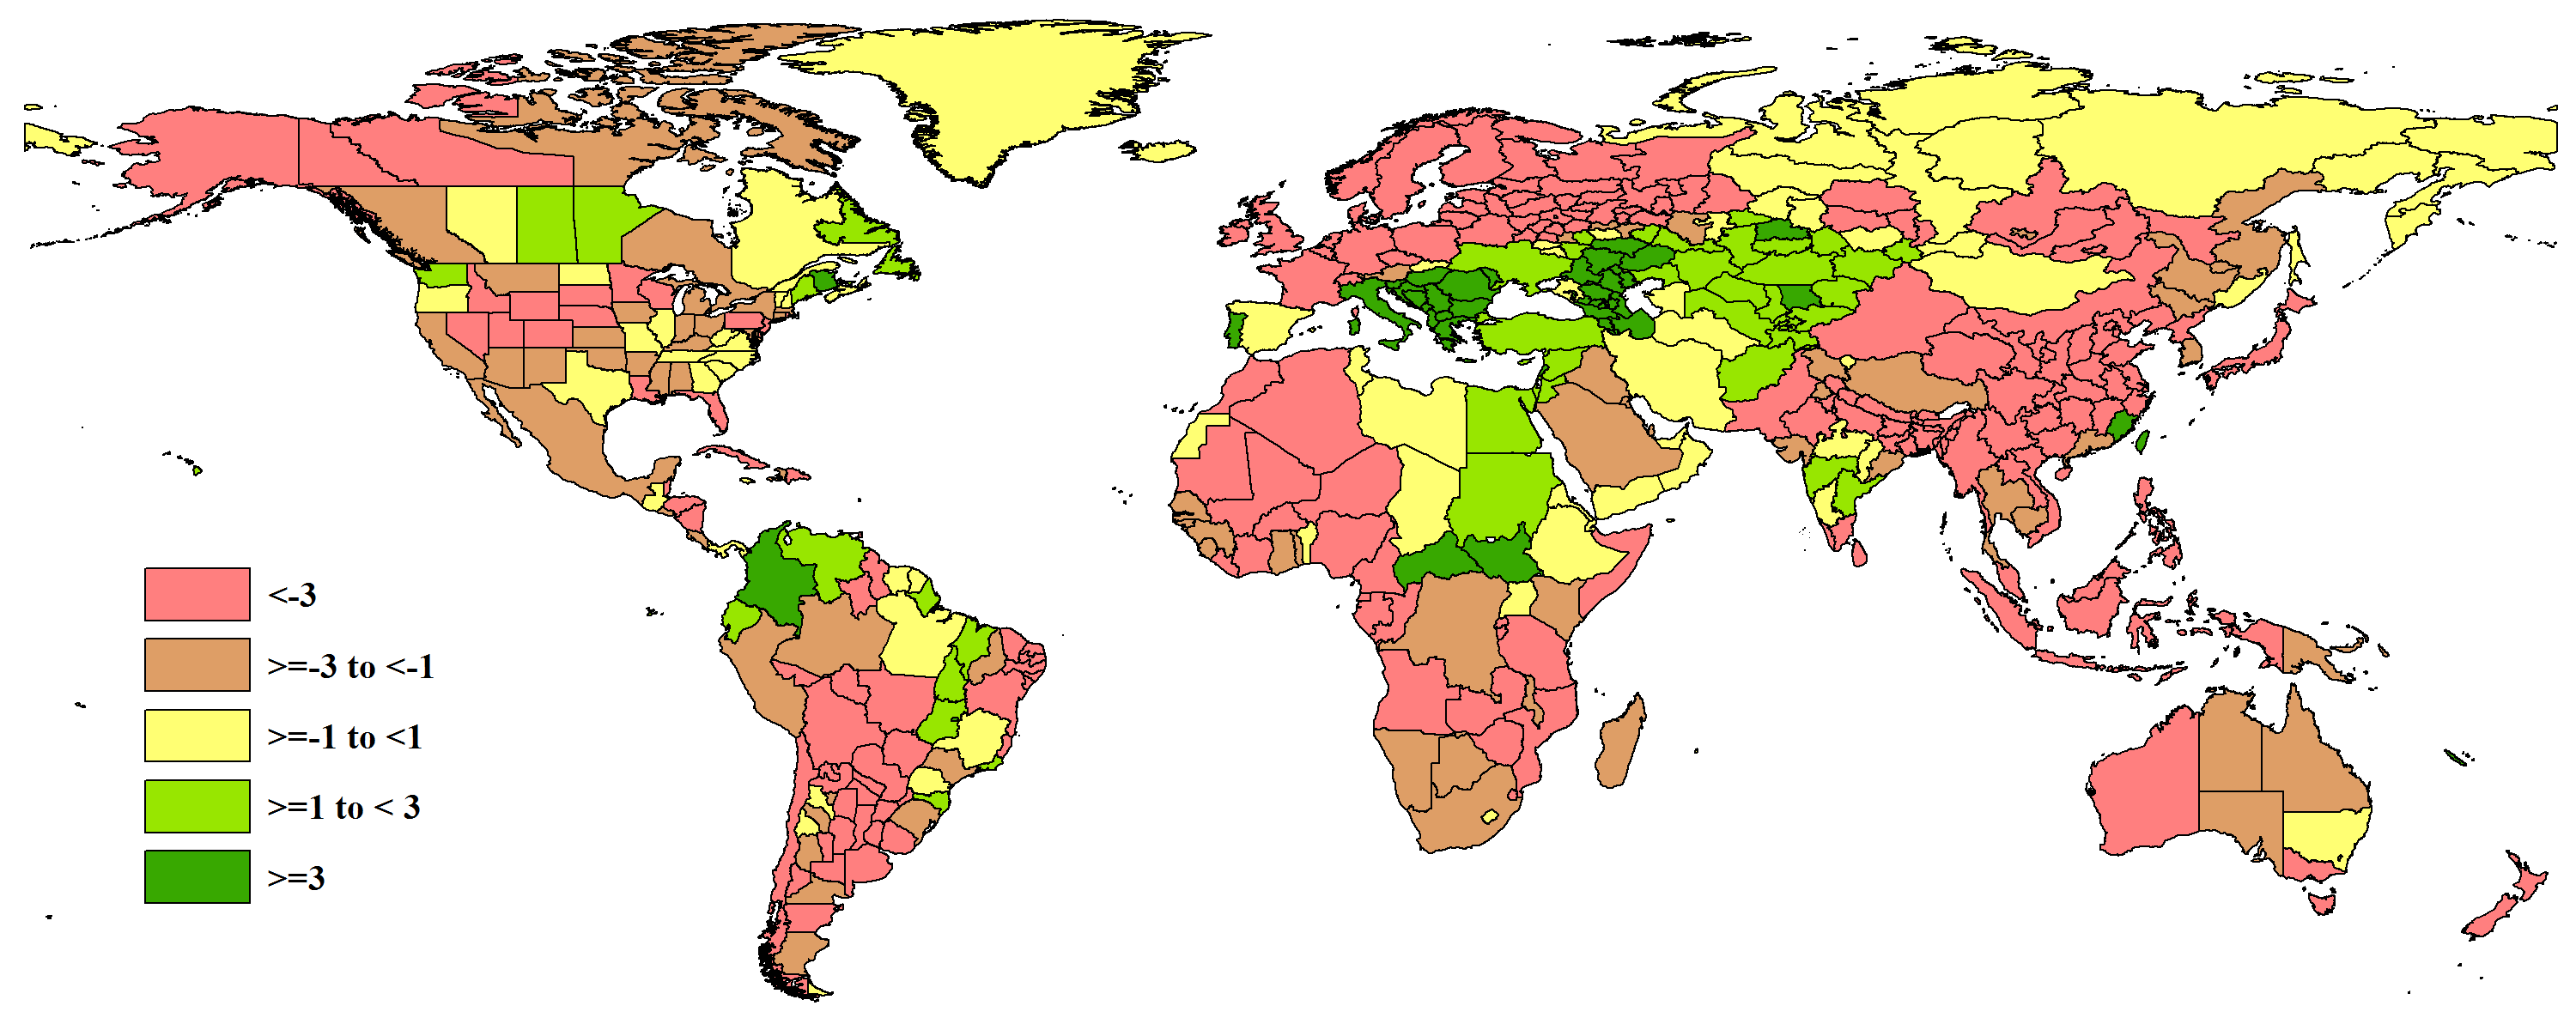
The global agroclimatic patterns that emerge at the level of the Measuring and Reporting Units (MRU) described in Chapter 1 are reflected with greater spatial detail at the national and sub-national administrative levels, which is the focus of this chapter (see figures 3.1-3.4). The 30 major producing and exporting countries are all the object of a specific and detailed narrative in the later sections of this chapter, while China is covered in Chapter 4. Sub-national units and national agro-ecological zones receive due attention in this chapter.
In many cases, the situations listed in this overview are also mentioned in the section on disasters in Chapter 5. Disaster situations, however, tend to be limited spatially, so that the statistical abnormality is not necessarily reflected in the climate statistics that include larger areas. Examples include Hurricane Harvey in Texas, Cyclone Ophelia in Ireland, or floods in Peru that occurred while the whole country experienced a precipitation deficit. In contrast, when extreme conditions affect a large area, they are bound to have been even more extreme in some locations.
Figure 3.1. Global map of July-October 2017 rainfall (RAIN) by country and sub-national areas, departure from 15YA (percentage)
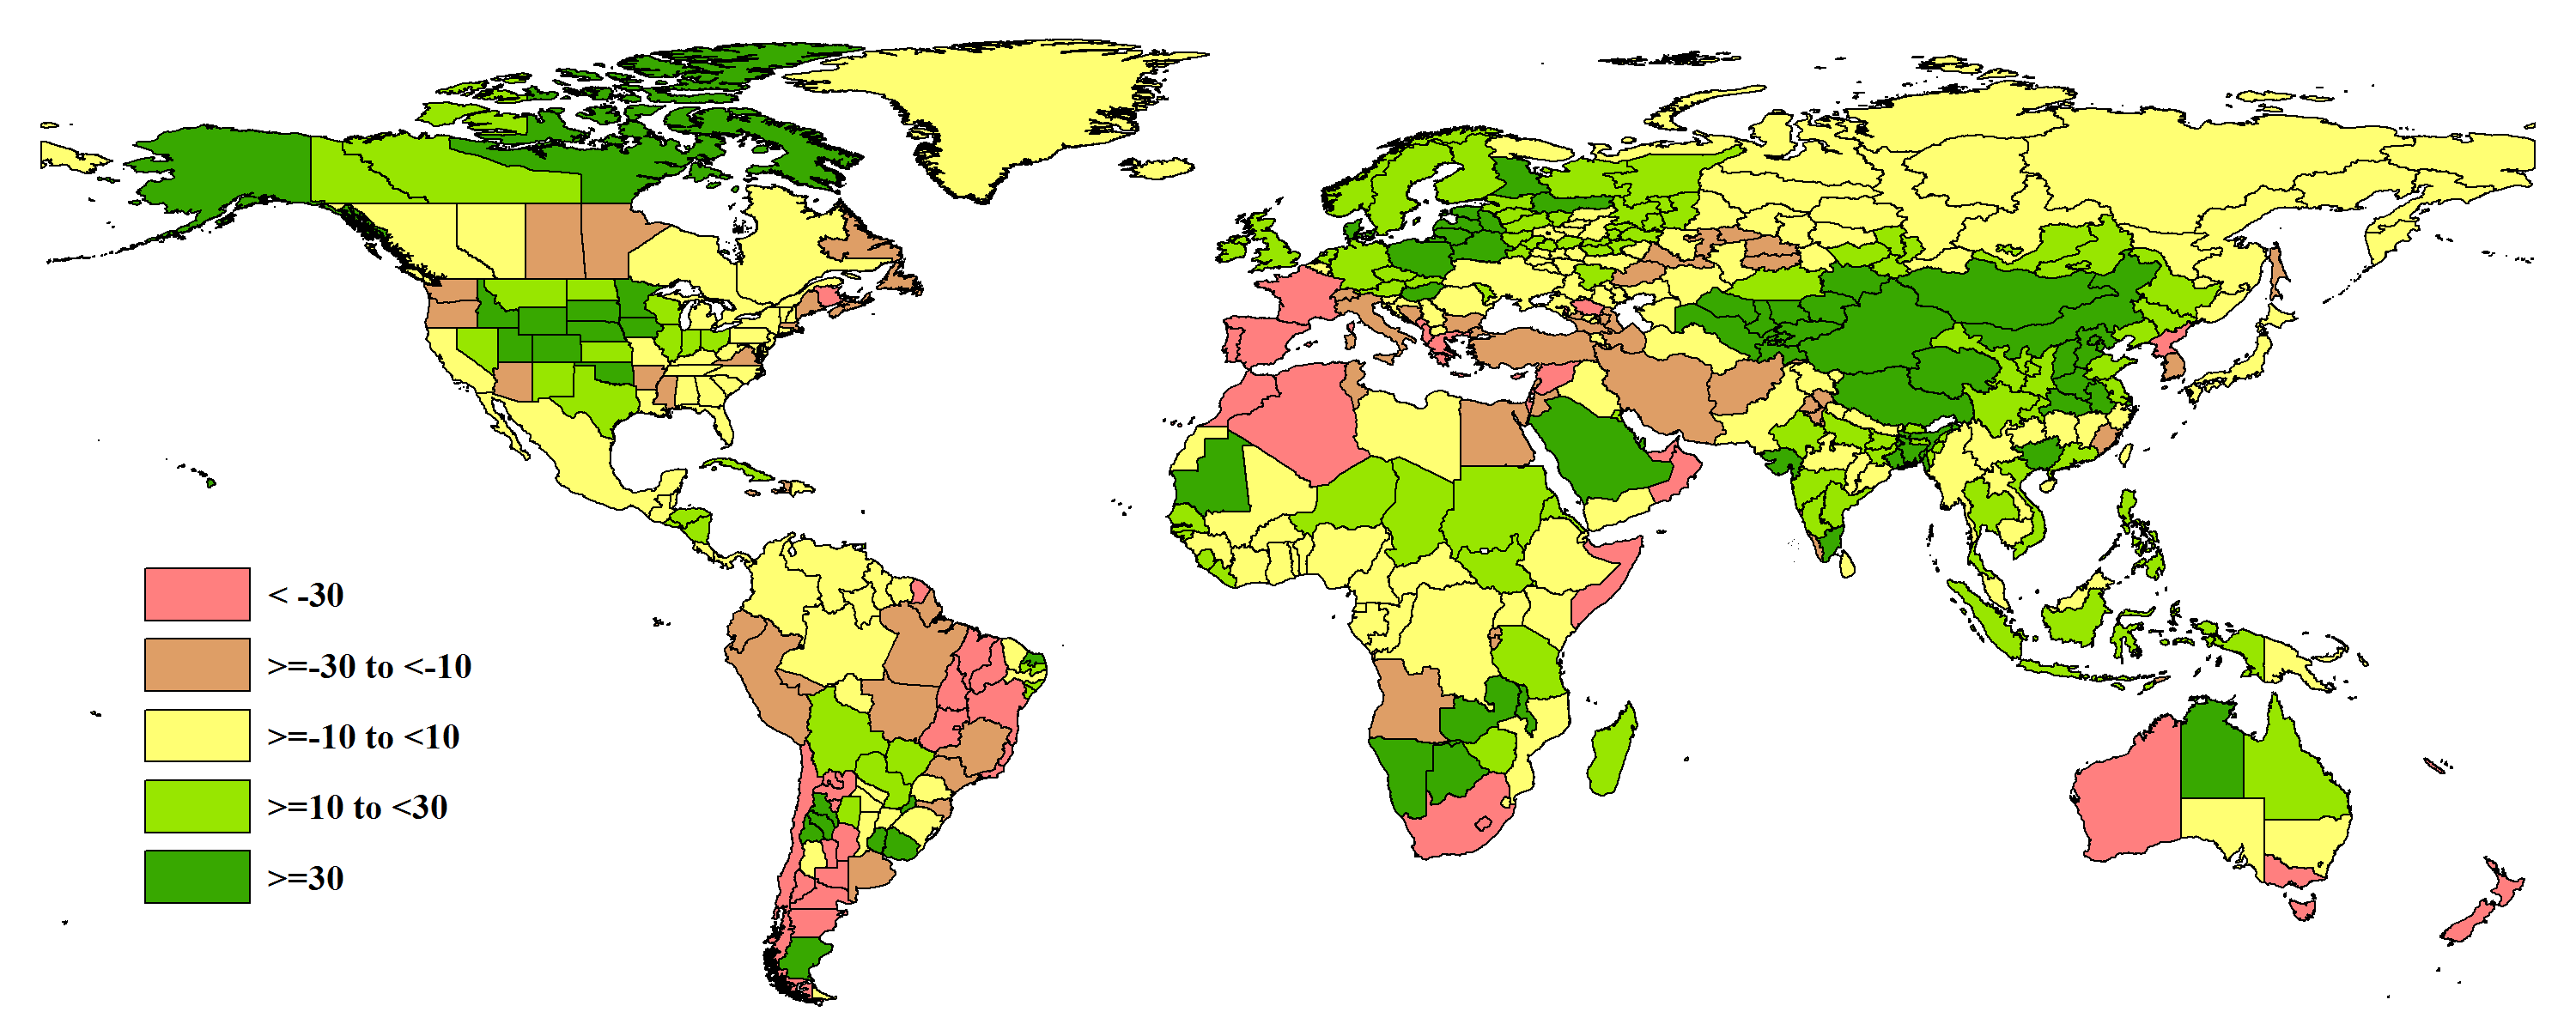
Figure 3.2. Global map of July-October 2017 temperature (TEMP) by country and sub-national areas, departure from 15YA (degrees)
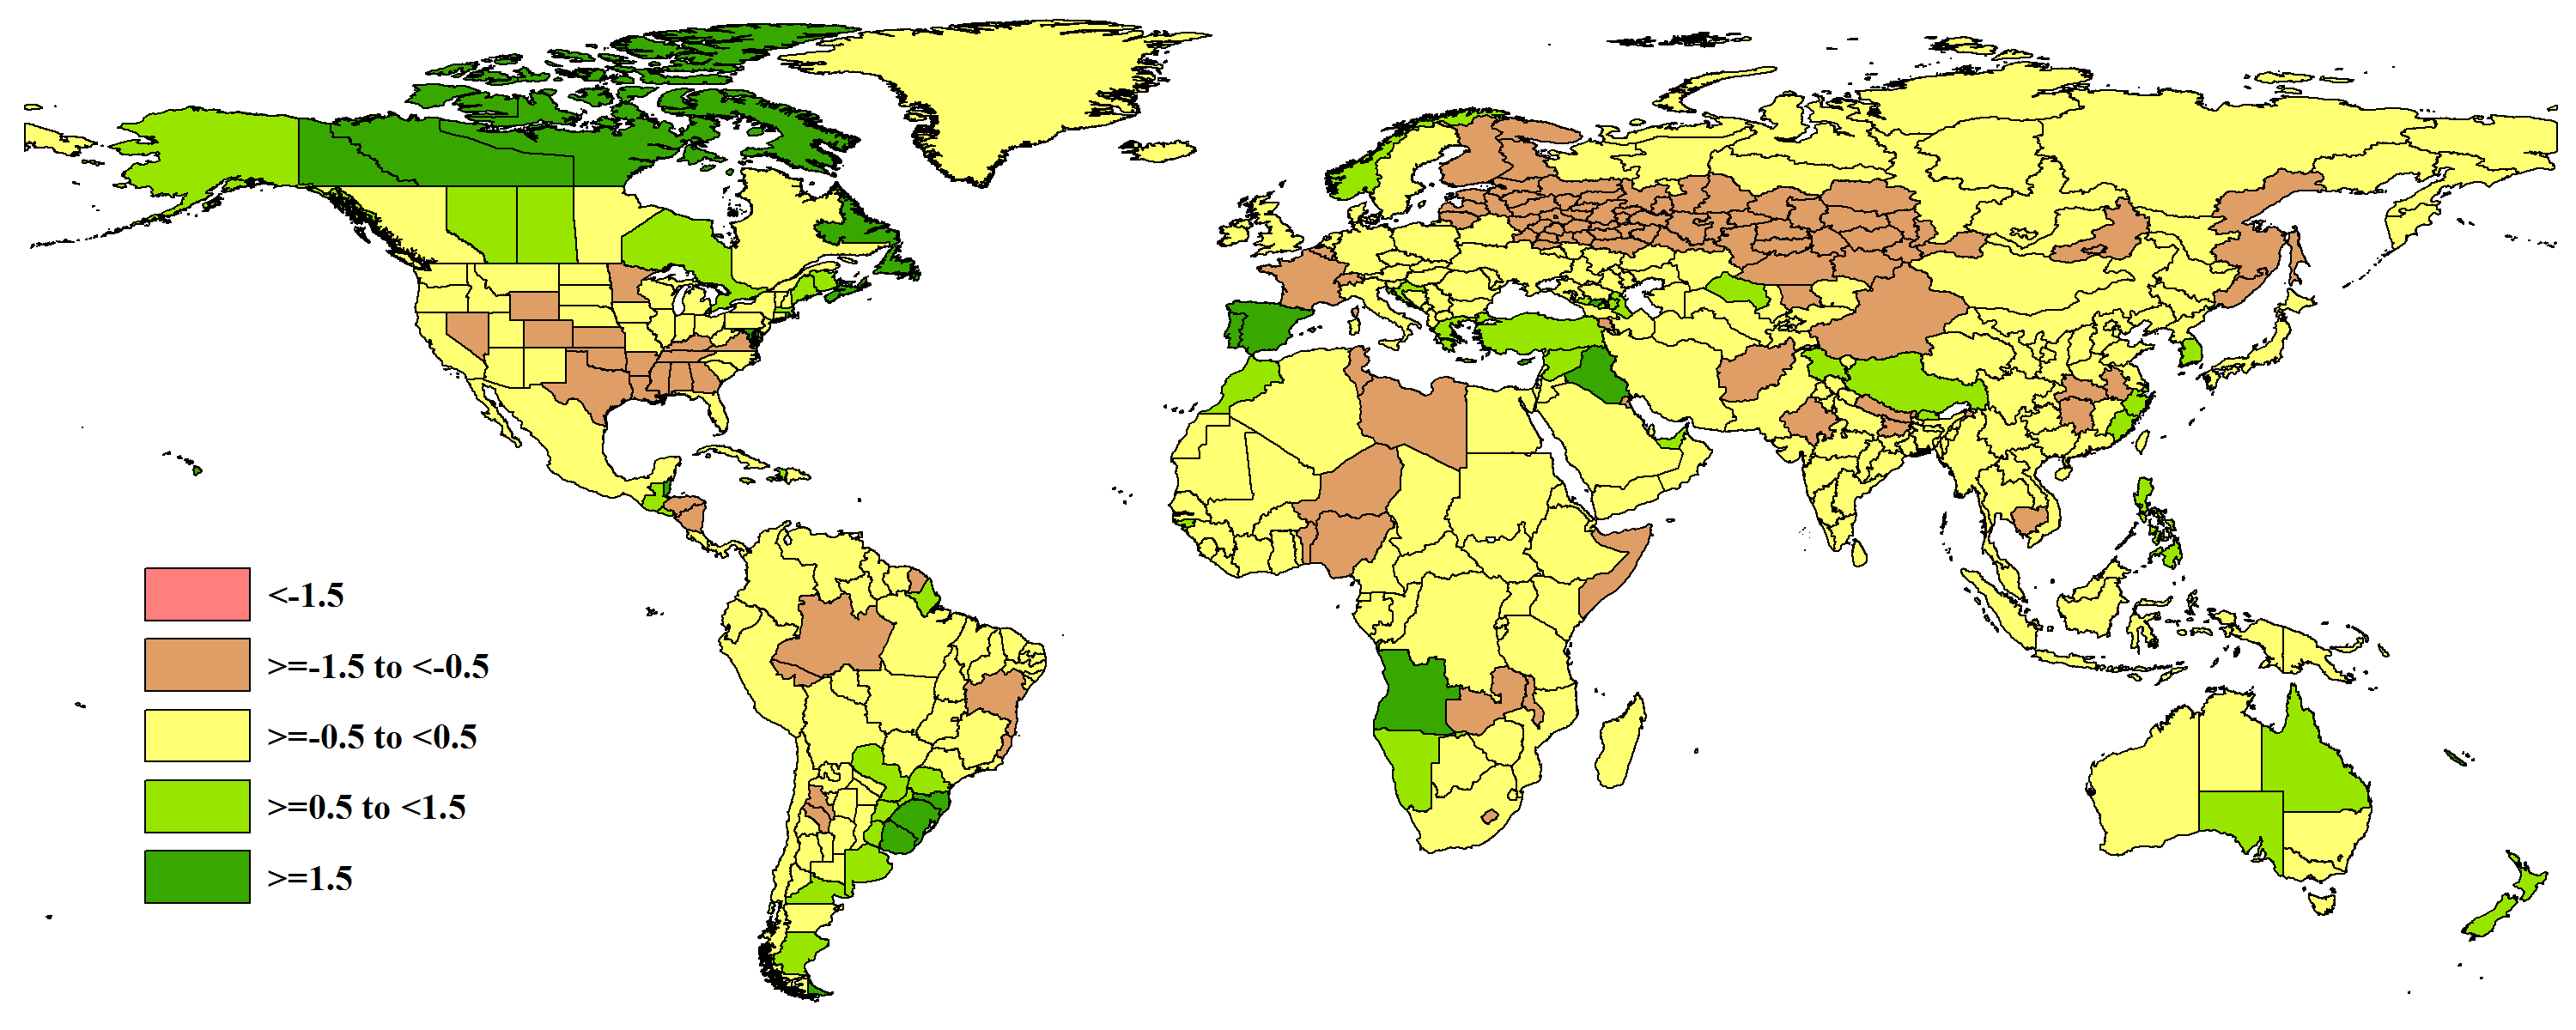
Figure 3.3. Global map of July-October 2017 PAR (RADPAR) by country and sub-national areas, departure from 15YA (percentage)

Figure 3.4. Global map of July-October 2017 biomass (BIOMSS) by country and sub-national areas, departure from 5YA (percentage)
Countries with excess precipitation
Excess precipitation in a location can be meaningful depending on the timing of the reporting period relative to the agricultural season, which for both rangeland and cropland centers on the peak of biomass production and directly relates to average precipitation, at least in areas where rainfall tends to be limiting. For example, among the countries with more than 50% excess precipitation is Namibia. Over the reporting period, however, Namibia was in its dry season, which is characterized by an average rainfall of just 17 mm over four months. The recorded RAIN departure for Namibia of 51% (corresponding to an amount of 26 mm) thus is not so spectacular as it may seem, while no doubt benefiting rangelands and cattle during the winter dry season. It is, for instance, far less significant than a 55% increase in Mongolia (346 mm instead of the average of 223) at a time when temperature is high (summer) and livestock needs the biomass. A situation similar to that of Mongolia occurred in other central Asian countries such as Tajikistan (RAIN +51%), Kyrgyzstan (+71%), and Uzbekistan (+92%). In the south of Africa, high positive rainfall departures also occurred in Zambia (+64%), which is less arid than Namibia, and especially Malawi (+68%). Both countries are now entering their main agricultural season (October-March) and the early rain will have been beneficial for the future maize crop by replenishing soil moisture, still low from the recent El Niño drought period.
The mentioned groups of countries are part of two of a total of five excess precipitation areas, with these first two areas encompassing (1) a stretch of land in central and southern Asia from Uzbekistan to the Chitinsky Oblast and Heilongjiang region in China, covering most of southeast and southern Asia and bordered in the west by Gujarat and Rajasthan; and (2) a region in southern Africa from Tanzania (+15%) to Namibia (+51%). A third area with excess precipitation includes (3) a region covering much of the Sahel from Senegal, Sierra Leone, and Liberia (all in the range from 12-15% increased rain) to the Sudan (+25%) and South Sudan (+14%), where rainfall was particularly favorable in Mauritania (601 mm, equivalent to +33%). For the countries in this third region the reporting period covers the peak to the end of the rainy and main cropping season.
The last two excess precipitation areas are in Europe and North America. In Europe, a stark contrast exists between the dry Mediterranean south and the high precipitation area. This fourth area (4) includes middle and northern Europe (Ireland +25% to Hungary +32% to the Komi Republic in Russia), with at its heart Poland (+55%) and the Baltic states. Most of the countries in this group had slightly below average temperature in the range of -0.5°C and well-below average sunshine (-9% and more in most of central-western Europe) along a south-north gradient (RADPAR -17% in Finland). Finally, in the fifth and last high precipitation area in (5) central North America, affected regions include mostly the Corn Belt (+29%) and the Northern Plains (+59%) where other weather variables were average.
Deficit precipitation and heatwave areas
Five areas can be identified for their large and general deficits in precipitation; the areas are described below and listed as (1)-(5). Many of those areas were affected by large-scale fires, often accompanied by above-average temperature, and many of them are listed again in the section on disasters in Chapter 5. When temperature was particularly high, it is mentioned after the rainfall departure from normal.
The largest precipitation deficit area (1), both in terms of extent and severity, includes at least twenty-five countries located around the Mediterranean in Europe and Africa and extends east as far as northern India. The timing of the drought here corresponds to the very last stages of winter crops as well the maximum of the vegetation period for summer crops, which have suffered in non-irrigated areas. Drought at the end of the period is likely to have delayed planting and germination of winter crops. The severest precipitation deficits in this area occurred in Portugal (RAIN -84%, equivalent to 27 mm when 169 were expected; +1.5°C), Cyprus (-59%; +1.8°C), and Morocco, Spain (both +2.6°C) and Syria (+1.5°C), all three in the -50 to -60% precipitation deficit range, and also France, Albania, Algeria, Montenegro, and Greece in the -35% to -42% rainfall range, with close to average temperature. Deficits tend to be in the -25% to -30% range in the central-Mediterranean areas (Italy, Bosnia-Herzegovina, Tunisia) and the east (Israel, Iran, Turkey, Egypt, Afghanistan, Georgia, Lebanon, Azerbaijan, Afghanistan, and part of India (Himachal Pradesh, Punjab, and Haryana)). With few exceptions (Tunisia -1.2°C) countries in this area had, again, close to average thermal conditions.
The second region covers (2) parts of the eastern Africa region, where drought has been lasting for two years now. The main deficits are those of Somalia (79mm or -43%) and the two highland countries of Rwanda (150 mm or -27% and Burundi (120mm or -22%). The whole region, including the countries just mentioned, are in a very difficult humanitarian situation (see also Chapter 5) due to large-scale refugee movements. Both Rwanda and Burundi had well below average radiation (RADPAR -7% and -6%, respectively).
A third area (3), the Korean peninsula is also mentioned in Chapter 5's section on disasters due to long-lasting deficits that reached, for the current reporting period, -34% in the Democratic People's Republic of Korea and -21% in the Republic of Korea. Both countries had a weak sunshine deficit (-3% and -2%, respectively), but about average temperature.
Finally, two areas need to be mentioned in America. The fourth precipitation deficit area covers (4) the equatorial east of Brazil, while the fifth includes (5) the west and south of the South American continent. The equatorial east of Brazil area includes some Caribbean Islands (Jamaica -30%, Dominica -28%), but mostly French Guiana (-42%) and, in Brazil, the major agricultural states of Goias (-40%) and Minas Gerais (-40%), followed by several others with deficits slightly larger than 20% (Mato Grosso, Santa Catarina, and São Paulo). In Belize, which belongs approximately to the same area, the temperature was 2.2°C and sunshine was low (-5%). In the other deficit area (the west and south of the South American continent), the drought gradient increases from coastal areas in the north (Ecuador, -22%; Peru -15%) and expands to several of the winter crop and pastoral areas in the Southern Cone to include Chile (-33%) and, in Argentina, the provinces of Cordoba (-37%) and Buenos Aires (-25%). It is stressed that the situation is spatially complex with other areas doing well, such as Entre Rios (RAIN +31%) and Santiago del Estero (+30%). In all the countries listed under (4) and (5), other indicators were roughly average.
The national rainfall deficit record occurred in Oceania in New Caledonia (-84%, 21 mm instead of 131), which also recorded a huge positive temperature departure of 6.7°C. Somewhat similar, but generally less severe, weather prevailed in New Zealand (RAIN -46% and RADPAR -10%, which is very atypical) and in parts of Australia.
Other areas of concern
The CropWatch BIOMSS indicator is based on rainfall and temperature. For the current reporting period, the relative share of the impact of RAIN and TEMP is 9-1, which is to say that BIOMSS anomalies closely follow rainfall anomalies (+/– 10%), unless temperature departures are significant and rainfall is not limiting. This happens mostly in warm climates, as for instance in Nicaragua (RAIN +17%, TEMP -0.8°C, leading to a BIOMSS +4%), Bangladesh (+49%, -0.4°C, BIOMSS +16%), Trinidad and Tobago (+23%, -0.4°C, BIOMSS +7%), and Malawi (+68%, -0,6°C, BIOMSS +18%). The main purpose of this section, however, is to stress again the observation from Chapter 1 according to which sunshine was unusually low in a large number of areas. This is illustrated as well in the RADPAR figure. When considering all the countries, 110 out of 165 experienced a sunshine deficit (67%). When considering the agro-ecological zones of the 30 major agricultural countries that are described later in this section, this percentage turns out to be 68%. For temperate countries and irrigated crops in the tropics, sunshine is usually the main limiting factor.
In conclusion, where yield is the major determinant of production, such as in summer crop areas where hectarage did not change significantly, overall weather conditions, including rainfall, temperature, and sunshine were not conducive to crop production.