
 English
 中文
中文
Bulletin
CropWatch bulletinMenu
Authors: 超级管理员 | Edit: tanshen
Australia
Wheat and barley, the main crops of Australia, are planted mainly from the end of April to July and harvested from October to January. The monitored period thus covers the beginning of their harvesting season. The national NDVI profile shows somewhat below average conditions, mainly in June and July. NDVI, however, was above average in October, compared to the five-year average.
Overall over the reporting period, Australia was short in rainfall with a 15% drop in RAIN, while the country experienced average temperatures and 2% below average radiation. The VCIx was only 0.56 during the reporting period, indicating poor crop condition, especially in the northern part of Western Australia, southeastern parts of New South Wales, and South Australia. This is also reflected by the spatial NDVI profiles at the regional level. CALF decreased by 9% below the recent five-year average.
Regional analysis
This analysis adopts five agro-ecological regions for Australia, namely the Southeastern wheat zone, Southwestern wheat zone, Arid and semi-arid zone, Wet temperate and subtropical zone, and Subhumid subtropical zone.
Crop condition in the Southeastern wheat zone showed basically a below average situation in July and August during the main growing season, although condition returned to average in September and October during the maturation and early harvesting stages. The region experienced an 11% rainfall deficit with average temperature and RADPAR, resulting in a low VCIx of 0.64. CALF decreased by 5%.
The Southwestern wheat zone also shows below average condition according to the regional NDVI profile. The region received 42% below average rainfall and low radiation (RADPAR -6%) with stable temperature. The weather-based potential biomass was 35% lower than its average of the last five years. The CALF decreased by 14%. The situation here is also reflected by the NDVI cluster maps in the Western Australia region, with a similarly low VCIx of 0.66. Crop condition is below average mostly due to low sunshine.
Crop condition based on NDVI profiles was below average in the Arid and Semi-arid zone. The region recorded sufficient rainfall, but temperature exceeded average by about 1.3°C and RADPAR was average. The weather based potential biomass (BIOMSS) was about 23% above average. However, the CALF of 0.51 indicates a rather low cropped area.
Next, crop condition in the Wet Temperate and Subtropical Zone was above average according to the regional NDVI profile. The region was 9% deficient in rainfall and with a slight positive temperature departure (+0.5°C) and average radiation. BIOMSS was 20% below its five-year average. CALF reached almost 1 (0.99), while VCIx was low (0.39), indicating a high cropped area but very poor crop condition.
The Subhumid subtropical zone showed below average condition during the monitored period based on NDVI. The region was 12% deficient in rainfall, 0.5°C warmer than average, and with average RADPAR. The weather based potential biomass displays a 9% decrease. Just like the arid and semi-arid zone, the area had low CALF (0.48) and presumably a below average cropped area.
On the whole, CropWatch estimates the production of Australia will decrease by 22.1% in 2017, with a decrease in yield by 16.1% and an area decrease by 7.2%, compared with 2016.
Figure 3.6. Australia crop condition, July-October 2017
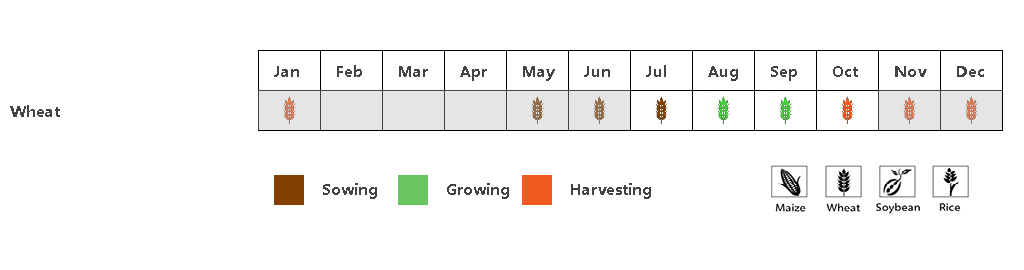 (a) Phenology of major crops
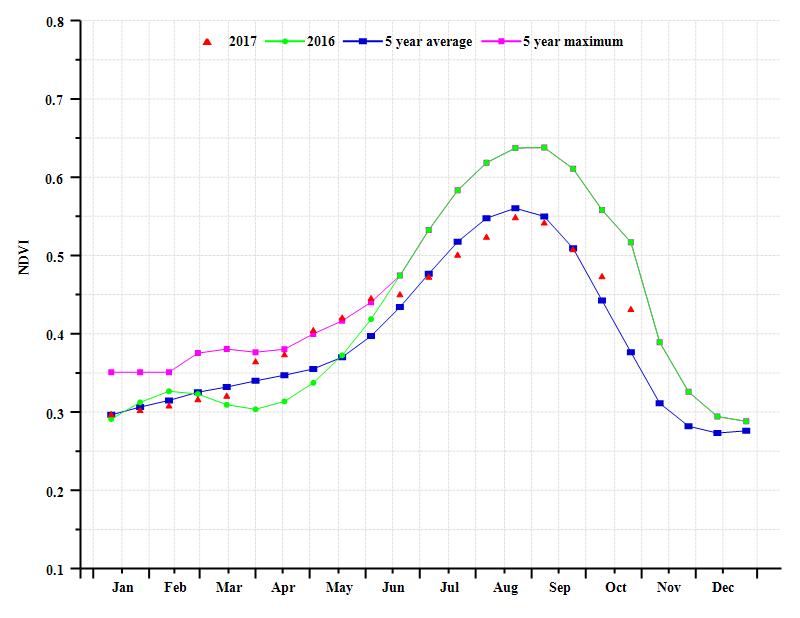
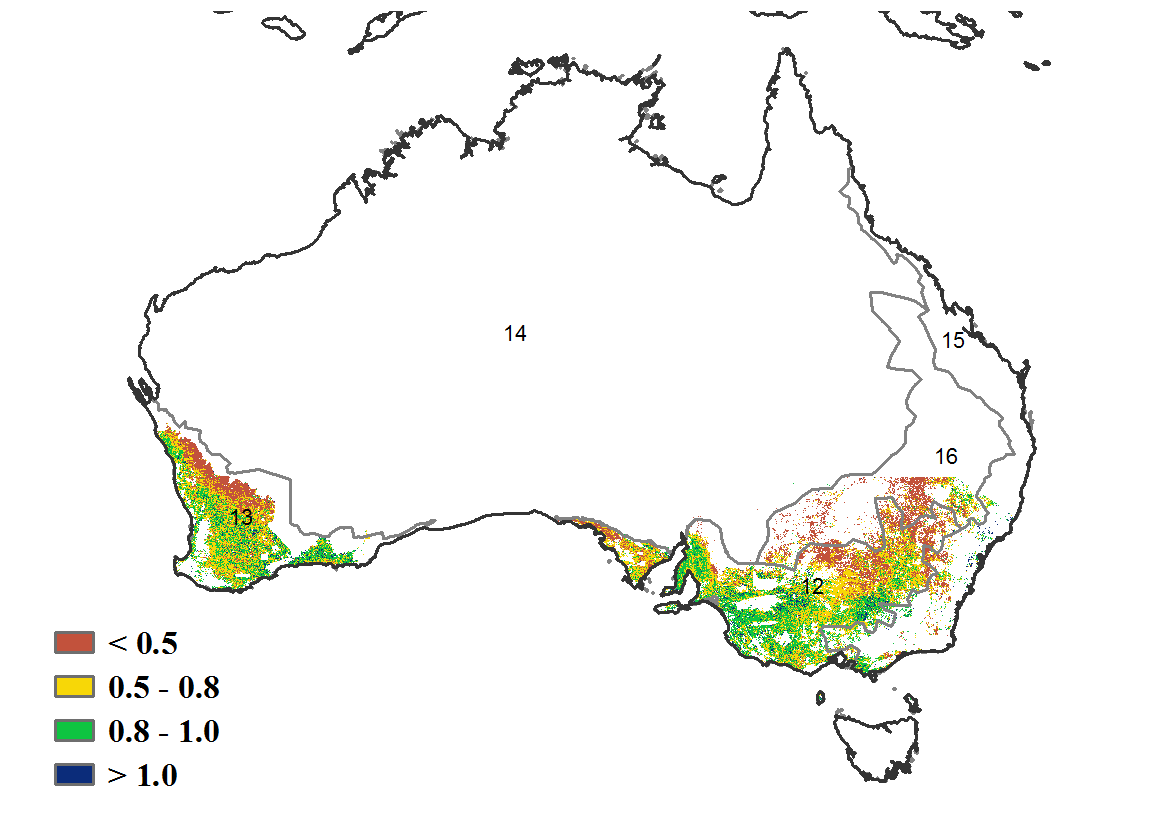
(b) Crop condition development graph based on NDVI (c) Maximum VCI

(d) Spatial NDVI patterns compared to 5YA (e) NDVI profiles


(f) Crop condition development graph based on NDVI (Southeastern wheat zone (left) and Southwestern wheat zone (right))


(g) Crop condition development graph based on NDVI (Arid and semi-arid zone (left) and Wet temperate and subtropical zone (right))

(h) Crop condition development graph based on NDVI (Subhumid subtropical zone)
Table 3.5. Australia July - October 2017 agroclimatic indicators by agro-ecological region, current season's values and departure from 15YA
| Region | RAIN | TEMP | RADPAR | |||
| Current (mm) | Departure from 15YA (%) | Current (°C) | Departure from 15YA (°C) | Current (MJ/m2) | Departure from 15YA (%) | |
| Southeastern wheat zone | 142 | -11 | 11.8 | 0.1 | 864 | -2 |
| Southwestern wheat zone | 115 | -42 | 12.7 | 0.0 | 858 | -6 |
| Arid and semiarid zone | 90 | 65 | 24.7 | 1.3 | 1245 | -1 |
| Wet temperate and subtropical zone | 164 | -9 | 14.2 | 0.5 | 950 | -1 |
| Subhumid subtropical zone | 109 | -12 | 15.8 | 0.5 | 1070 | 0 |
Table 3.6. Australia July - October 2017 agronomic indicators by agro-ecological region, current season's values and departure from 5YA
| Region | BIOMSS | CALF | Maximum VCI | ||
| Current (gDM/m2) | Departure from 5YA (%) | Current | Departure from 5YA (%) | Current | |
| Southeastern wheat zone | 621 | -3 | 90 | -5 | 0.64 |
| Southwestern wheat zone | 458 | -35 | 78 | -14 | 0.66 |
| Arid and semiarid zone | 311 | 23 | 51 | -8 | 0.27 |
| Wet temperate and subtropical zone | 550 | -20 | 99 | 4 | 0.39 |
| Subhumid subtropical zone | 459 | -9 | 48 | -28 | 0.17 |
Table 3.7. Australia CropWatch-estimated wheat production for 2017 (thousand tons)
| Crops | Production 2016 | Yield variation (%) | Area variation (%) | Production 2017 | Production variation (%) |
| Wheat | 31600 | -16.1% | -7.2% | 24606 | -22.1% |