
 English
 中文
中文
Bulletin
CropWatch bulletinMenu
Authors: 超级管理员 | Edit: tanshen
Germany
Generally, the crops in Germany showed above average condition during the reporting period from July to October. Currently, summer crops have been harvested, and winter crops are at the planting stage. The CropWatch agroclimatic indicators show that for the country as a whole, total precipitation (as measured by the RAIN indicator) was 27% above average, temperature was slightly below average (TEMP, -0.3°C), and radiation significantly below average (RADPAR, -9%) over the period of analysis. Above average rainfall occurred throughout the country from mid-July to mid-August, early September to early October, and in late October, with negative departures occurring only in late August and mid-October. With favorable moisture and temperature, biomass (BIOMSS) is expected to increase by 22% nationwide compared to the five-year average, even if below average sunshine may reduce expectations.
During the period from early July to late July and in early October, the crop condition development graph showed national NDVI values that were above average and even close to the five-year maximum values. These observations are confirmed by the NDVI profiles. Crops had generally favorable or even very favorable condition, as shown by the high VCIx areas, a pattern confirmed by the NDVI clusters. Summer crops also are about average in most of the country according to the NDVI profiles, a spatial pattern again reflected by VCIx in the different areas, with a VCIx of 0.89 for Germany overall.
Generally, the values of agronomic indicators show favorable condition for most summer crops and the sowing of winter crops in Germany. CALF during the reporting period was 100%, the same as the recent five-year average. Cropping intensity was down 9% compared with the five-year-average. Due to favorable condition, the production of wheat and maize is estimated at respectively 0.1% and 3.3% above 2016 values.
Regional analysis
Based on cropping systems, climatic zones, and topographic conditions, six sub-national agro-ecological regions are adopted for Germany. They include, listed with their identification numbers: (58) Northern wheat zone including Mecklenburg-Vorpommern and Schleswig-Holstein, (59) Northwest mixed wheat and sugarbeets zone covering Niedersachsen (Lower Saxony) and Nordrhein-Westfalen, (60) Central wheat zone with Sachsen-Anhalt and Thüringen, (61) Eastern sparse crop areas with Bandenburg and Saxony, (62) western sparse crop areas (Hessen and Rheinland-Pfalz), and (63) Southern highland including Baden-Würtenberg and Bavaria. The numbers identify the areas on the maps.
In the Northern wheat zone, the CropWatch agroclimatic indicator RAIN was well above average (+57%) with warm weather (TEMP, +0.9°C) but radiation significantly below average (RADPAR, -11%). With favorable moisture and temperature, biomass (BIOMSS) in this zone is expected to increase by 40% compared to the five-year average. Above average crop condition is indicated by the region's NDVI development profiles. The area has a high CALF (100%) as well as a favorable VCIx (0.89), indicating high cropped area and favorable crop prospects.
The CropWatch agroclimatic indicators show that abundant RAIN (41% above average) in the Northwest mixed wheat and sugarbeets zone resulted in favorable crop condition for both crops. As shown by the crop condition development graph, NDVI values were below both normal and last year’s values in early July, then again above average from early August to early October, and finally below average after early October. Overall crop condition for the region is good according to the high VCIx (0.90).
The Central wheat zone received about 37% above average rainfall and experienced slightly cool temperatures (TEMP, -0.5°C). At the same time, the biomass potential (BIOMSS indicator) increase of 25% is also optimistic with favorable moisture. Late crop emergence is evident from the NDVI profile, confirmed also by a CALF of 100%. The VCIx of 0.85 for this region also shows favorable crop prospects.
The Eastern and western sparse crop areas experienced very wet weather conditions, with RAIN above average (+36% and +25%, respectively), slightly below average temperatures (TEMP, -0.3°C and -0.5°C), and very poor radiation (RADPAR, -9% and -6%). Compared to the average of the last five years, BIOMSS was up by 26% and 17% respectively with favorable moisture and temperature, while CALF was at 100% for both. Favorable crop condition was recorded with high VCIx values of 0.90 for the eastern and 0.89 for the western areas, respectively.
Figure 3.10. Germany crop condition, July - October 2017
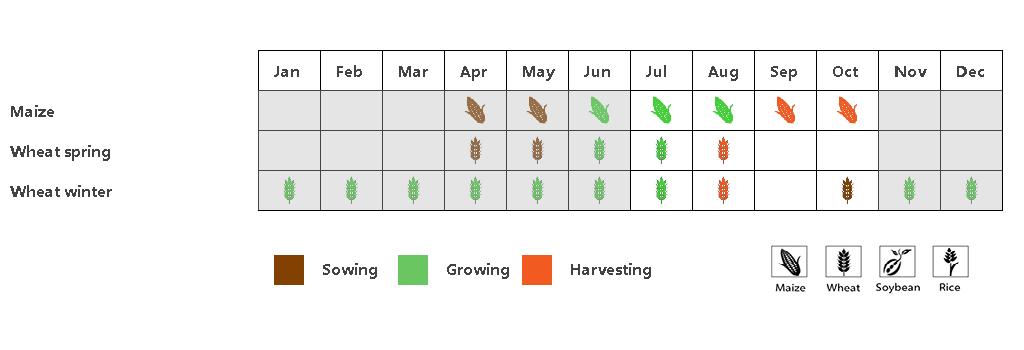
Figure 3.10a. Germany phenology of major crops

Figure 3.10b. Germnay national level crop condition development graph based on NDVI, comparing the July-October 2017 period to the previous season and the five-year average (5YA) and maximum

Figure 3.10c. Germany maximum VCI for July-October 2017 by pixel

Figure 3.10d. Germany spatial NDVI patterns up to October 2017 according to local cropping patterns and compared to the 5YA (left) and (e) associated NDVI profiles (right)

Figure 3.10f. Northern wheat zone (Germany) crop condition development graph based on NDVI

Figure 3.10g. Northwest mixed wheat and sugarbeets zone (Germany) crop condition development graph based on NDVI

Figure 3.10h. Central wheat zone (Germany) crop condition development graph based on NDVI

Figure 3.10i. Eastern sparse crop area (Germany) crop condition development graph based on NDVI

Figure 3.10j. Western sparse crop area (Germany) crop condition development graph based on NDVI

Figure 3.10k. Southern highland (Germany) crop condition development graph based on NDVI
Table 3.17. Germany agroclimatic indicators by sub-national regions, current season's values and departure from 15YA, July-October 2017
| Regions Name | RAIN | TEMP | RADPAR | |||
| Current (mm) | Departure from 15YA (%) | Current (°C) | Departure from 15YA (°C) | Current (MJ/m2) | Departure from 15YA (%) | |
| Northern wheat zone | 417 | 57 | 15.4 | 0.9 | 690 | -11 |
| Northwest mixed wheat and sugarbeets zone | 392 | 41 | 15.3 | -0.5 | 690 | -12 |
| Central wheat zone | 345 | 37 | 15.7 | -0.5 | 730 | -10 |
| Eastern sparse crop area | 336 | 36 | 15.8 | -0.3 | 733 | -9 |
| Western sparse crop area | 329 | 25 | 15.2 | -0.5 | 752 | -9 |
| Southern highland | 367 | 6 | 14.9 | -0.4 | 812 | -6 |
Table 3.18. Germany agronomic indicators by sub-national regions, current season's value and departure from 5YA, July-October 2017
| Regions Name | BIOMSS | Cropped arable land fraction | Maximum VCI | ||
| Current (gDM/m2) | Departure from 5YA (%) | Current (%) | Departure from 5YA (%) | Current | |
| Northern wheat zone | 1544 | 40 | 100 | 0 | 0.89 |
| Northwest mixed wheat and sugarbeets zone | 1515 | 32 | 100 | 0 | 0.90 |
| Central wheat zone | 1335 | 26 | 100 | 0 | 0.85 |
| Eastern sparse crop area | 1308 | 26 | 100 | 0 | 0.90 |
| Western sparse crop area | 1310 | 17 | 100 | 0 | 0.89 |
| Southern highland | 1391 | 8 | 100 | 0 | 0.90 |
Table 3.19. CropWatch-estimated maize and wheat production for Germany in 2017 (thousands tons)
| Crops | Production 2016 | Yield variation | Area variation | Production 2017 | Production variation |
| Maize | 4602 | 3.3% | 0.0% | 4755 | 3.3% |
| Wheat | 28106 | 0.1% | 0.0% | 28130 | 0.1% |