
 English
 中文
中文
Bulletin
CropWatch bulletinMenu
Authors: 超级管理员 | Edit: tanshen
Egypt
Over this reporting period, the mean temperature in Egypt was 26.3°C, a slight decrease (about 0.4°C) compared to the average. RADPAR was also about average (+1%), and so was RAIN (with virtually no rainfall expected during the summer in Egypt). All crops are irrigated: the CropWatch projected increases in the production of wheat, maize, and rice (with projected increases of respectively +7.4%, 3.8%, and 4% over 2016) result from an increase in both areas and yield. The latter has probably benefited from the mentioned increase in sunshine as well.
Nationwide, NDVI showed a decrease compared with both 2016 and the five-year average values for NDVI, while VCIx values varied between 0.8 and 1. The spatial distribution of NDVI profiles, however, shows that the condition of 12.6% of agricultural areas was below the five-year average. Condition for about half of the agricultural areas (45.2%) was comparable to the last five-years, while for about 16.3% condition was mostly above that same average.
Regional analysis
According to the agro-climatic conditions, Egypt can be divided into three main agro-ecological regions: the Nile delta with the Mediterranean coastal strip; the Nile valley, where most crops are located; and desert. This analysis will focus on the two main regions.
In the Nile delta, which includes about 40% of the agricultural lands, all indicators were close to their averages. NDVI over the observed period showed a decrease in comparison with the five-year average values. Meanwhile, the map of the spatial distribution of NDVI profiles shows that the areas classified as "below average condition" are mostly located in the western part of the delta.
Conditions in the Nile valley were very similar to those that prevailed in the delta. The spatial NDVI patterns describing the condition of agricultural lands show that most of the the valley did not depart noticeably from the average of the recent five years.
Figure 3.11. Egypt crop condition, July-October 2017
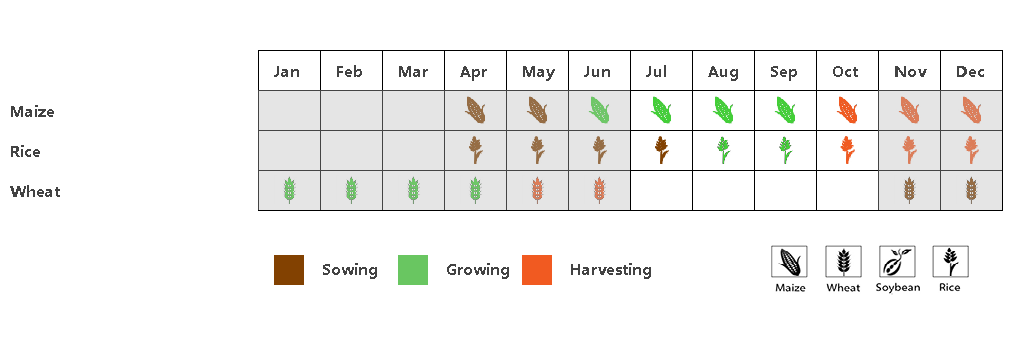
(a). Phenology of major crops


(b) Crop condition development graph based on NDVI (c) Maximum VCI

(d) Spatial NDVI patterns compared to 5YA (e) NDVI profiles


(f) Crop condition development graph based on NDVI (Nile Delta (left) and Nile Valley (right))
Table 3.20. Egypt agroclimatic indicators by sub-national regions, current season's values and departure from 15YA, July-October 2017
| Regions Name | RAIN | TEMP | RADPAR | |||
| Current (mm) | Departure from 15YA (%) | Current (°C) | Departure from 15YA (°C) | Current (MJ/m2) | Departure from 15YA (%) | |
| Nile Delta | 1 | -85 | 26.4 | -0.2 | 1375 | 1 |
| Nile Valley | 3 | -18 | 27.8 | -0.5 | 1442 | 1 |
| Desert | 9 | 94 | 26.0 | -0.3 | 1409 | 2 |
Table 3.21. Egypt agronomic indicators by sub-national regions, current season's values and departure from5YA, July-October 2017
| Regions Name | BIOMSS | CALF | Maximum VCI | ||
| Current (gDM/m2) | Departure from 5YA (%) | Current | Departure from 5YA (%) | Current | |
| Nile Delta | 7 | -69 | 62 | 1 | 1 |
| Nile Valley | 8 | -39 | 67 | 0 | 1 |
| Desert | 34 | 147 | 0 | 39 | 0 |
Table 3.22. CropWatch-estimated maize, rice, and wheat production for Egypt in 2017 (thousand tons)
| Crops | Production 2016 | Yield variation | Area variation | Production 2017 | Production variation |
| Maize | 5701 | 2.0% | 1.8% | 5918 | 3.8% |
| Rice | 6293 | 1.8% | 2.2% | 6545 | 4.0% |
| Wheat | 10207 | 5.0% | 2.3% | 10963 | 7.4% |