
 English
 中文
中文
Bulletin
CropWatch bulletinMenu
Authors: 超级管理员 | Edit: tanshen
[ETH] Ethiopia
The monitoring period covers part of the main rainy season of Ethiopia, with heavy Kremt rains falling in July and August when most cereal was in full growth. On a local level, however, events were characterized by re-occurring droughts that have continued to ravage most of Eastern Africa since last year. The first season in bimodal rainfall areas (the Belg season) is typically harvested before August, and this season was generally unfavorable. Based on the VCIx values and spatial NDVI profiles, however, the main Meher cropping season (harvest from August to the end of the year) has so far been promising. There was a slight increase in rainfall (669 mm, +2%), while both temperature (TEMP) and sunshine (RADPAR) were average, resulting in a biomass production potential that was average as well. However, North Oromia and Amhara recorded favorably high VCIx, between 0.8 and 1.0. While most regions suffered droughts, parts of the central-northern maize-teff region enjoyed some fairly good rains (RAIN +5%), which were, however, insufficient to significantly improve BIOMSS. Meanwhile, the cropped area remained unchanged for most parts of producing areas.
The disruptions in the Kremt rains during the growing period affected maize and teff in the central and western parts of the country, where below average conditions do occur. Food insecurity may continue to prevail in the eastern part.
Regional analysis
Most of the growing regions experienced increased spatial and temporal variability in rainfall as observed in the semi-arid pastoral zone, southeastern mixed-maize zone, western-mixed maize regions, and central-northern maize-teff highlands, which are the major cereal and grain-producing areas of Ethiopia.
Severe rainfall deficit was experienced in the southeastern mixed-maize zone of Oromia and Dire Dawa, Harari and near the Somali Highlands (a major maize and teff producing area), which suffered a 24% rainfall shortage, resulting in unfavorable conditions. A significant biomass production potential reduction (BIOMSS, -11%) was observed too.
The semi-arid pastoral region, which is a major livestock producer, recorded biomass and rainfall reduction (BIOMSS, -5%) and (RAIN -11%), leading to increased food insecurity risk and vulnerability in the region.
In contrast, the western mixed maize region experienced better conditions (RAIN +5%; RADPAR +3%), with a BIOMSS increment (+5%) compared to average. Similarly, conditions in the central-northern maize highlands remained quite promising (VCIx 0.93), differing only marginally from the average.
Overall, the grazing land conditions deteriorated due to insufficient rainfall, while wheat production is estimated by CropWatch to be 28% below last year's level.
Figure 3.12. Ethiopia crop condition, July-October 2017

(a) Phenology of major crops

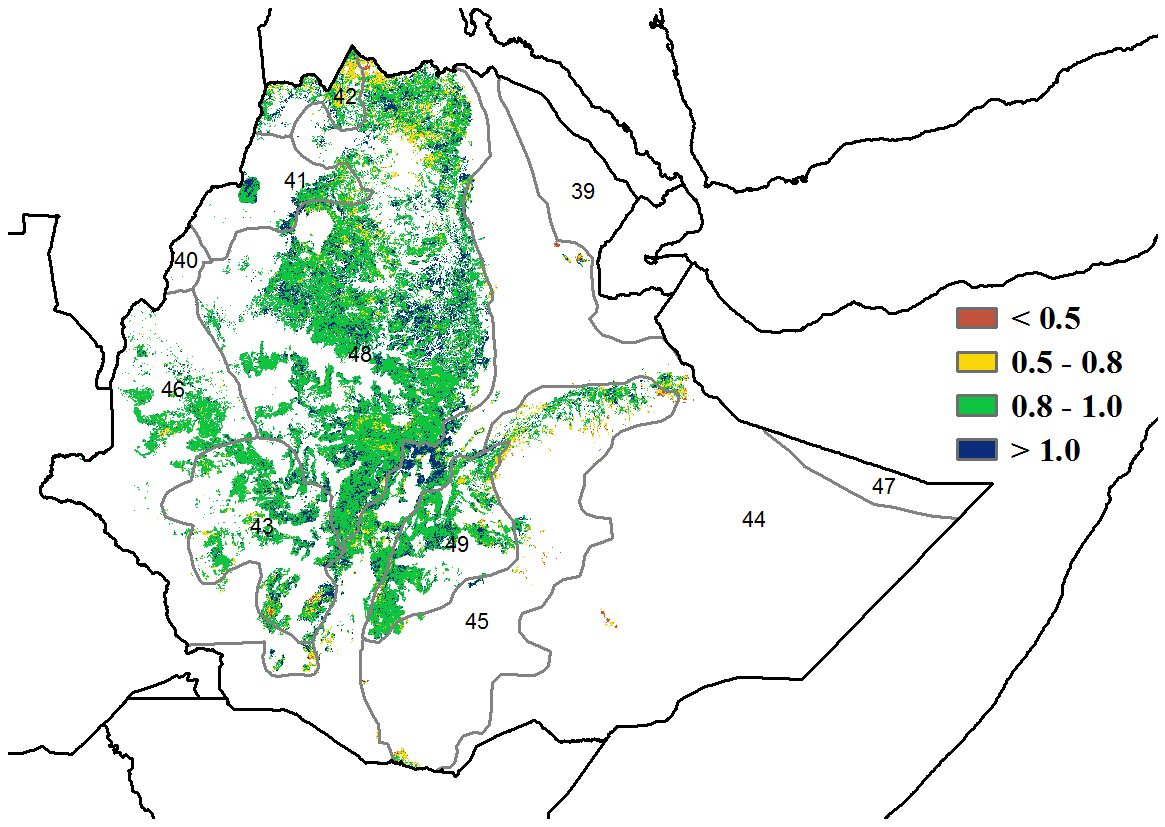
(b) Crop condition development graph based on NDVI (c) Maximum VCI
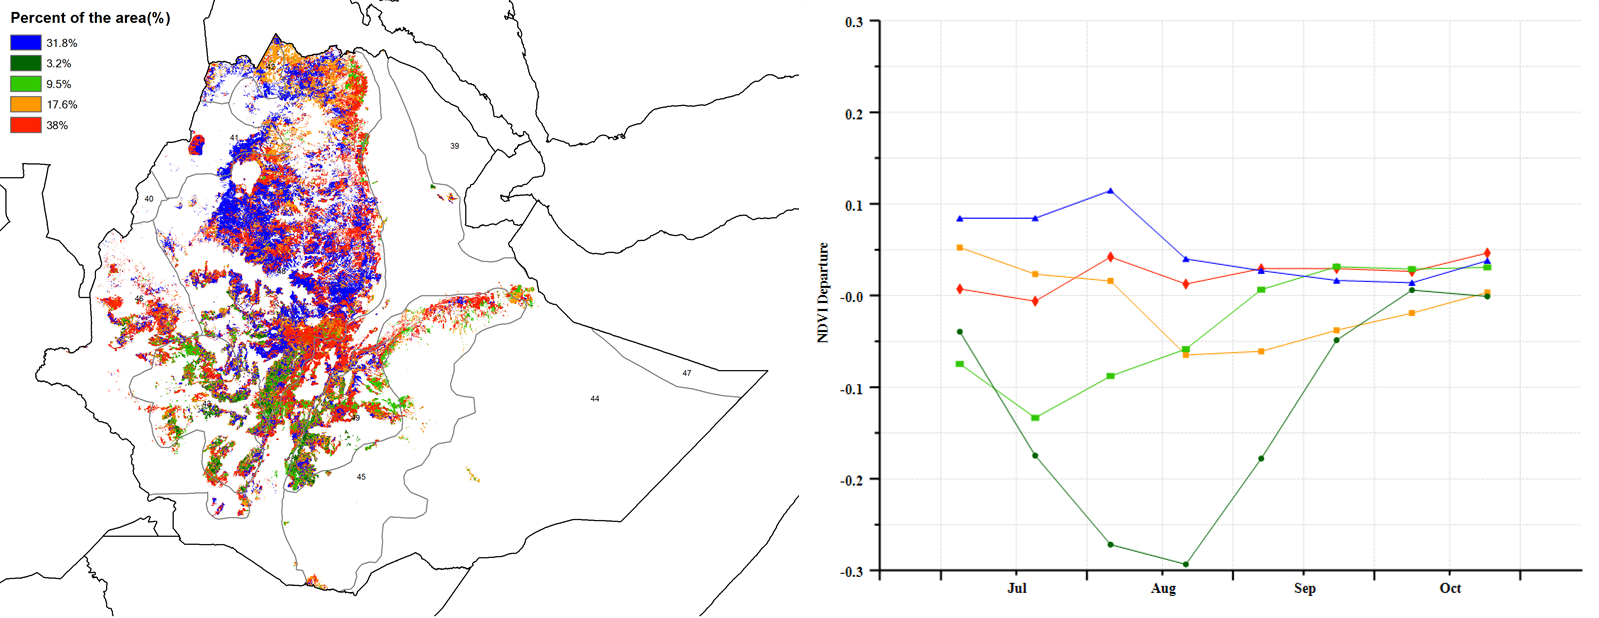
(d) Spatial NDVI patterns compared to 5YA (e) NDVI profiles
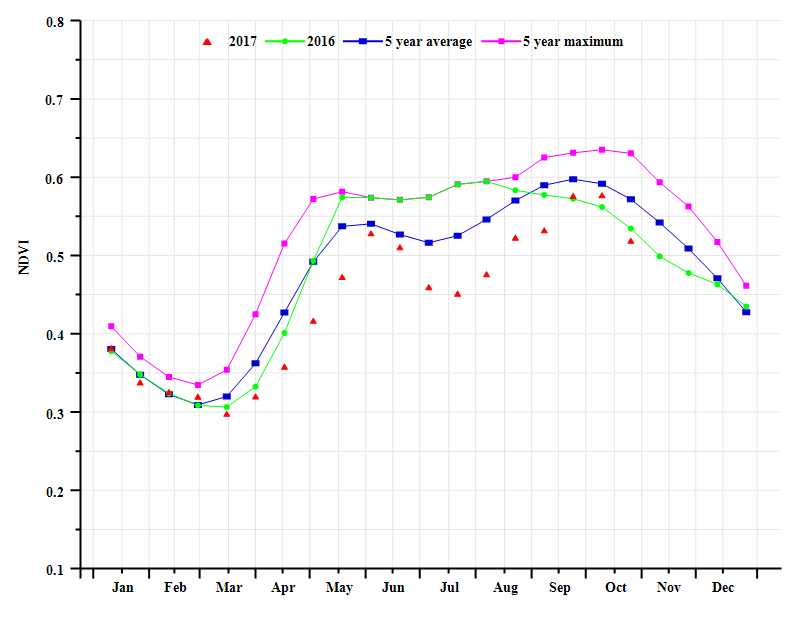

(f) Crop condition development graph based on NDVI (South-east mixed-maize region (left) and Semi-arid pastoral region (right))
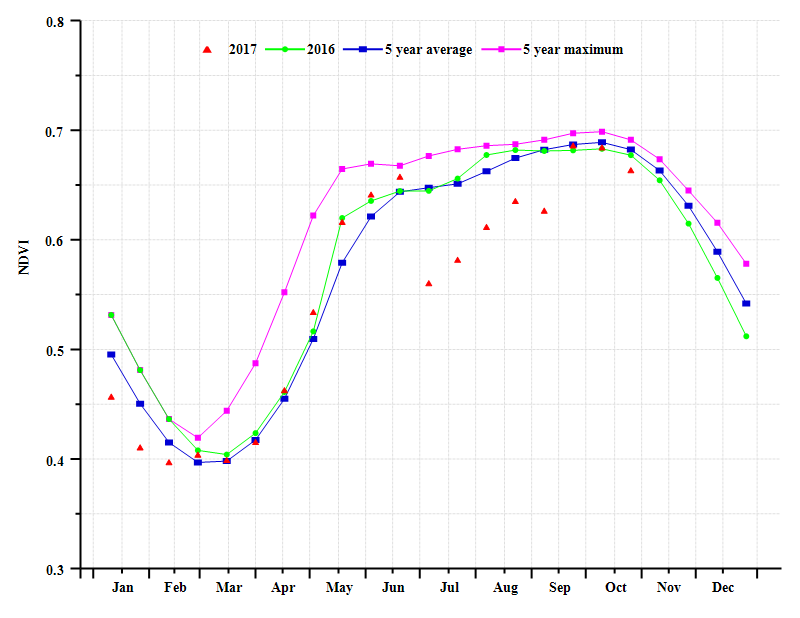

(g) Crop condition development graph based on NDVI (Western mixed-maize region (left) and entral northern maize highlands region (right))
Table 3.22. July-October 2017 Agro-climatic indicators by sub-national regions, current season's values and departure from 15YA
| Region | RAIN | TEMP | RADPAR | |||
| Current (mm) | Departure from 15YA (%) | Current (°C) | Departure from 15YA (°C) | Current (MJ/m2) | Departure from 15YA (%) | |
| Semi-arid pastoral | 396 | -11 | 22.4 | -0.3 | 1208 | 3 |
| South-eastern mixed maize zone | 352 | -24 | 22.5 | -0.2 | 1166 | 2 |
| Western mixed maize zone | 906 | 17 | 23.1 | -0.1 | 1099 | 3 |
| Central-northern maize-teff highlands | 767 | 5 | 19.4 | 0.0 | 1130 | -2 |
Table 3.23. July-October 2017 Agronomic indicators by sub-national regions, current season's values and departure from 5YA
| Region | BIOMSS | CALF | Maximum VCI | ||
| Current (gDM/m2) | Departure from 5YA (%) | Current (%) | Departure from 5YA (%) | Current | |
| Semi-arid pastoral | 1321 | -5 | 92 | 0 | 0.91 |
| South-eastern mixed maize zone | 1262 | -11 | 92 | -3 | 0.83 |
| Western mixed maize zone | 2106 | 5 | 100 | 0 | 0.95 |
| Central-northern maize-teff highlands | 1728 | -1 | 98 | 0 | 0.93 |
Table 3.24. CropWatch-estimated maize and wheat production for 2017 (thousand tons)
| Production 2016 | Yield variation (%) | Area variation (%) | Production 2017 | Production variation (%) | |
| Maize | 7157 | 0 | 9 | 7154 | 0 |
| Wheat | 4743 | 2 | 10 | 72 | -28 |