
 English
 中文
中文
Bulletin
CropWatch bulletinMenu
Authors: 超级管理员 | Edit: tanshen
Crops in Indonesia generally showed good condition from August to October, with the maximum VCI (VCIx) value on the national level reaching 0.93. During the monitoring period, the irrigated dry season maize and rice entered the generative or early ripening stage. Compared with the recent average, temperature was normal, while precipitation was significantly above average (+27%) and radiation underwent a significant decrease of 10% compared to average. Influenced by the high precipitation, biomass accumulation (measured by the CropWatch BIOMSS indicator) increased significantly by 16% compared with the recent five-year average. Due to persistent cloudiness and very wet weather, however, the NDVI values of most pixels are invalid. This lead to unrealistically low values in the national NDVI profiles compared to the recent five-year average and last year’s level before mid-October, after which the values improved to reach the five-year maximum level in late-October. The cropped arable land fraction (CALF) remained stable compared with previous years, and the cropping intensity increased by 1% over average.
Regional analysis
For more spatial detail, CropWatch also prepares regional analysis for three agro-ecological zones within the country, covering the main islands groups: Sumatra; Java (the main agricultural region in the country); and Kalimantan and Sulawesi.
Crop condition was mostly average in Sumatra. The island experienced wet conditions, with a 9% increase of rainfall over average, average temperature, and a significant drop in sunshine (RADPAR, -7%); the biomass production potential increased by 8% compared to the recent five-year average. According to the NDVI clusters, crop condition was slightly above average in Bengkulu, Sumatera Selatan, and Lampung over the entire monitoring period, while the NDVI profile was below average in mid-August in Riau and Jambi, rising above average in October.
The case of Java is special compared to other regions in the country. Rainfall here was below average by as much as 24%, temperature was high (+1.1°C), and radiation was 5% below average. Due to the deficit in rainfall and sunshine, the biomass production potential indicator was 8% below its five-year average. The NDVI profile of Java for July-October is nearly the same as its five-year average. The VCIx for Java is 0.88, lower than other sub-regions in Indonesia.
Kalimantan and Sulawesi experienced very wet weather conditions, with rainfall 32% above average. As radiation decreased by 12%, the listed biomass production potential increase of 25% is considered too optimistic. According to the NDVI clusters, the crop condition in Kalimantan Tengah dropped below average in August and early-September, then improved to above average in October. The VCIx map shows the value of some pixels in Kalimantan Timur exceeding 1, indicating very favorable crop condition in those places.
Overall, the abundant rainfall during the reporting period provided a favorable soil moisture condition for crops. However, the significant drop in sunshine is likely to have affected yields negatively, and the BIOMSS value is too optimistic. CropWatch assesses that the yield of maize and rice in Indonesia in 2017 will decrease by 2.9% and 1.3%, respectively.
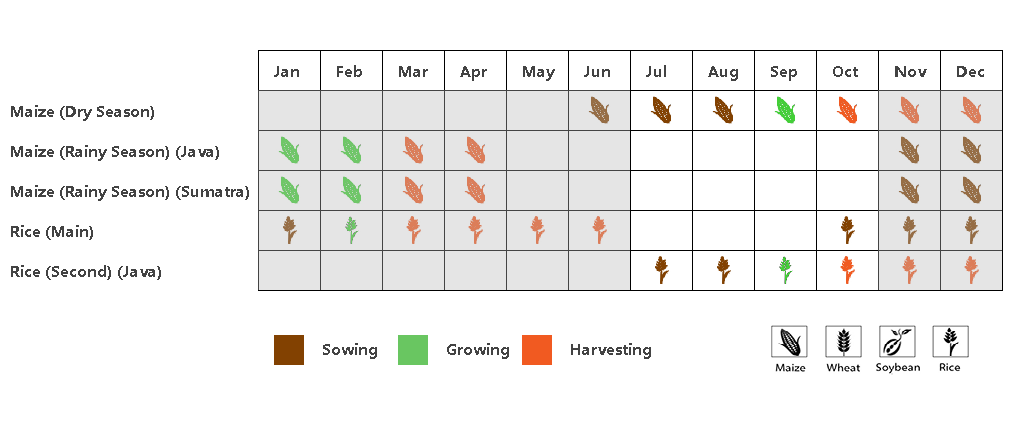
(a). Indonesia phenology of major crops


(b). Indonesia national level crop condition development graph based on NDVI, comparing the July-October 2017 period to the previous season and the five-year average (5YA) and maximum (c) Indonesia VCI for July-October 2017 by pixel

(d) Indonesia spatial NDVI patterns up to October 2017 according to local cropping patterns and compared to the 5YA (left) and (e) associated NDVI profiles (right)

(f)Crop condition development graph based on NDVI (Sumatra (left) and Java(right))

(g) Crop condition development graph based on NDVI (Kalimantan and Sulawesi)
Table 3.32. Indonesia agroclimatic indicators by sub-national regions, current season's values and departure from 15YA, July-October 2017
| Region | RAIN | TEMP | RADPAR | |||
| Current (mm) | Departure (%) | Current (°C) | Departure (%) | Current (MJ/m2) | Departure (%) | |
| Sumatra | 849 | 9.0 | 25.6 | -0.3 | 982 | -6.8 |
| Java | 194 | -23.7 | 25.8 | 1.1 | 1159 | -5.4 |
| Kalimantan Sulawesi | 941 | 31.8 | 25.9 | 0.2 | 931 | -12.3 |
| Irian Jaya | 1454 | 43.1 | 24.6 | 0.1 | 832 | -10.2 |
Table 3.33. Indonesia agronomic indicators by sub-national regions, current season's value and departure from 5YA, July-October 2017
| Region | BIOMSS | Cropped arable land fraction | Maximum VCI | ||
| Current (gDM/m2) | Departure (%) | Current | Departure (%) | Current | |
| Sumatra | 2012 | 8 | 100 | 0.0 | 0.94 |
| Java | 605 | -8 | 98 | 0.1 | 0.88 |
| Kalimantan and Sulawesi | 2116 | 25 | 100 | 0.0 | 0.94 |
| Irian Jaya | 2193 | 15 | 100 | -0.2 | 0.93 |
Table 3.34. CropWatch-estimated maize and rice production for Indonesia in 2017 (thousands tons)
| Crops | Production 2016 | Yield variation | Area variation | Production 2017 | Production variation |
| Maize | 18316 | -2.7% | -0.2% | 17791 | -2.9% |
| Rice | 69304 | -1.2% | 0.0% | 68411 | -1.3% |