
 English
 中文
中文
Bulletin
CropWatch bulletinMenu
Authors: 超级管理员 | Edit: tanshen
During the monitoring period, maize was being sown in the northwestern part of Mexico, while in other areas it was being harvested. Rice also was being sown during this time, while winter wheat was being harvested. Nationwide, crop condition was average or slightly below average, as shown by the crop condition development graph based on NDVI.
The CropWatch agroclimatic indicators showed that, compared with average, rainfall increased by 5%, while temperature and radiation respectively dropped by 0.4°C and 2%. Consequently, BIOMSS was slightly below average (-1%) as well, while the VCIx on the national level was 0.92. As indicated by the spatial NDVI patterns and corresponding profiles, about 62.4% of crops were continuously above average or with average condition over the whole reporting period, especially in southeastern and northern Mexico. In contrast, 8.8% of planted areas presented persistently unfavorable condition, mainly in the central part of the country. Considering CALF and cropping intensity increased respectively by 3% and 5%, crop production in the current season is estimated to be average or slightly above average.
Regional analysis
According to cropping systems, climatic zones, and topographic conditions, Mexico is divided into five agro-ecological regions, including the northwestern mixed wheat and maize area, a southern maize zone, a central temperate zone, a northern mixed cotton and wheat area, and a northeastern mixed sorghum and maize area.
As shown by the crop condition development graph based on NDVI, crops condition was generally below average in the northwestern mixed wheat and maize area, while continuously average or above average conditions prevailed in the southern maize zone, the central temperate zone, and the northern mixed cotton and wheat area during July through October. In the northeastern mixed sorghum and maize area, crop condition was below average from July to early September, but improved to above average from late September.
The CropWatch agroclimatic and agronomic indicators showed different departures from average for the different regions. Rainfall was below average in the central temperate zone (RAIN -5%) and northeastern mixed sorghum and maize area (-12%), but above average in the northwestern mixed wheat and maize area (+6%) and the southern maize zone (+10%). In the northern mixed cotton and wheat area, rainfall was average. Temperature and radiation were generally below average in the southern maize zone, the central temperate zone, the northern mixed cotton and wheat area, and the northeastern mixed sorghum and maize area, but average in the northwestern mixed wheat and maize area. BIOMSS was above average in the southern maize zone (+4%) but generally below average in the other four regions. Compared to the recent five-year average, CALF increased in almost all the regions with the exception of the southern maize zone, where the indicator was average. The maximum VCI was between 0.83 and 0.94 in these sub-national regions.
Figure 3.20. Mexico crop condition, July-October 2017
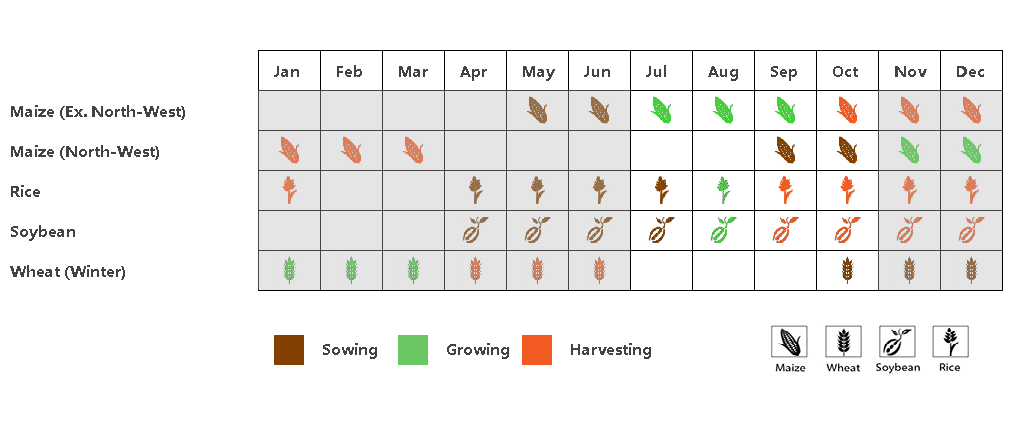
(a). Phenology of major crops
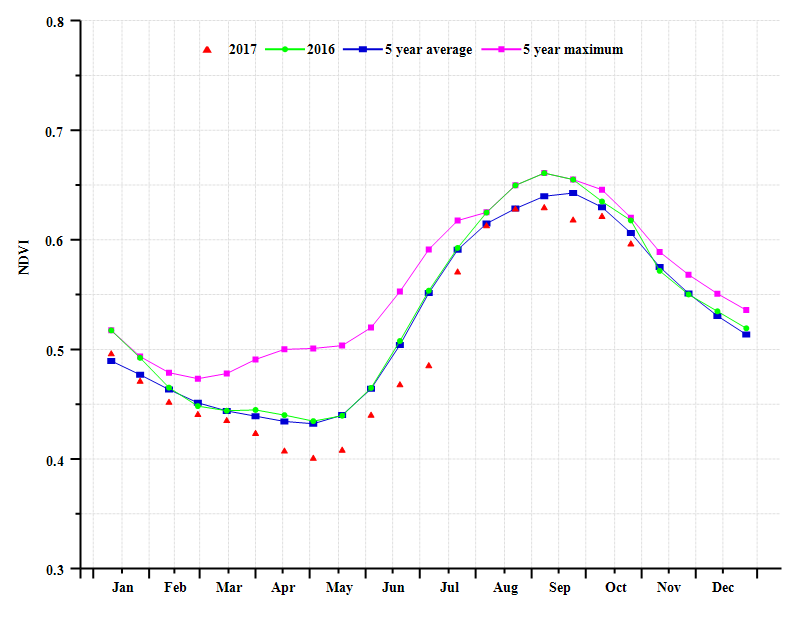
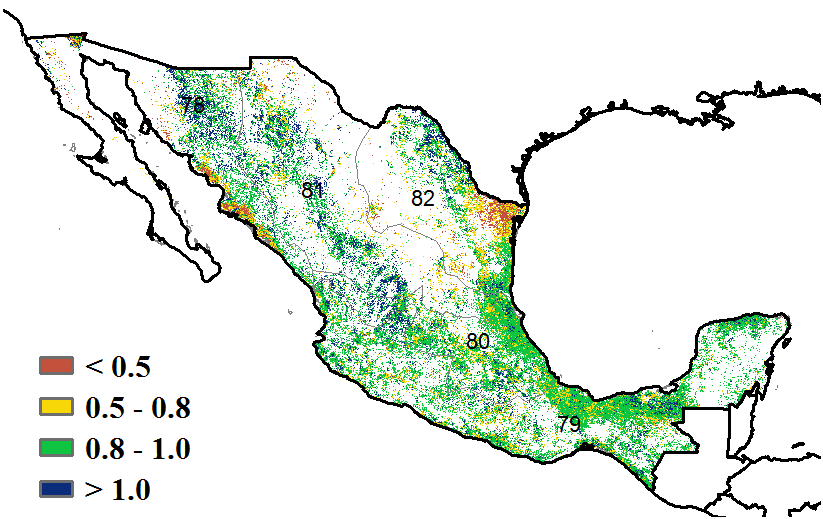
(b) Crop condition development graph based on NDVI (c) Maximum VCI
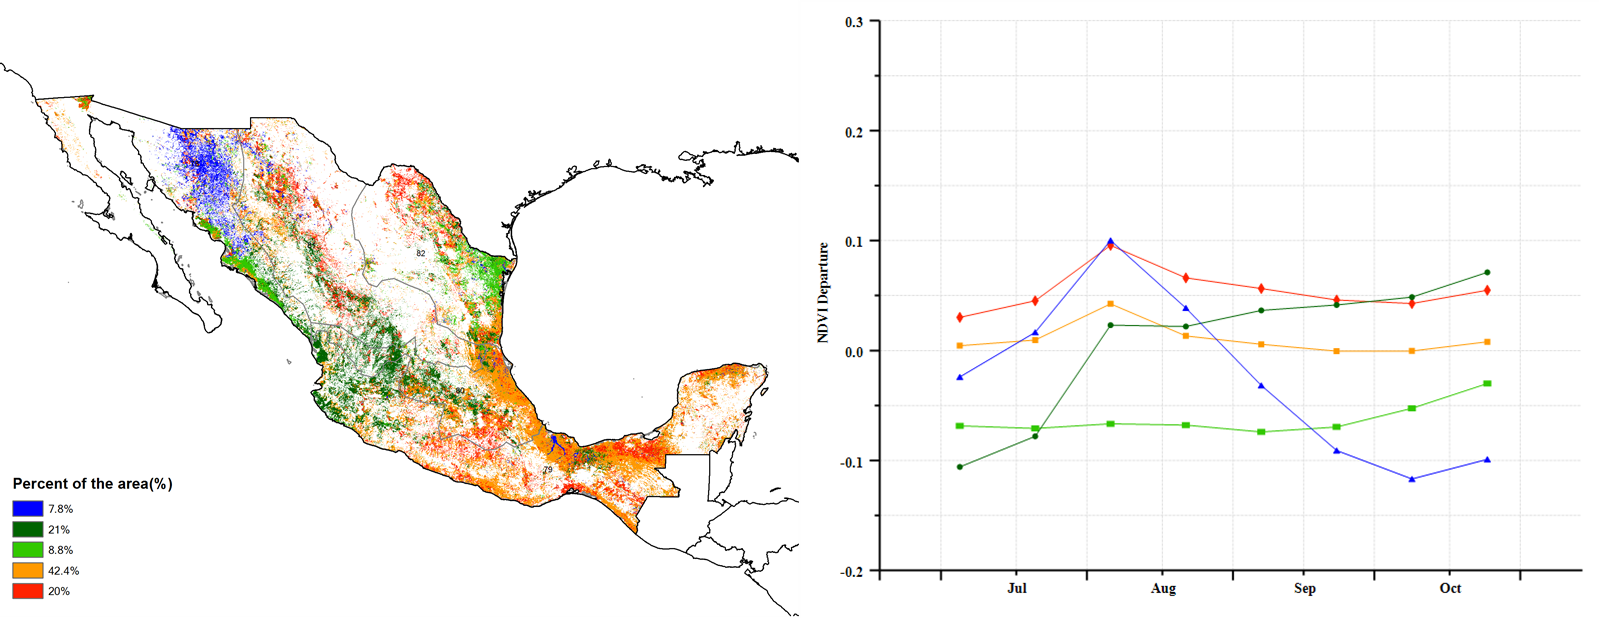
(d) Spatial NDVI patterns compared to 5YA (e) NDVI profiles

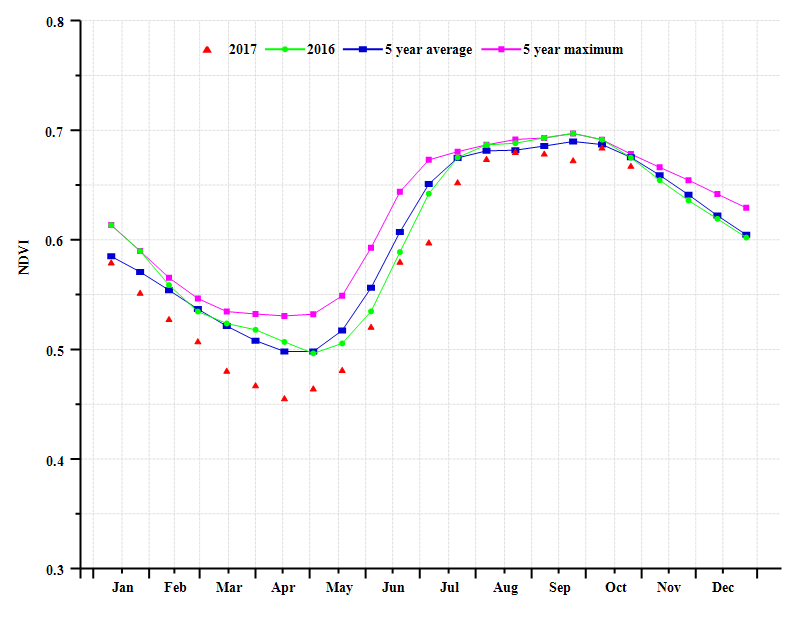
(f) Crop condition development graph based on NDVI (Northwestern mixed wheat and maize area (left) and Southern maize zone (right))
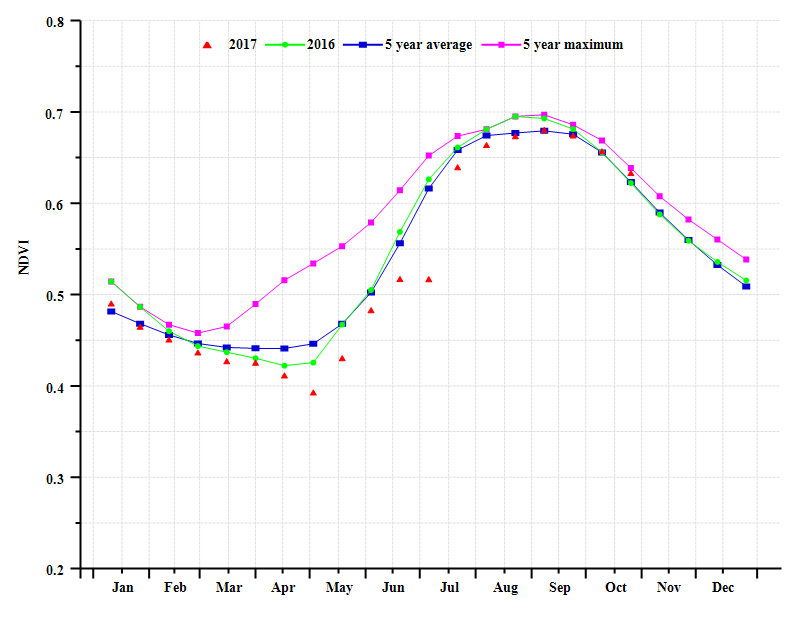
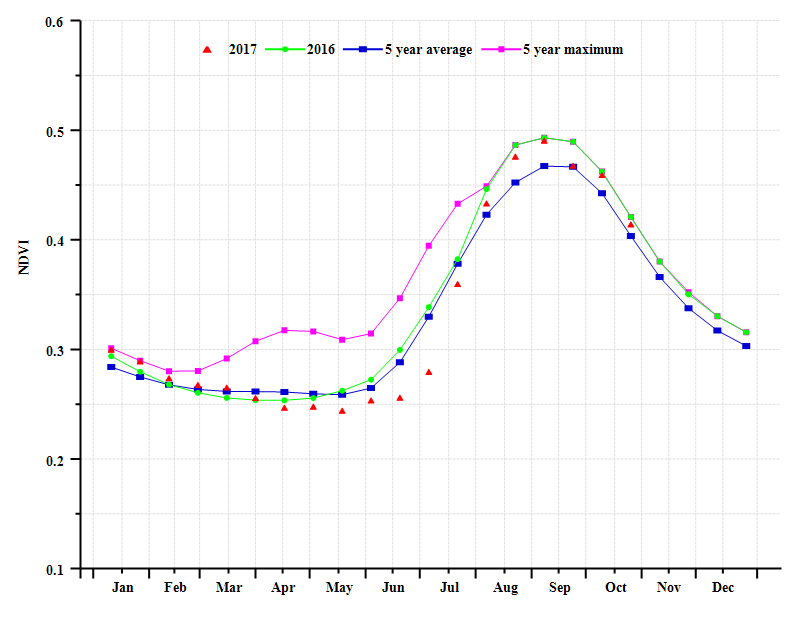
(g) Crop condition development graph based on NDVI (Centre temperate zone (left) and Northern mixed cotton and wheat area (right))
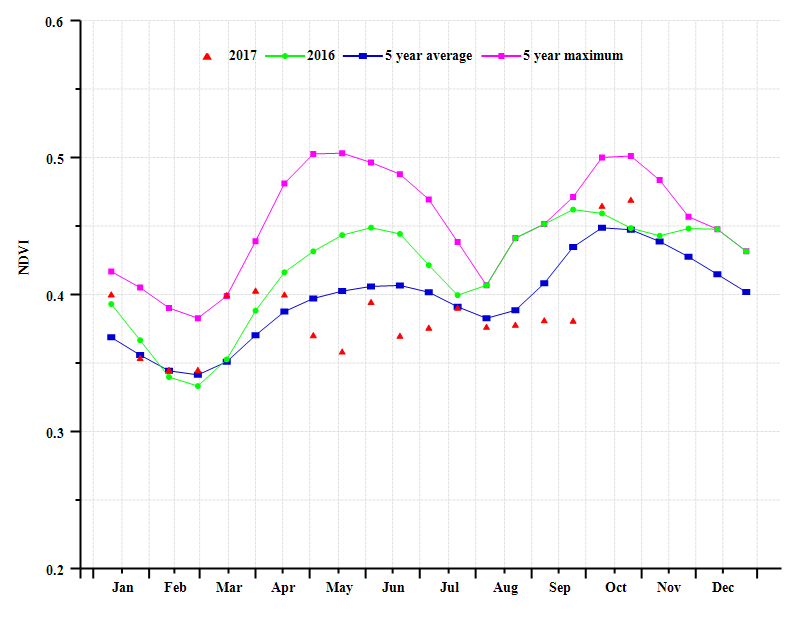
(h) Crop condition development graph based on NDVI (Northeastern mixed sorghum and maize area)
Table 3.47. Mexico agroclimatic indicators by sub-national regions, current season's values and departure from 15YA, July-October 2017
|
Region
| RAIN | TEMP | RADPAR | |||
| Current (mm) | Departure from 15YA (%) | Current (°C) | Departure from 15YA (°C) | Current (MJ/m2) | Departure from 15YA (%) | |
| Northwestern mixed wheat and maize area | 512 | 6 | 26.9 | 0.0 | 1236 | 1 |
| Southern maize zone | 1055 | 10 | 24.6 | -0.4 | 1106 | -3 |
| Central temperate zone | 642 | -5 | 21.0 | -0.4 | 1153 | -3 |
| Northern mixed cotton and wheat area | 436 | 0 | 20.7 | -0.6 | 1231 | -2 |
| Northeastern mixed sorghum and maize area | 339 | -12 | 26.6 | -1.0 | 1233 | -1 |
Table 3.48. Mexico agronomic indicators by sub-national regions, current season's values and departure from 5YA, July-October 2017
| Region | BIOMSS | Cropped arable land fraction | Maximum VCI | ||
| Current (gDM/m2) | Departure from 5YA (%) | Current (%) | Departure from 5YA (%) | Current | |
| Northwestern mixed wheat and maize area | 1072 | -4 | 77 | 1 | 0.89 |
| Southern maize zone | 2134 | 4 | 100 | 0 | 0.94 |
| Central temperate zone | 1595 | -4 | 99 | 1 | 0.93 |
| Northern mixed cotton and wheat area | 1277 | -1 | 90 | 9 | 0.94 |
| Northeastern mixed sorghum and maize area | 965 | -11 | 79 | 9 | 0.83 |
Table 3.49. CropWatch-estimated maize, wheat and soybean production for Mexico in 2017 (thousands tons)
| Crops | Production 2016 | Yield variation | Area variation | Production 2017 | Production variation |
| Maize | 23780 | -0.2% | 0.5% | 23858 | 0.3% |
| Wheat | 3550 | -0.7% | -6.9% | 3283 | -7.5% |