
 English
 中文
中文
Bulletin
CropWatch bulletinMenu
Authors: 超级管理员 | Edit: tanshen
From early July to September, harvesting of the main maize crop took place in the south (July/August) and the north (August/September) of the country. Rainfed rice was also harvested, while in October harvesting of irrigated rice began. A second maize crop started to be planted in August.
At the national level, the CropWatch agroclimatic indicators were close to average. A slight increase was registered for RAIN (+2%), while minor decreases were noted for TEMP, RADPAR, and BIOMSS (-0.8ºC, -4% and -1%, respectively). Meanwhile, the fraction of cropped arable land (CALF) was stable, and VCIx was 0.89.
According to the national NDVI development profile, crop condition from July to October remained below that of the same period last year and also the five-year average. As shown in the NDVI departure clustering maps and profiles, 7.6% of the cropped area had better than average conditions (with a clear peak in August and September). For 7.1% of the cropped area, crop conditions were below the average during the entire monitoring period. Both mentioned areas occur in the south. For about 77.1% of the total cropped area, mostly situated in the northern half of the country, conditions were close to the average.
Regional analysis
Based again on cropping systems, climatic zones, and topographic conditions, Nigeria is divided into four agro-ecological regions. They are referred to (from north to south) as the Sudano-sahelian, derived savana, the humid forest zone, and the Guinean savanna.
In the Sudano-sahelian zone, crop condition development was above the five-year average from early July to late August, and then below from late August up to October. The agroclimatic indicators for this region show an increase in rainfall (RAIN +5%) and decreases in temperature (TEMP -0.7ºC) and radiation (RADPAR -5%). The agronomic indicators show a CALF value of 84%, a reduction of 1% below the five-year average for this indicator, and VCIx of 0.88.
Similar to the Sudano-sahelian zone, the derived savana region shows a decrease in temperature and radiation (TEMP -0.8ºC and RADPAR -1.6%), although rain was unchanged and the drop in sunshine less significant. Generally, crop condition development for this zone was below the five-year average for the entire monitoring period. The agronomic indicators show that while CALF registered a slight increase of 1%, the biomass production potential did not vary.
In the humid forest zone, NDVI was below the five-year average in July; it improved in August and turned about average, but then dropped again until October. The agroclimatic conditions for this area show that while rainfall increased by 3%, temperature was about average and radiation decreased markedly to a value 8% below average. The agronomic indicators show a marginal increase in all variables (BIOMSS +1%, CALF +1%), while the VCIx was 0.85.
As already mentioned for the national NDVI clusters, rather poor conditions prevailed in parts (7.1%) of the south, and essentially in the area with bi-modal rainfall in the Guinean savanna zone. The crop condition development based on NDVI for this region was consistently below the average of the past five years and below the average of the same monitoring period in 2016. BIOMSS and CALF indicators decreased by 3% and 0.1% respectively, while VCIx was 0.91. The agroclimatic indicators show a decrease in temperature (TEMP -0.9ºC) and radiation (RADPAR -3.%), while rainfall increased by 2%.
Conditions were generally favorable in the northern half of the country, but less so in the south. Altogether, CropWatch projects both rice and maize production to increase compared to last year's output.
Figure 3.22. Nigeria crop condition, August-October 2017
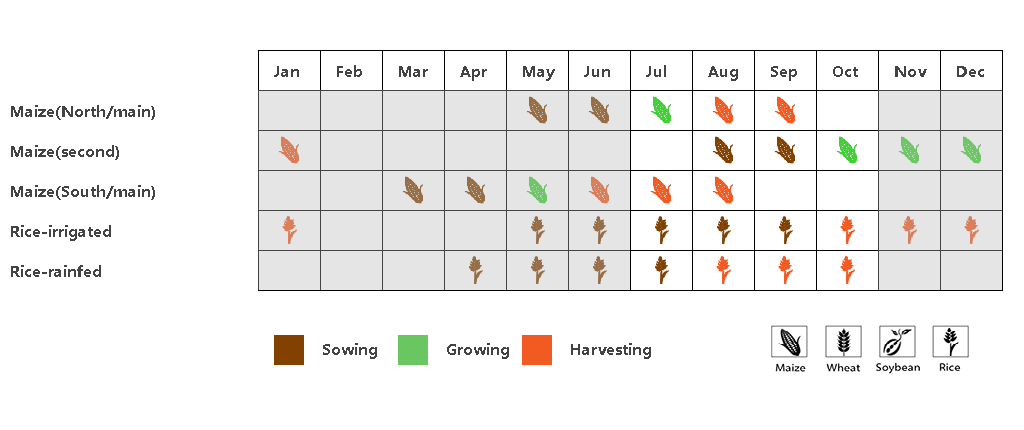
(a) Phenology of major crops


(b) Crop condition development graph based on NDVI (c) Maximum VCI

(d) Spatial NDVI patterns compared to 5YA NDVI profiles


(e) Crop condition development graph based on NDVI Soudano-Sahelian region (left) and (f) Derived savanna zone region (right))


(g) Crop condition development graph based on NDVI and (h) Humid forest zone region (left) and Guinean savanna region (right))
Table 3.53. Nigeria agroclimatic indicators by sub-national regions, current season's values and departure from 15YA, July-October 2017
| Region | RAIN | TEMP | RADPAR | |||
| Current (mm) | Departure from 15YA (%) | Current (ºC) | Departure from 15YA (°C) | Current (MJ/m2) | Departure from 15YA (%) | |
| Sudano Sahelian | 606 | 5 | 28.2 | -0.7 | 1211 | -5 |
| Derived savana | 880 | 0 | 25.8 | -0.8 | 938 | -2 |
| Humid forest Zone | 1216 | 3 | 25.9 | -0.5 | 786 | -8 |
| Guinean savanna | 769 | 2 | 26.0 | -0.9 | 1077 | -3 |
Table 3.54. Nigeria, agronomic indicators by sub-national regions, current season's values and departure from 5YA, July-October 2017
| Region | BIOMSS | Cropped arable land fraction (CALF) | Maximum VCI | ||
| Current (gDM/m2) | Departure from 15YA (%) | Current (%) | Departure from 15YA (%) | Current | |
| Sudano Sahelian | 1572 | 0 | 84 | -1 | 0.88 |
| Derived savana | 2079 | -1 | 99 | 0 | 0.91 |
| Humid forest zone | 2382 | 1 | 97 | 1 | 0.85 |
| Guinean savanna | 1900 | -3 | 99 | 0 | 0.91 |
Table 3.55. CropWatch-estimated maize and rice production for Nigeria in 2017 (thousand tons)
| Crop | Production 2016 | Yield variation (%) | Area variation (%) | Production 2017 | Production variation |
| Maize | 10770 | 3.8 | -0.1 | 11165 | 3.7 |
| Rice | 4588 | 1.9 | 0.2 | 4904 | 2.1 |