
 English
 中文
中文
Bulletin
CropWatch bulletinMenu
Authors: 超级管理员 | Edit: tanshen
Maize in Poland is grown between June and September. July also is the harvest of winter wheat, while in August spring wheat is harvested. Finally, from August to October, winter wheat is being planted.
Over the reporting period, the cropped arable land fraction (CALF) in the country was nearly 100%, remaining the same as the average of the last five years. Both temperature and radiation were below average (TEMP, -0.5°C and RADPAR a significant -8%), while rainfall (RAIN) was up 56% compared to average. The potential biomass production estimate (BIOMSS) increased 40%, mainly in response to rainfall, while the low sunshine may have limited it. As shown in the NDVI crop condition development graphs, the NDVI in Poland was below average when compared to the previous season, especially from July to September. By October, NDVI was close to average. Compared to last five years, NDVI was above average during the reporting period. The VCIx is 0.96 for the whole country.
Overall, the crop condition in Poland is assessed by CropWatch to be average or above.
Regional analysis
Based on the Global Agro-Ecological Zones (GAEZ) map, Poland can be divided into three cropping regions, namely a cold and mesic forest zone, which occupies the northeast of the country; a cool temperate and dry zone (the largest zone); and a cool temperate and moist zone, located in the south and southwest of the country. As shown in the tables, the departure of biomass is consistent with the departure of rainfall in the three zones.
The cold and mesic forest zone experienced above rainfall (RAIN +47%), weak radiation (RADPAR, -11%) and temperature (TEMP, -0.5°C), while the biomass production potential is above (BIOMSS, +38%). CALF in this zone was close to 100%. and the VCIx was good at 0.98.
In the cool temperate and dry zone, agroclimatic indicators show an increase of rainfall over average (RAIN, +59%) and a marked decline of radiation (RADPAR, -8%). Temperature was below average (TEMP, -0.5°C), while the biomass production potential is above (BIOMSS, +42%). CALF in this zone was close to 100%.
Cool temperate and moist zone was the lowest zone with above rainfall (RAIN +37%), weak radiation (RADPAR, -4%) and temperature (TEMP, -0.3°C). The biomass production potential was +26% compared to the average. Regional CALF is 100%, and the VCIx was good at 0.91.
Overall, both crop condition and BIOMSS were above average across the three zones due to sufficient rainfall in the monitoring period, pointing to an estimated yield and production in 2017 that both increase over 2016.

Figure 3.25a. Poland phenology of major crops

Figure 3.25b. Poland national level crop condition development graph based on NDVI, comparing the July-October 2017 period to the previous season and the five-year average (5YA) and maximum

Figure 3.25c. Poland maximum VCI for April-July 2017 by pixel
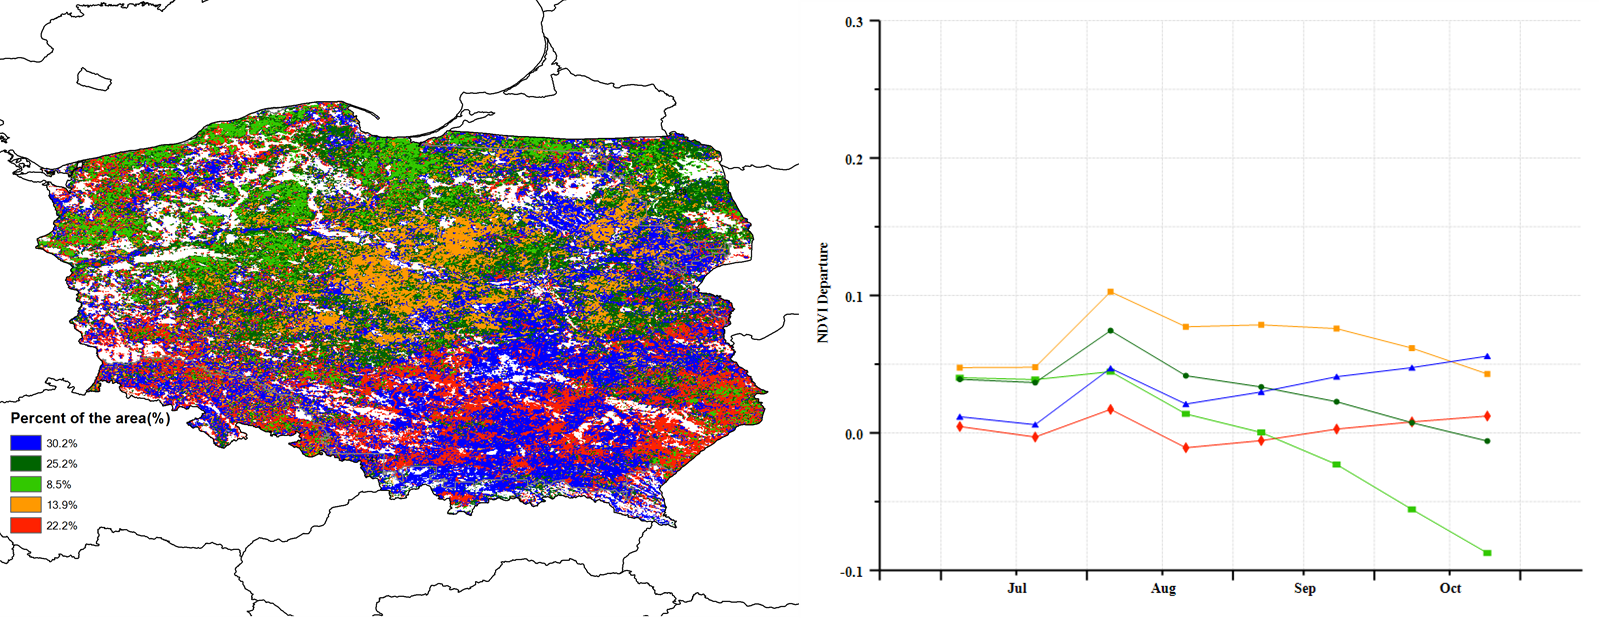
Figure 3.25d. Poland spatial NDVI patterns up to October 2017 according to local cropping patterns and compared to the 5YA (left) and (e) associated NDVI profiles (right).

Figure 3.25f. Cold and mesic forest zone (Poland) crop condition development graph based on NDVI

Figure 3.25g. Cool temperate and moist zone (Poland) crop condition development graph based on NDVI

Figure 3.25h. Cool temperate and dry zone (Poland) crop condition development graph based on NDVI
Table 3.61. Poland agroclimatic indicators by agro-ecological region, current season's values and departure from 15YA, July-October 2017
| Region | RAIN | TEMP | RADPAR | |||
| Current (mm) | Departure from 15YA (%) | Current (°C) | Departure from 15YA (°C) | Current (MJ/m2) | Departure from 15YA (%) | |
| Cold and mesic forest zone | 381 | 47 | 14.2 | -0.5 | 696 | -11 |
| Cool temperate and dry zone | 386 | 59 | 15.1 | -0.5 | 738 | -8 |
| Cool temperate and moist zone | 398 | 37 | 14.7 | -0.3 | 785 | -4 |
Table 3.62. Poland agronomic indicators by agro-ecological region, current season's values and departure from 5YA, July-October 2017
| Region | BIOMSS | Cropped arable land fraction | Maximum VCI | ||
| Current (gDM/m2) | Departure from 5YA (%) | Current (%) | Departure from 5YA (%) | Current | |
| Cold and mesic forest zone | 1456 | 38 | 100 | 0 | 0.98 |
| Cool temperate and dry zone | 1438 | 42 | 100 | 0 | 0.96 |
| Cool temperate and moist zone | 1467 | 26 | 100 | 0 | 0.91 |
Table 3.63. CropWatch-estimated wheat production for Poland in 2017 (thousand tons)
| Crops | Production 2016 | Yield variation | Area variation | Production 2017 | Production variation |
| Wheat | 10704 | 2.10% | 0.00% | 10931 | 2.10% |