
 English
 中文
中文
Bulletin
CropWatch bulletinMenu
Authors: 超级管理员 | Edit: tanshen
Russia experienced favorable climate conditions (VCIx=0.96) during the current reporting period. During the reporting period, the winter wheat harvest began in July, while the harvest of maize started in August. Also in August, spring wheat started to be sowed. The cropped arable land fraction for Russia was 2% above its five-year average for the period. In general, the country experienced cool and wet conditions over the recent four months. Compared with average, precipitation had a small increase (RAIN +8%) while temperature and radiation were somewhat lower (-0.7°C and -2%, respectively). Mainly due to weather condition, the BIOMSS indicator increased by 5% nationwide compared to the five-year average.
As shown in the NDVI crop condition development graph for the country, the values exceed the recent five-year average in July, the time of the biomass peak when maize and wheat are close to maturity. Crop condition was generally favorable in most parts of Russia’s croplands. Compared with the previous season, maize and wheat production are expected to increase (+3.9% and +2.4%, respectively).
Regional analysis
A more detailed analysis is provided for seven agro-ecological zones, namely the Kalingrad region (94), Caucasus (95), Volga region (97), central region (100), southern Urals (99), south Siberia (98), and the northwest region (101). The numbers correspond to the labels on the VCIx map.
In Kalingrad, Volga, southern Siberia, central, and northwest regions, patterns are close to the national one, that is: weather conditions were favorable for crops. Rainfall is abundant and varied from + 6% to +76%. The NDVI values in those areas (see the map of spatial NDVI patterns) are higher than usual in June and July. In Kalingrad and the northwest region, the excess of rainfall was significant (between +41% and +76%) and accompanied by cool temperature and very low sunshine (up to -13% RADPAR). The NDVI values in those areas are lower than last year due to complicated climate conditions.
Unlike most of Russia, the Caucasus and southern Urals regions experienced a shortage of rainfall (RAIN -16% and -13% respectively, compared with the average), with BIOMSS decreasing accordingly (-10% and -8%). NDVI also decreased in about 13.2% of Russia's arable land.
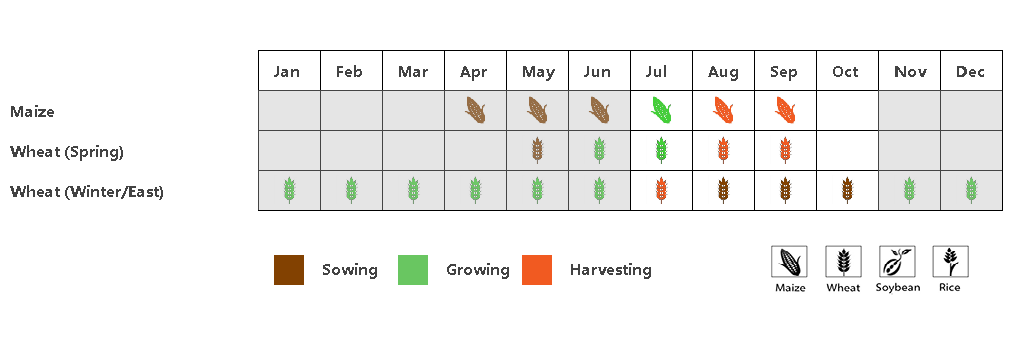
Figure 1. Russia phenology of major crops


Figure 2. Russia national level crop condition development graph based on NDVI, comparing the July-October 2017 period to the previous season and the five-year average (5YA) and maximum
Figure 3. Russia maximum VCI for July-October 2017 by pixel

Figure 4. Russia spatial NDVI patterns up to October 2017 according to local cropping patterns and compared to the 5YA (left) and (e) associated NDVI profiles (right)


| (f) Crop condition development graph based on NDVI (Kalingrad (left) and Caucasian (right)) |

| (g)Crop condition development graph based on NDVI (North Subarctic area (left) andVolga (right)) |

(h) Crop condition development graph based on NDVI (Central area (left) and South Urals area (right))


Cropcondition development graph based on NDVI (South Siberian area (left) and Northwestarea (right))
Table 1. Russia agroclimatic indicators by sub-national regions, current season's values and departure from 15YA, July-October 2017
| Regions Name | RAIN | TEMP | RADPAR | |||
| Current (mm) | Departure from 15YA (%) | Current (°C) | Departure from 15YA (°C) | Current (MJ/m2) | Departure from 15YA (%) | |
| Kalingrad (Russia) | 506 | 76 | 14.4 | -0.4 | 704 | -9 |
| Caucasus (Russia) | 169 | -16 | 19.5 | 0.3 | 1024 | 6 |
| Volga (Russia) | 239 | 10 | 13.6 | -0.8 | 786 | -2 |
| Central area (Russia) | 278 | 11 | 13.7 | -0.7 | 742 | -5 |
| Southern Urals area (Russia) | 197 | -13 | 11.8 | -1.1 | 759 | 0 |
| South Siberian area (Russia) | 274 | 13 | 10.3 | -0.9 | 807 | -3 |
| Northwest area (Russia) | 396 | 41 | 12.3 | -1.2 | 619 | -13 |
Table 2. Russia agronomic indicators by sub-national regions, current season's values and departure from 5YA, July-October 2017
| Regions Name | BIOMSS | Cropped arable land fraction | Maximum VCI | ||
| Current (gDM/m2) | Departure from 5YA (%) | Current | Departure from 5YA (%) | Current | |
| Kalingrad (Russia) | 1686 | 45 | 100% | 0 | 0.94 |
| Caucasus (Russia) | 715 | -10 | 86% | 7 | 0.83 |
| Volga (Russia) | 976 | 5 | 99% | 4 | 1.02 |
| Central area (Russia) | 1158 | 10 | 100% | 0 | 0.99 |
| Southern Urals area (Russia) | 891 | -8 | 100% | 1 | 0.98 |
| South Siberian area (Russia) | 1086 | 8 | 98% | 1 | 0.93 |
| Northwest area (Russia) | 1497 | 29 | 100% | 0 | 1.00 |
Table 3. CropWatch-estimated maize and wheat production for Russia in 2017 (thousand tons)
| Crops | Production 2016 | Yield variation | Area variation | Production 2017 | Production variation |
| Maize | 12337 | 3.9% | 0.0% | 12817 | 3.9% |
| Wheat | 57506 | 2.7% | -0.2% | 58912 | 2.4% |