
 English
 中文
中文
Bulletin
CropWatch bulletinMenu
Authors: 超级管理员 | Edit: tanshen
The monitoring period covers the end of the southeast Asian monsoon season in Thailand. The maize harvest was completed in September, while the main rice crop was sown in July and harvested in October.
At the national level, agroclimatic indices show that radiation (RADPAR -3%) and temperature (TEMP -0.26°C) were below average, while accumulated rainfall (RAIN +12%) was above. Although the production potential (BIOMSS) increased 8%, crop condition is not favorable according to the NDVI development graph for the national level. According to the NDVI profiles, crop condition was below average at he beginning of the monitoring period in 65.6% of cropped areas. It then improved after mid-August in parts of the single-cropped rice and horticulture areas, representing 37.2% of croplands. Other parts of the horticulture area as well as the double and triple-cropped rice area were slightly below average in terms of crop condition throughout the monitoring period, together representing 26.9% of cropped areas. Persistently poor conditions, worsening even after July, are confined to 1.5% of croplands in the single-cropped rice area and the double and triple-cropped rice area.
Regional analysis
The regional analysis below focuses on some of the already mentioned agro-ecological zones of Thailand, of which some are defined by the rice cultivation typology in the area. Agro-ecological zones include the double and triple-cropped rice area (109) in the center of the country, the mountain area (108) in the west, south, and north of the country, the horticulture area (107) in the east, and the single-cropped rice area (106) in the northeast. The numbers correspond to the labels in the VCIx and NDVI profile maps.
Indicators for the double and triple-cropped rice area follow the same patterns as those for the country as a whole: temperature was average, radiation slightly below (RADPAR -2%), and accumulated rainfall was in excess (RAIN +26%), resulting in the largest biomass production potential increase in Thailand (BIOMSS +14%). The NDVI development graph, however, shows that crop condition was unfavorable in this region due to excess precipitation and reduced sunshine. This is confirmed by the VCIx map and applies particularly to Phitsanulok, Phichit, Samut Sakhon, and Samut Songkhram. Overall, the situation was below but close to average.
Conditions were very close to average in the mountain region: RAIN +1%, TEMP + 0.2°C, RADPAR -2%, and BIOMSS +3% when compared to the five-year average. According to the NDVI development graph, crop condition was below average, while the NDVI profiles show that most of this region was slightly above average. Overall, the situation was slightly above but close to average.
The horticulture area was the only agro-ecological region in Thailand that recorded a slight negative anomaly for all indicators: RAIN -8%, TEMP -0.3°C, and RADPAR -1%. The VCIx map, NDVI development graph, and BIOMSS indicators (-1%) all lead to the conclusion that crop condition was close to average.
Finally, the situation in the single-cropped rice area was comparable to that of the country as a whole: rainfall was above average (RAIN +22%) with lower temperature (TEMP -0.6°C) and radiation (RADPAR -4%). BIOMSS (+11%) shows above average values. The NDVI development graph shows that crop condition was below average, probably due to excess water and low sunshine. According to the NDVI profiles, crop condition in most of this region was close to average.
At the national level, most arable land was cropped during the season and had favorable VCIx values around 0.9. CropWatch projections are that the production of maize and rice will slightly decrease compared to last year's output.
Figure3.28. Thailand crop condition, July-October 2017
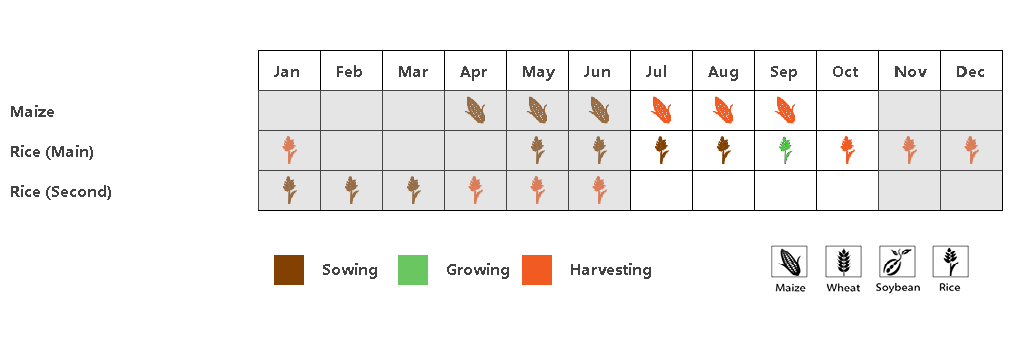
Figure 3.28a. Thailand phenology ofmajor crops


Figure 3.28b. Thailand national level crop condition development graph based on NDVI, comparing the April-July 2017 period to the previous season and the five-year average (5YA) and maximumFigure 3.28c. Thailand maximum VCI forApril-July 2017 by pixel

Figure 3.28d. Thailand spatial NDVIpatterns up to July 2017 according to local cropping patterns and compared tothe 5YA (left) and (e) associated NDVI profiles (right)


Figure 3.28f.Double_triple-cropped ricearea (Thailand) crop condition development graph based on NDVI Figure 3.28g. Mountains area(Thailand)crop condition development graph based on NDVI


Figure 3.28h. Horticulture area(Thailand) crop condition development graph based on NDVI Figure 3.28i. Single-cropped rice area (Thailand) crop condition development graph based on NDVI
Table 70. April- July 2017 agro-climatic indicators by agro-ecological region, current season values and departure from 15YA
| Region | RAIN | TEMP | RADPAR | |||
| Current (mm) | Departure from 15YA (%) | Current (°C) | Departure from 15YA (°C) | Current (MJ/m2) | Departure from 15YA (%) | |
| Single-cropped rice area (Thailand) | 1251 | 22 | 27.5 | -0.6 | 959 | -4 |
| Horticulture area (Thailand) | 1011 | -8 | 27.3 | -0.3 | 957 | -1 |
| Mountains area (Thailand) | 961 | 1 | 26.4 | 0.2 | 925 | -2 |
| Double and triple-cropped rice area (Thailand) | 1072 | 26 | 27.5 | -0.5 | 940 | -2 |
Table 71. April- July 2017 agronomic indicators by by agro-ecological region, current season values and departure from 5YA
| Region | BIOMSS | Cropped arable land fraction | Maximum VCI | ||
| Current (gDM/m2) | Departure from 5YA (%) | Current (%) | Departure from 5YA (%) | Current | |
| Single-cropped rice area (Thailand) | 2343 | 11 | 99 | 0 | 0.94 |
| Horticulture area (Thailand) | 2378 | 3 | 99 | 0 | 0.94 |
| Mountains area (Thailand) | 2227 | 3 | 100 | 0 | 0.95 |
| Double and triple-cropped rice area (Thailand) | 2371 | 14 | 99 | 0 | 0.91 |
Table 72. CropWatch estimated maize,rice, wheat and soybean production for 2017 (thousands tons)
| Crops | Production 2016 | Yield variation(%) | Area variation (%) | Production 2017 | Production variation(%) |
| Maize | 5080 | -1.4% | -0.2% | 4999 | -1.6% |
| Rice | 39661 | -2.9% | 0.0% | 38495 | -2.9% |