
 English
 中文
中文
Bulletin
CropWatch bulletinMenu
Authors: 超级管理员 | Edit: tanshen
The reporting period covers the harvesting season of maize, rice, soybean, and spring wheat in the United States, as well as the sowing of winter wheat. In general, crop condition was close to average at the time of harvest.
Slightly humid weather was recorded over the United States as a whole, with 11% above average precipitation (RAIN) accompanied by a 2% drop in sunshine (RADPAR). Temperature was about average (TEMP -0.3°C). After serious rainfall shortage, abundant rainfall was recorded over the Northern Plains, including South Dakota (+80%), Nebraska (+91%) and North Dakota (+13%), which provided sufficient soil moisture for spring wheat and maize growing in this region, with some places suffering from excess precipitation. Wet weather conditions and average temperature prevailed in the Corn Belt, covering Illinois (RAIN +13%), Iowa (+44%), Wisconsin (+16%), Indiana (+24%), and Ohio (+14%), providing ample soil moisture for maize and soybean growth. Arkansas, one of the main rice growing states that had experienced excess precipitation during the previous reporting period (+47% from April to July, 2017) now suffered a shortage (-23%) in this monitoring period. Dry weather was also recorded in the Northwest including Washington (RAIN -29%), and Oregon (-20%).
In the main spring wheat zone, NDVI recovered from the very bad conditions at the end of June--thanks to abundant precipitation--in North Dakota, South Dakota, and Nebraska. The peak values in August indicate the good crop performance in this region. In the region from the Corn Belt to the Northeast, positive NDVI departure was recorded from early July to the end of October, also indicating above average crop condition. In the Southern and Southeast regions, above average NDVI departures were maintained from May to October, indicating favorable crop condition. In spite of the shortage of rainfall in Arkansas, the NDVI departure was above the average, most likely because of abundant rainfall in the upstream reaches of the Mississippi basin. The Northwest (and especially in Washington and Oregon) was the only region where NDVI was below average due to a long term water shortage that started during the previous reporting period.
The cropped arable land fraction (CALF) in the United States was 1% over the five-year average and the cropping intensity was 3% above the average.
CropWatch estimates that maize and rice production outperformed the 2017 crop (estimated increases of +0.2% and +3.0%, respectively), while soybean production is projected to decreased -0.3%.
Regional analysis
For the purpose of providing additional spatial detail, CropWatch adopts 12 agro-ecological zones for the United States. Four are listed below: Northern Plains, Corn Belt, Southeast, and Lower Mississippi.
The Northern Plains (North Dakota, South Dakota, Montana, and parts of Nebraska) is the main spring wheat production zone of the United States. The NDVI development profile for this region recovered from being far below last year's profile and the five-year average at the beginning of July; it then stayed slightly below that average. Moist weather was recorded, with RAIN 53% above average, while both TEMP and RADPAR were slightly below average ( -0.3°C and -3%, respectively). Montana and North Dakota recovered from drought and recorded excess rainfall (+22% and +13%, respectively). The estimated biomass production potential (BIOMSS) for the region is +33%, while the cropped arable land fraction is far below average (CALF -16%). Considering the large drop of CALF in this monitoring period, below average output is projected in spite of the late recovery.
The Corn Belt (Iowa, Illinois, Indiana, Ohio, Michigan, Minnesota, and Wisconsin) is the main maize and soybean producing area of the United States. Average crop condition is indicated by the region's NDVI development profile, even though levels are below last year's. Due to the rainy weather (RAIN +29%), with average temperature (TEMP -0.3°C) and radiation (RADPAR -2%), BIOMSS increased by 17% above the five-year average. CALF was stable (0%). Favorable crop condition prevailed in Wisconsin, Michigan, and Illinois, while the crop condition in Ohio should be watched.
The Southeastern states of Alabama, Georgia, and Florida form the major cotton production zone of the United States. Slightly below average crop condition is indicated by this region's NDVI development profile. Average weather was recorded during this reporting period: RAIN -2%; TEMP -0.5°C; and RADPAR -2%. With BIOMSS 1% above the five-year average, a CALF similar to its 2016 value, and VCIx at 0.90, expectations are for average crops.
In the Lower Mississippi, the major rice production zone, the NDVI development profile was almost identical to its 2016 behavior and above the five-year average. Low rainfall (RAIN -21%) was accompanied by low sunshine (RADPAR -3%). The dry weather condition resulted in a BIOMSS decrease of 12%, while crop performance did not suffer due to abundant rainfall in the upstream reaches of the Mississippi basin.
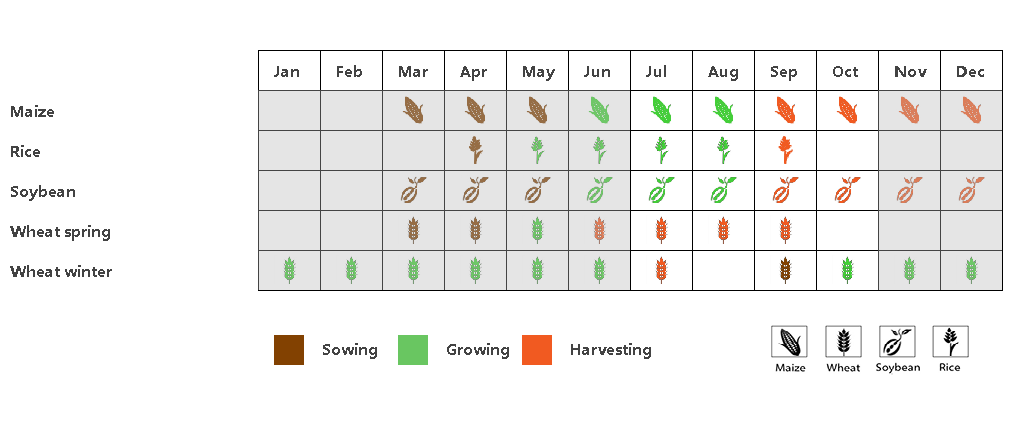
Figure 3.31a. United States phenolgy of major crops
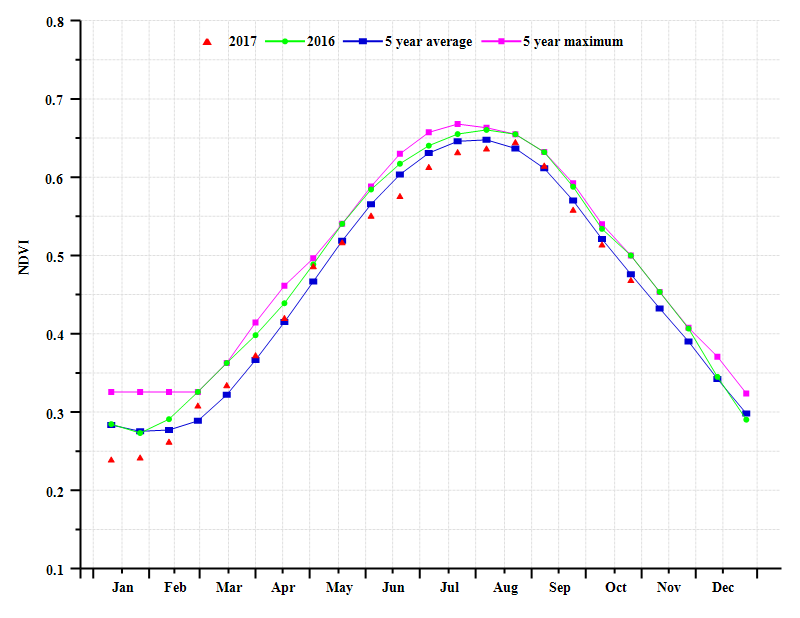
Figure 3.31b. United States national level crop condition development graph based on NDVI, comparing the July- October 2017 period to the previous season and five-year average (5YA) and maximum

Figure 3.31c. United States maximum VCI for July- October 2017 by pixel
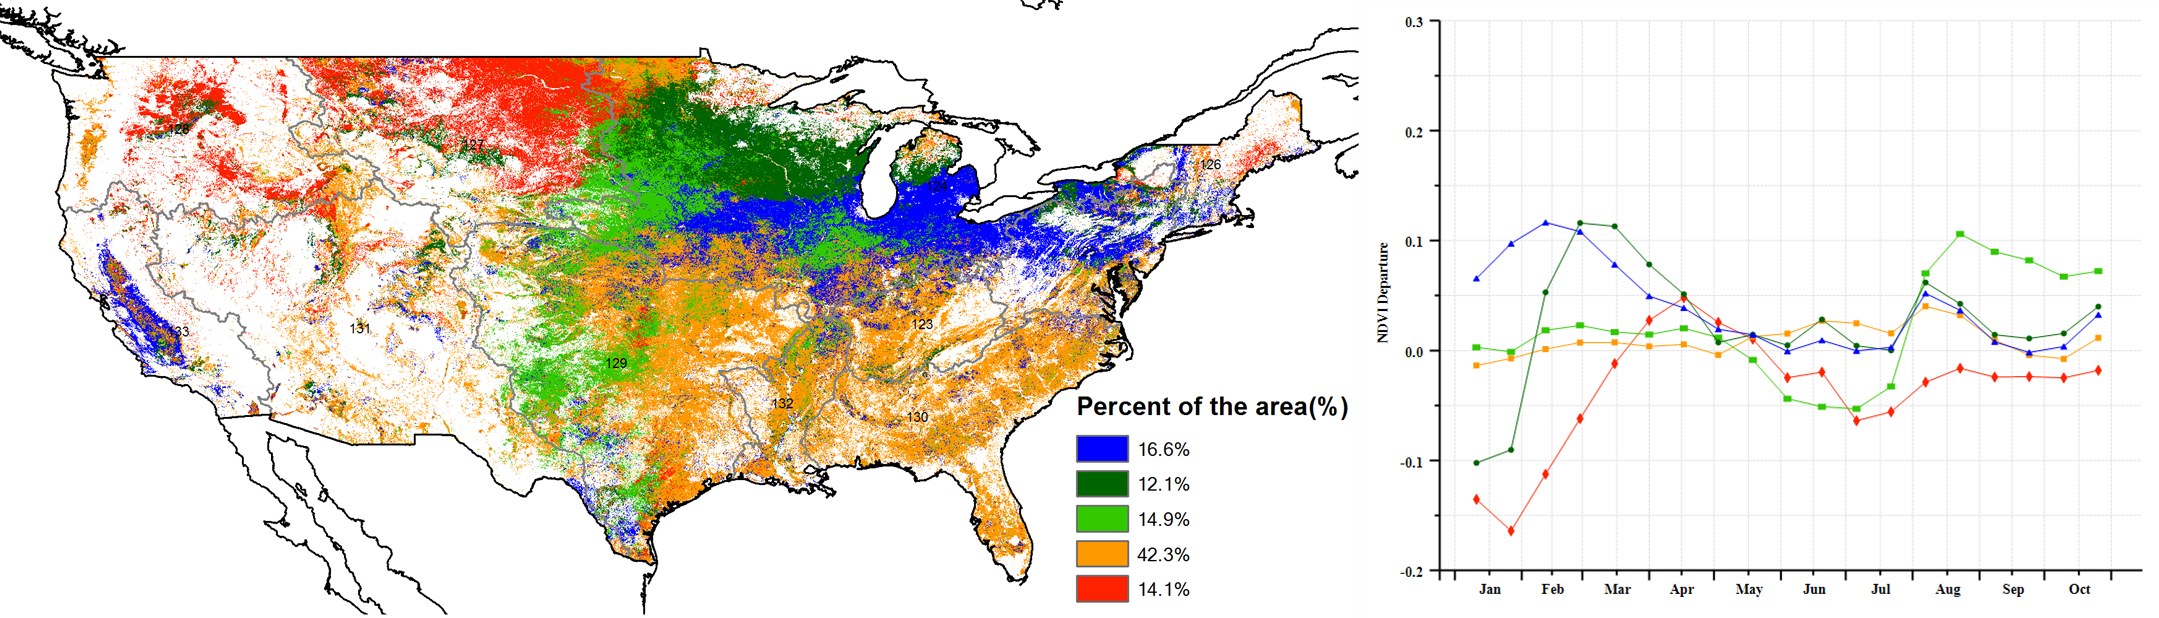
Figure 3.31d. United States spatial NDVI patterns up to October 2017 according to local cropping patterns and compared to the 5YA (left) and (e) associated NDVI profiles (right)
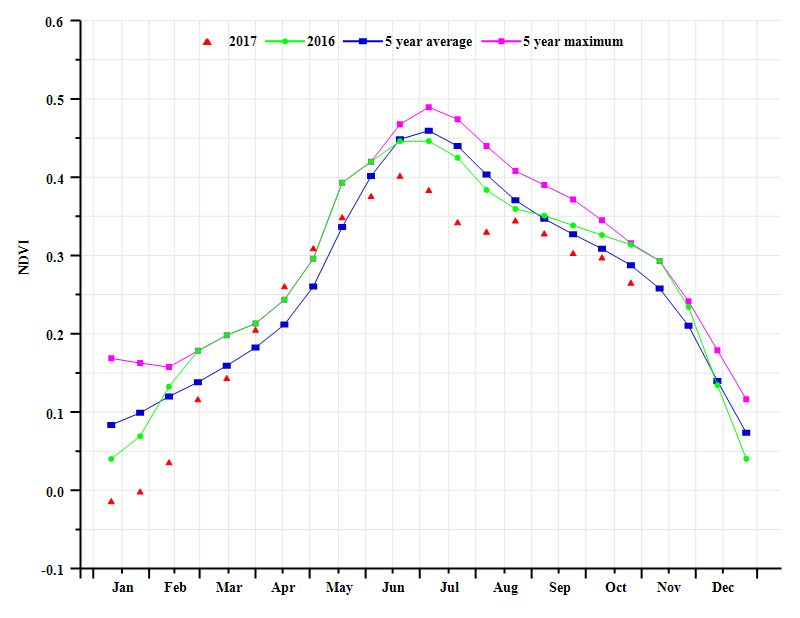
Figure 3.31e. North plains (United States) crop condition development graph based on NDVI

Figure 3.31f. Corn Belt (United States) crop condition development graph based on NDVI
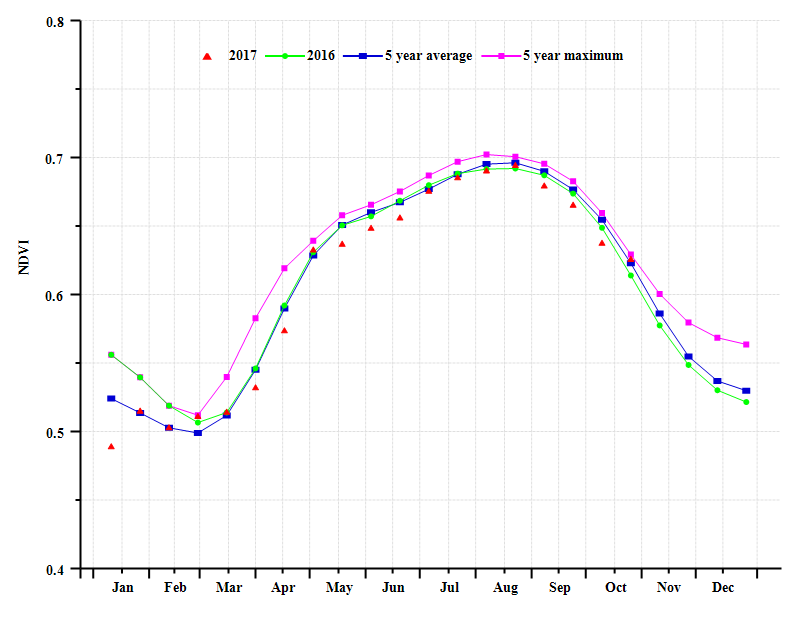
Figure 3.31g. Southeast (United States) crop condition development graph based on NDVI

Figure 3.31h. Lower Mississippi (United States) crop condition development graph based on NDVI
Table 3.79. United States agroclimatic indicators by agro-ecological region, current season's values and departure from 15YA, April-July 2017
| Region | RAIN | TEMP | RADPAR | |||
| Current (mm) | Departure from 15YA (%) | Current (°C) | Departure from 15YA (°C) | Current (MJ/㎡) | Departure from 15YA (%) | |
| Blue Grass | 442 | 0 | 20.6 | -0.9 | 1059 | -1 |
| Corn Belt | 505 | 29 | 18.3 | -0.3 | 1037 | -2 |
| Middle Atlantic | 403 | -10 | 19.2 | 0.1 | 996 | -2 |
| Northeast | 401 | -9 | 17.1 | 0.5 | 964 | 0 |
| Northern Plains | 292 | 53 | 16.1 | -0.3 | 1104 | -3 |
| Northwest | 114 | -4 | 14.8 | -0.2 | 1175 | -1 |
| Southern Plains | 425 | 19 | 23.0 | -0.9 | 1166 | -2 |
| Southeast | 511 | -2 | 23.9 | -0.5 | 1069 | -2 |
| Southwest | 185 | 12 | 18.7 | -0.2 | 1260 | -3 |
| Lower Mississippi | 369 | -21 | 23.9 | -0.9 | 1097 | -3 |
| California | 55 | 5 | 18.7 | 0.4 | 1346 | -2 |
Table 3.80. United States agronomic indicators by agro-ecological region, current season's values and departure from 5YA, April-July 2017
| Region | BIOMASS | CALF | Maximum VCI | ||
| Current (gDM/㎡) | Departure from 5YA (%) | Current (%) | CALF departure | Current | |
| Blue Grass | 1468.71 | 3.60 | 99.98 | 0.02 | 0.93 |
| Corn Belt | 1486.22 | 16.79 | 99.88 | 0.16 | 0.95 |
| Middle Atlantic | 1374.29 | -6.10 | 99.94 | 0.01 | 0.97 |
| Northeast | 1312.16 | -9.50 | 99.97 | 0.01 | 0.95 |
| Northern Plains | 1043.99 | 32.52 | 63.86 | -16.13 | 0.68 |
| Northwest | 521.08 | 8.95 | 69.06 | 8.09 | 0.87 |
| Southern Plains | 1232.95 | 12.82 | 88.06 | 9.83 | 0.90 |
| Southeast | 1557.23 | 1.14 | 99.86 | -0.01 | 0.90 |
| Southwest | 723.77 | 8.01 | 39.63 | 7.63 | 0.81 |
| Lower Mississippi | 1218.25 | -12.01 | 99.86 | 0.02 | 0.94 |
| California | 239.51 | 20.51 | 40.54 | 3.94 | 0.84 |
Table 3.81. CropWatch-estimated maize, wheat and soybean production for United States in 2017 (thousand tons)
| Types | Production 2016 | Yield variation | Area variation | Production 2017 | Production variation |
| Maize | 367862 | 0.2% | 0.4% | 370173 | 0.6% |
| Rice | 10528 | 3.0% | 0.8% | 10933 | 3.8% |
| Wheat | 56877 | -1.9% | -1.7% | 54812 | -3.6% |
| Soybean | 110024 | -0.3% | 0.0% | 109649 | -0.3% |