
 English
 中文
中文
Bulletin
CropWatch bulletinMenu
Authors: 超级管理员 | Edit: tanshen
The monitoring period covers the harvesting and sowing stages of winter wheat in Uzbekistan, as well as the growing and harvesting stages of maize. Crop condition was generally favorable. The national average VCIx was 0.87, and the cropped arable land fraction was 12% above the five-year average.
Among the CropWatch agroclimatic indicators, RAIN and RADPAR were above average; RAIN was 73 mm instead of 38 mm, which represents a 92% increase, while RADPAR increased by 1%. The CropWatch temperature indicator, TEMP, was slightly below average (-0.2°C). The combination of factors resulted in high BIOMSS (+88%) compared to average. As shown by the NDVI development graph, crop condition was above average from August to late September and below in October. NDVI cluster graphs and profiles show that 52.9% of the agriculture areas had above average condition from August to late September (covering mainly parts of Qunghirot, Chimbay, Altynkul, and Takhtakupyr provinces, as well as the three eastern provinces (Namangan, Andijon, and Farghona) where most wheat is produced; Quqon and Guliston provinces; and part of Samarqand, Qarshi, Urganch Khiva, and Denau provinces). NDVI was below average in part of Termez, Bukhoro, Nawoiy, Guzar Kitab, and Munok provinces. Crop condition was normal or above in other regions. Overall, CropWatch expects an increase of 0.8% in wheat production compared with last year, with summer crops also expected to be favorable.
Regional analysis
For the regional analysis, additional details is provided for two agro-ecological zones in the country: the maize and cereals zone, and the cotton zone.
In the maize and cereals zone, NDVI was generally above the five-year average from July to late September, indicating good crop condition. NDVI then decreased from October but crop condition was generally favorable. RAIN was 54% above average, but TEMP and RADPAR were normal (-0.3°C and +1%, respectively). The agroclimatic indicators also include an increase of the BIOMSS index by 43%. The maximum VCI index was 0.87, while the cropped area increased by 11% compared to the five-year average. Overall crop prospects are favorable.
The western and northern areas of the country constitute the cotton zone. Crop condition was above the five-year average from August to late September. Accumulated rainfall was about five times the average during the monitoring period (RAIN +362%), radiation was above average (RADPAR 1%), while temperature (TEMP -0.2°C) was just below average. The agroclimatic indices for the current season indicate very favorable weather conditions for crop growth, which is confirmed by the significant increase of the BIOMSS index by 225% compared to its five-year average. The regional average of the VCIx was 0.90. Overall crop prospects for the country are favorable.
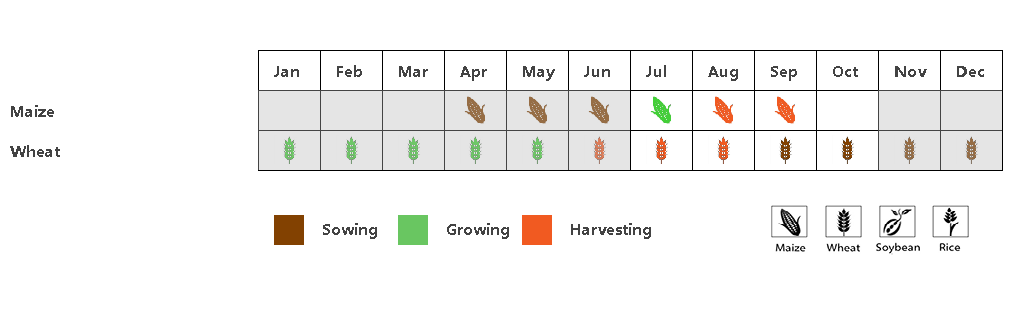
(a). Phenology of major crops


(b) Crop condition development graph based on NDVI (c) Maximum VCI

(d) Spatial NDVI patterns compared to 5YA (left) NDVI profiles (right)
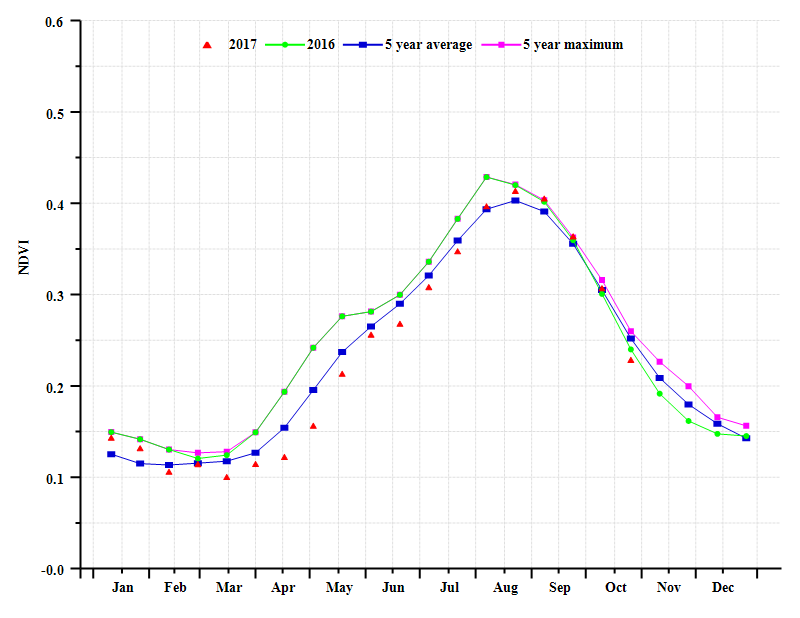
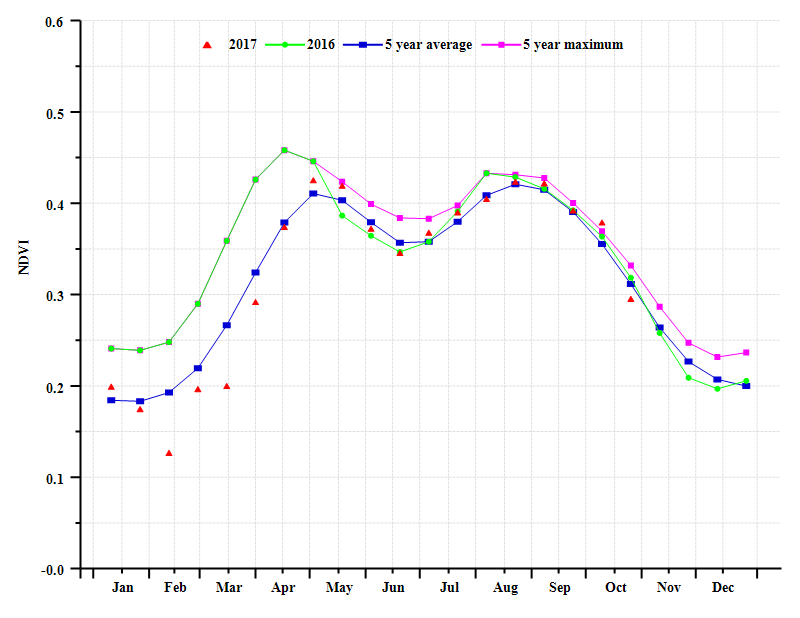
(e) Crop condition development graph based on NDVI (Cotton region (left) (f) Maize and Cereals region (right)
Table 3.83. Uzbekistan agroclimatic indicators by agro-ecological region, current season's values and departure from 15YA, July - October 2017
| Region | RAIN | TEMP | RADPAR | |||
| Current (mm) | Departure from 15YA (%) | Current (°C) | Departure from 15YA (°C) | Current (MJ/m2) | Departure from 15YA (%) | |
| Cotton zone | 206 | 362 | 22.0 | -0.2 | 1191 | 1 |
| Maize and cereals zone | 57 | 54 | 21.2 | -0.3 | 1263 | 1 |
Table 3.84. Uzbekistan agronomic indicators by agro-ecological region, current season's values and departure from 5YA, July - October 2017
| Region | BIOMSS | CALF | Maximum VCI | ||
| Current (gDM/m2) | Departure from 5YA (%) | Current | Departure from 5YA (%) | Current | |
| Cotton zone | 612 | 225 | 73 | 14 | 0.90 |
| Maize and cereals zone | 215 | 43 | 56 | 11 | 0.87 |
Table 3.85. CropWatch-estimated wheat production for Uzbekistan in 2017 (thousand tons)
| Type | Production 2016 | Yield variation (%) | Area variation (%) | Production 2017 | Production variation (%) |
| Wheat | 6391 | 0.1 | 0.7 | 6442 | 0.8 |