
 English
 中文
中文
Bulletin
CropWatch bulletinMenu
Authors: 超级管理员 | Edit: tanshen
Summer and autumn rice harvesting in Vietnam has been completed during the reporting period, while late rice is still growing.
Generally, compared with the recent five-year average and the same period last year, crop condition in Vietnam was significantly lower than normal, except during August. Initial NDVI values for the reporting period were unstable, but the fluctuation gradually became smaller after August. For about 35.4% of croplands (mainly in the southeast and center of the country), the crop condition is above the reference five-year average, with a VCIx of almost 0.93 confirming the favorable situation. Unfavorable crops occur in about 18.7% of the arable land, mainly in the southwest and in a limited area in the north. In the north, covering about 27.7% of Vietnam's arable land area, NDVI increased above average after August. The national NDVI condition development graph indicates mostly below average crop condition. CropWatch agroclimatic indicators show that precipitation (RAIN), biomass production (BIOMSS), cropped arable land fraction (CALF), cropping intensity (CI), and the maximum vegetation condition index (VCIx) were slightly above their averages for the region and period, while temperature (TEMP) and radiation (RADPAR) were slightly below. RAIN in fact was 17% above average. Overall crop condition in the country is considered satisfactory.
Regional analysis
Based on cropping systems, climatic zones, and topographic conditions, three sub-national agro-ecological regions are distinguished for Vietnam. They include northern Vietnam, middle Vietnam, and southern Vietnam.
In northern Vietnam, abundant precipitation (RAIN +47%), well below average radiation (RADPAR -15°C), and close to average temperature (TEMP -0.4°C) were recorded. The CALF for the region was unchanged compared to its five-year average, while BIOMSS was up 20% and VCIx was high (0.94). NDVI was especially poor in July and September, although findings are inconclusive because of the above mentioned erratic behavior of the NDVI values in the crop condition development graph. Based on the agroclimatic indicators, about average output is expected.
In southern Vietnam and middle Vietnam, agroclimatic and agronomic conditions and their assessed impact on crops are very similar, with indicator values for middle Vietnam as follows: RAIN +4%, TEMP 0.1°C, RADPAR -4%, BIOMSS +5%, VCIx 0.94, and CALF +0%. The crop condition development graph of NDVI for Middle Vietnam reached the maximum of the last five years in August and September. According to the agroclimatic indicators, above average output is expected.
Southern Vietnam was characterized by low radiation (RADPAR -4%) and average RAIN (+2%), TEMP (+0.2°C) and BIOMSS (+3%). VCIx was high (0.93) with CALF up 1% over 2016. However, the crop condition development graph of NDVI indicates mostly below average crop condition, especially in July. CropWatch expects average production.
With the mentioned caveats, crop prospects are generally similar to the average. Rice production for 2017 is also expected to be average.
Figure 3.33. Vietnam crop condition, July-October 2017
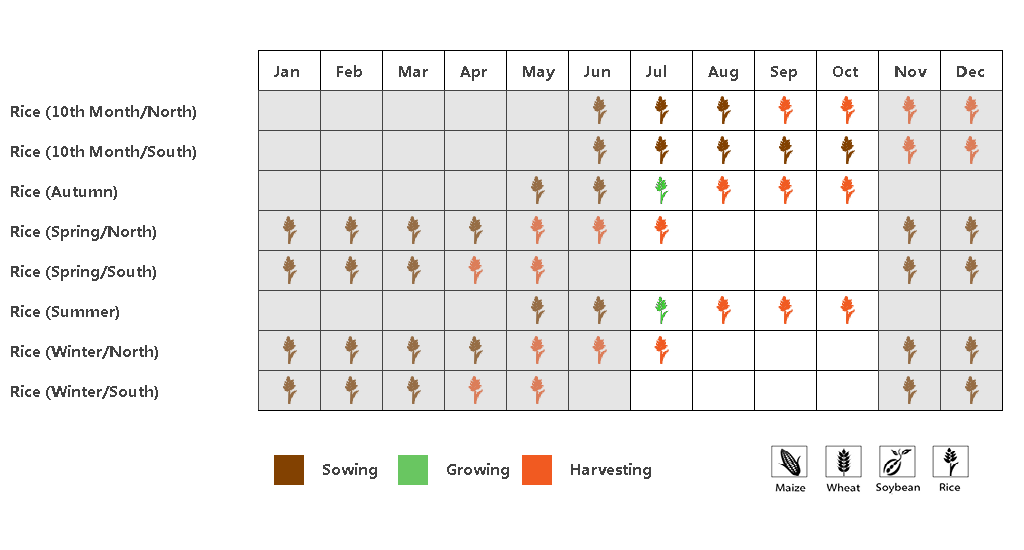
Figure 3.33a. Vietnam phenology of major crops


Figure 3.33b. Vietnam national level crop condition development graph based on NDVI, comparing the July-October 2017 period to the previous season and the five-year average (5YA) and maximumVCI

Figure 3.33c. Vietnammaximum VCI for July-October 2017 by pixel
Figure 3.33d. Vietnamspatial NDVI patterns up to October 2017 according to local cropping patternsand compared to 5YA (left) and (e) associated NDVI profiles (right)


Figure 3.33f. crop condition development graph based on NDVI (right) SouthernVietnam (g) (left) NorthernVietnam
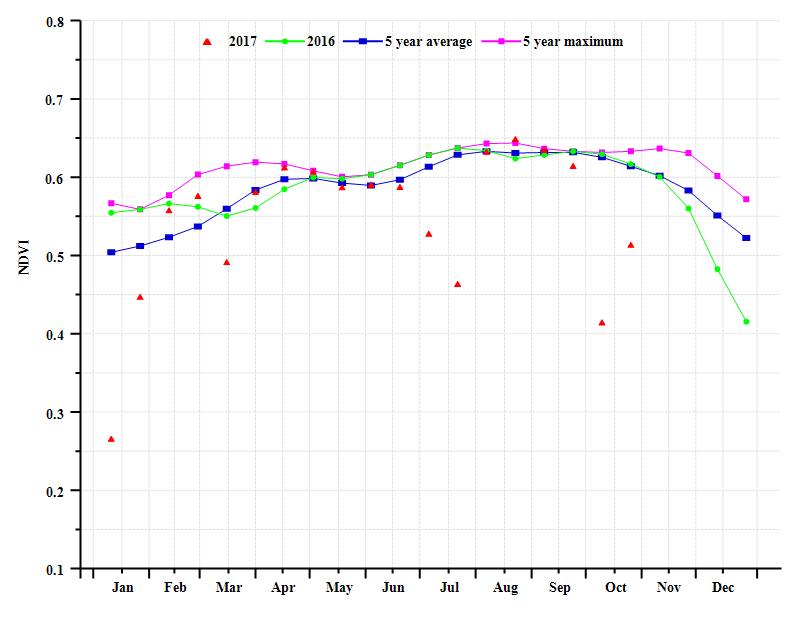
Figure 3.33h. Middle Vietnam (Vietnam) crop condition development graph based on NDVI
Table 3.87 Vietnam agroclimatic indicators by sub-national regions, current season values and departure from 15YA, July-October 2017
| Region | RAIN | TEMP | RADPAR | |||
| Current (mm) | Departure from 15YA (%) | Current (°C) | Departure from 15YA (°C) | Current (MJ/m2) | Departure from 15YA (%) | |
| Southern Vietnam | 1205 | 2 | 26.2 | 0.2 | 945 | -4 |
| Northern Vietnam | 1424 | 47 | 25.2 | -0.4 | 824 | -15 |
| Middle Vietnam | 1309 | 4 | 27.7 | 0.1 | 967 | -4 |
Table 3.88 Vietnam agronomic indicators by agro-ecological region, current season values and departure from 5YA, July-October 2017
Region | BIOMSS | Cropped arable land fraction | Maximum VCI | ||
Current (gDM/m2) | Departure from 5YA (%) | Current (%) | Departure from 5YA (%) | Current | |
Southern Vietnam | 2398 | 3 | 94 | 1 | 0.93 |
Northern Vietnam | 2363 | 20 | 99 | 0 | 0.94 |
Middle Vietnam | 2171 | 5 | 97 | 0 | 0.94 |
Table 3.89 CropWatch-estimated rice production for Vietnam in 2017 (thousands tons)
| Crops | Production 2016 | Yield variation (%) | Area variation (%) | Production 2017 | Production variation (%) |
| Rice | 42550 | 2.0 | 4.7 | 45422 | 6.7 |