
 English
 中文
中文
Bulletin
CropWatch bulletinMenu
Authors: 超级管理员 | Edit: tanshen
Southern China
For Southern China, including some areas of the provinces of Yunnan, Guangxi, Guangdong, and Fujian, the NDVI development graph shows that crop condition was below the average of the recent five years.
According to the agroclimatic indicators, rainfall was above average (RAIN +17%), which accounts for the increase of biomass (BIOMSS +7%). Temperature was slightly below average (TEMP -0.2℃), while radiation was well below (RADPAR -7%). Compared to average, the cropped arable land fraction (CALF) decreased by 1%. The maximum VCI (VCIx) was 0.69.
As shown in spatial NDVI patterns graph and NDVI departure profiles graph, 10.2% of the region's crop area has lower NDVI than average during the monitoring period, affecting small areas of the four provinces. A total of 11.3% of crop area has higher NDVI than average, mainly in western parts of Yunnan province. As a result of the abundant rainfall in Guangdong and Guangxi (RAIN +16% and +39%, respectively), the biomass production potential (BIOMSS) was also above average (beyond 20%) in southern parts of these two provinces, as displayed by the biomass map. Below average rainfall in Fujian province (RAIN -13%) led to lower biomass in most areas of the province. In most areas of Yunnan, the VCIx value was greater than 0.8 because of the moderate increase of RAIN (+5%) .
Overall, the biomass graph indicates crop conditions were just fair in parts of southwest Yunnan, eastern Guangdong, and most of Fujian. Unfavorable agroclimatic and agronomic conditions will have a negative effect on production for these areas, and CropWatch will continue to closely monitor these areas.
Figure 4.18a. Southern China crop condition development graph based on NDVI, comparing the current season up to October 2017 to the previous season, to the five-year average (5YA), and to the five-year maximum
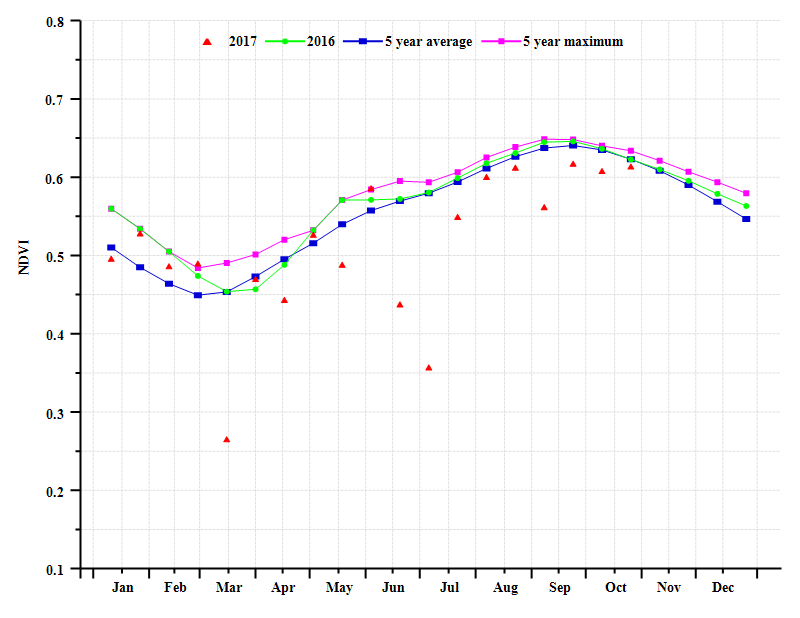
Figure 4.18b. Southern China spatial NDVI patterns for July to October 2017 (compared to the (5YA) (left) and NDVI profiles associated with these spatial patterns (right)
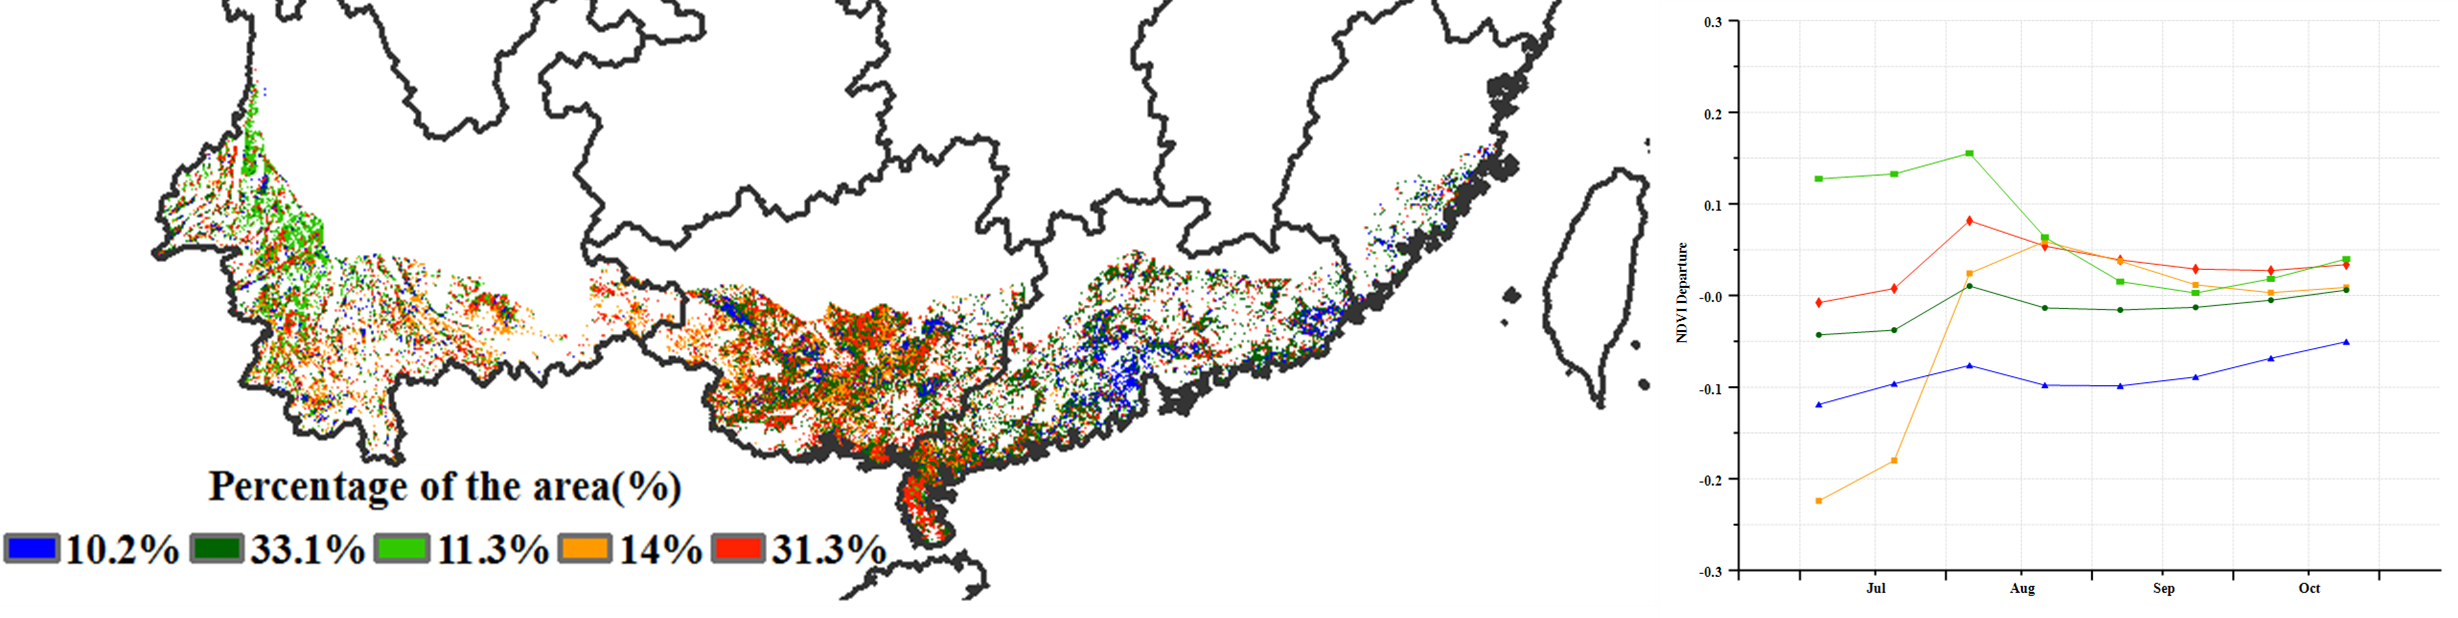
Figure 4.18c. Southern China maximum VCI, July-October 2017

Figure 4.18d. Southern China BIOMSS, July-October 2017
