
 English
 中文
中文
Bulletin
CropWatch bulletinMenu
- Overview
- Country analysis
- Argentina
- Australia
- Bangladesh
- Brazil
- Canada
- Germany
- Egypt
- Ethiopia
- France
- United Kingdom
- Indonesia
- India
- Iran
- Kazakhstan
- Cambodia
- Mexico
- Myanmar
- Nigeria
- Pakistan
- Philippines
- Poland
- Romania
- Russia
- Thailand
- Turkey
- Ukraine
- United States
- Uzbekistan
- Vietnam
- South Africa
- Afghanistan
- Belarus
- Mongolia
- Sri Lanka
- Zambia
- Mozambique
- Kenya
- Angola
- Hungary
- Italy
- Morocco
Authors: 超级管理员 | Edit: Miao
The current reporting period covers the peak development and early harvest of summer crops, and the harvest and sowing of winter wheat. Both the overall rainfall and temperature were slightly below average (RAIN, -3%; TEMP, -0.7°C). The radiation was slightly above average (+2%), while the cropping index was decreasing (-3%). The VCIx was 0.9, and the potential biomass was slightly above the recent five-year average (BIOMSS, +4%), which could be explained by the good condition in two of the three main production provinces (BIOMSS: Manitoba, +20%; Saskatchewan, +13%).
Based on the national NDVI profiles and clusters, the overall crop condition was below that of either last year or the last 5 year average. A similar situation occurred during the previous two reporting periods. The VCIx values in Canada were mostly good (ranging from 0.8 to 1), and only a small part of the central-southern Prairies had values between 0.5 and 0.8. In Manitoba and Saskatchewan, two of the three main production provinces, both RAIN and RADPAR were almost average, and biomass production potential were above the last 5 years average.
As a result, the condition of crops in Canada could be better than last year's due to the normal weather conditions, which contrasts the 2017 drought (which was reflected in poor nationwide indicators). Generally, CropWatch assesses crop growing conditions as slightly better than during 2017.
Regional analysis
The Prairies (area identified as 30 in the maximum VCI map) and Saint Lawrence basin (26, covering Ontario and Quebec) are the major agricultural regions.
In the Prairies, the main food production area in Canada, rainfall was above average (RAIN 224 mm, +5%), but weather was colder than average (-1.7°C), and radiation was close to average (-1%). However, compared to the last 5 years average, the potential biomass improved markedly (BIOMSS, +14%). The Cropped Arable Land Fraction (CALF) were below average (-17%), and the VCIx was 0.88. The NDVI values show that the peak period of the summer crops was slightly better than last year. Due to the dry conditions that prevailed last year, the production of summer crops this year should improve. Sufficient rainfall should also provide adequate soil moisture for winter wheat.
In the Saint Lawrence basin, rainfall was below average (353 mm, -12%), and both the temperature and radiation were slightly above average (TEMP, +0.9°C; RADPAR, +4%). This could have affected the growth of the summer crops in the region. The potential biomass was lower than over the last 5 years average (BIOMSS, -8%). The Cropped Arable Land Fraction were slightly below the average (CALF, -4%), while the VCIx reached 0.93. The NDVI profile of peak period was slightly below or close to the average of last year. The production of summer crops should be slightly lower than during 2017.
Overall, crop condition of Canada is just moderate when compared to the last 5 years, but better than the last year. Current CropWatch estimates indicate increasing productions, including the wheat (31,029 ktons, +1.1% above 2017), maize (11,881 ktons, +0.8% above 2017) and soybean (7,717 ktons, +0.4% above 2017).
Figure 3.14. Canada’s crop condition, July-October 2018

(a). Phenology of major crops


(b) Crop condition development graph based on NDVI (c) Maximum VCI
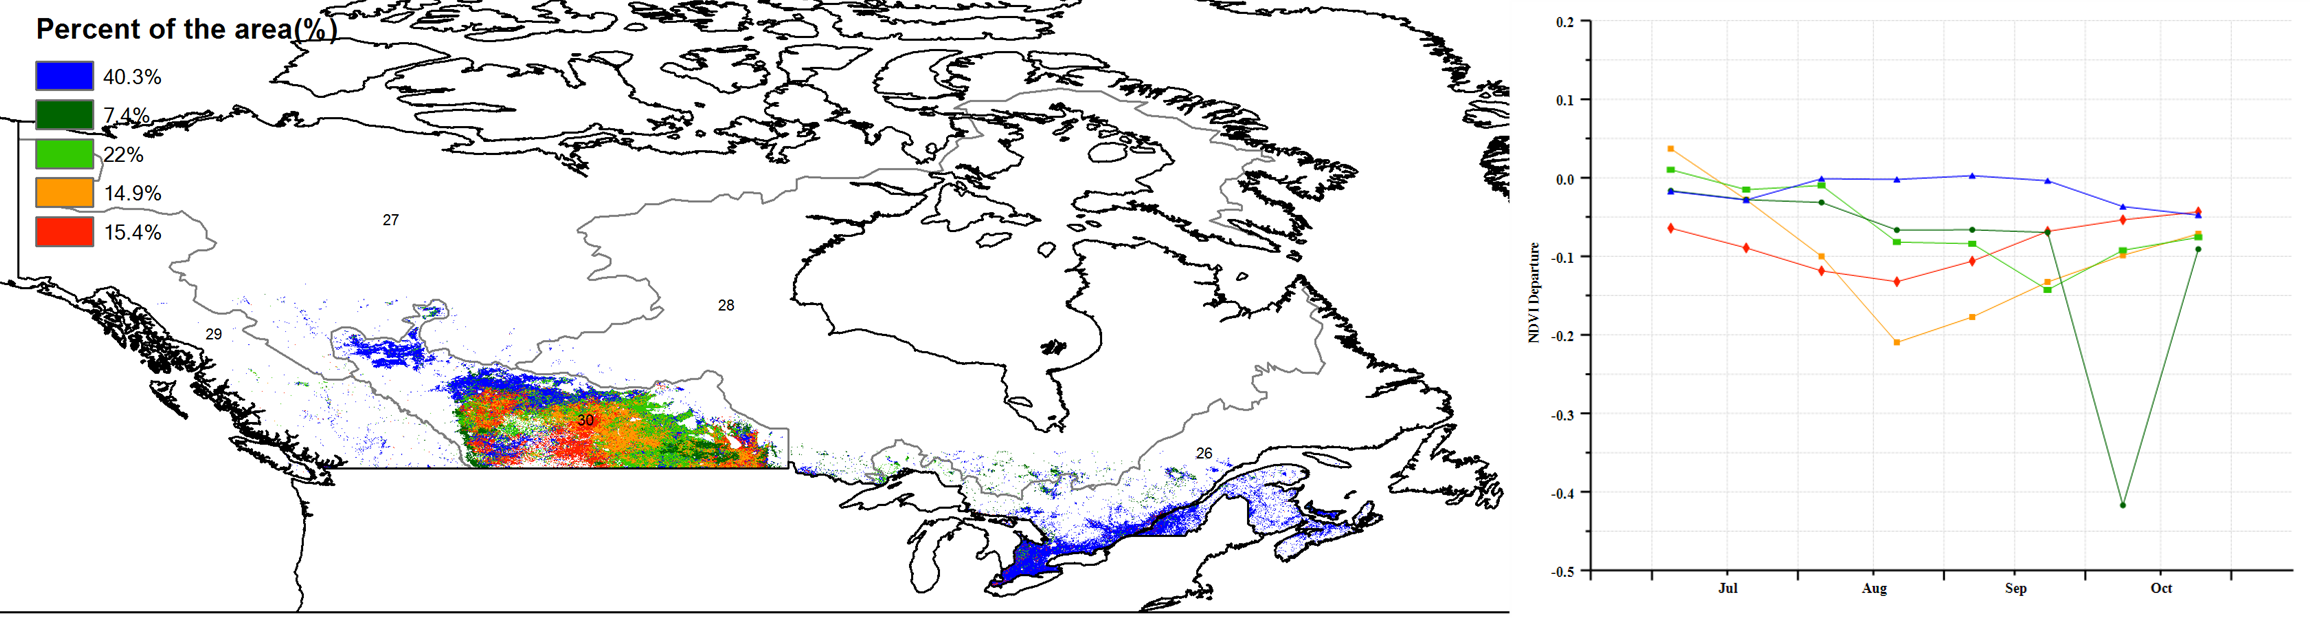
(d) Spatial NDVI patterns compared to 5YA (e) NDVI profiles


(f) Crop condition development graph based on NDVI (Canadian Prairies region (left) and Saint Lawrence basin region (right))
Table 3.17. July- October 2018 Agro-climatic indicators by sub-national regions, current season's values and departure from 15YA
| Region | RAIN | TEMP | RADPAR | |||
| Current (mm) | Departure from 15YA (%) | Current (°C) | Departure from 15YA (°C) | Current (MJ/m2) | Departure from 15YA (%) | |
| National | Rain | Departure | TEMP | Temp departure | PAR | PAR departure |
| Prairies (Canada) | 224 | 5 | 11 | -1.7 | 956 | -1 |
| Saint Lawrence basin (Canada) | 353 | -12 | 14.4 | 0.9 | 926 | 4 |
Table 3.18. July - October 2018 Agronomic indicators by sub-national regions, current season's values and departure from 5YA
| Region | BIOMSS | CALF | Maximum VCI | ||
| Current (gDM/m2) | Departure from 5YA (%) | Current (%) | Departure from 5YA (%) | Current | |
| Prairies (Canada) | 1034 | 14 | 98 | -16 | 0.88 |
| Saint Lawrence basin (Canada) | 1224 | -8 | 100 | -4 | 0.93 |
Table 3.19. CropWatch-estimated maize, wheat, and soybean production for 2018 (thousand tons)
| Crops | Production 2017 | Yield variation (%) | Area variation (%) | Production 2018 | Production variation (%) |
| Wheat | 30679 | 3.4 | -2.2 | 31029 | 1.1 |
| Maize | 11881 | 0.9 | 0 | 11980 | 0.8 |
| Soybean | 7717 | 1.2 | -0.8 | 7744 | 0.4 |