
 English
 中文
中文
Bulletin
CropWatch bulletinMenu
- Overview
- Country analysis
- Argentina
- Australia
- Bangladesh
- Brazil
- Canada
- Germany
- Egypt
- Ethiopia
- France
- United Kingdom
- Indonesia
- India
- Iran
- Kazakhstan
- Cambodia
- Mexico
- Myanmar
- Nigeria
- Pakistan
- Philippines
- Poland
- Romania
- Russia
- Thailand
- Turkey
- Ukraine
- United States
- Uzbekistan
- Vietnam
- South Africa
- Afghanistan
- Belarus
- Mongolia
- Sri Lanka
- Zambia
- Mozambique
- Kenya
- Angola
- Hungary
- Italy
- Morocco
Authors: 超级管理员 | Edit: Miao
Summer crops such as maize and rice were in their vegetative stage or at early harvest during the reporting period growing. All agroclimatic indicators were average, including RADPAR, which is the main limiting factor since almost all crops are irrigatecd.
The nationwide, NDVI profiles show that the crop condition was above average at the beginning of July, below the 5-year average form mid-July to mid-October, to return above the average by the end of October. The spatial NDVI patterns map shows that 44.9% of agricultural areas - mainly in Alexandria (northwest) and Faiyum (middle) - had average conditions throughout the season. Other areas were below the 5 years average from mid-July to mid-October. The maximum VCI map shows fair crops condition (0.5 to 1) and the nationwide VCIx was 0.7. The Cropped arable land fraction (CALF) was 0.6, only 1% above the 5YA.
CropWatch estimates the production of maize, rice, and wheat to be 6.8%, 6.9% and 1.6% (respectively) below 2017 output.
Regional analysis
Egypt can be subdivided into three agro-ecological zones(AEZ) based mostly on cropping systems, climatic zones, and topographic conditions. Only two of them are relevant for crops: the first zone is the Nile Delta and Mediterranean coastal strip, while the second zone is the Nile Valley.
Rainfall was seasonally low in both AEZs (2 mm, in the Nile Delta and Mediterranean coastal strip and 5 mm in the Nile Valley). Since virtually all Egyptian cropped area is irrigated, rainfall makes little change in the outcome of the season, although additional water usually has a beneficial effect. RADPAR was at average (1384 MJ/m2) for Nile Delta and Mediterranean coastal strip, but somewhat below average (1434 MJ/m2) for the Nile Valley.
The NDVI-based Crop condition development graphs indicate below average conditions in the period from mid-July to mid-October for both zones after which crop condition for the two zones returned to be above average, especially in Nile Delta and Mediterranean coastal strip where the crop condition even exceeded the last 5 years maximum after mid-October. Both the VCIx and CALF values for the Nile Valley (0.8 and 0.7, respectively) were slightly higher than in the other zone (0.7 and 0.6).
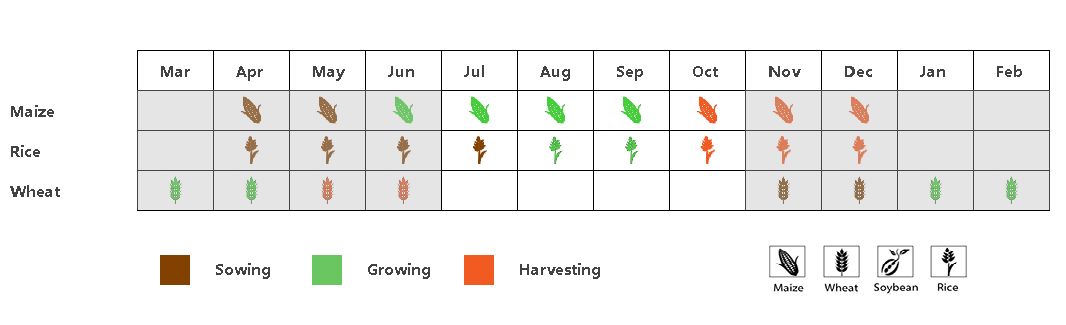
(a) Phenology of major crops

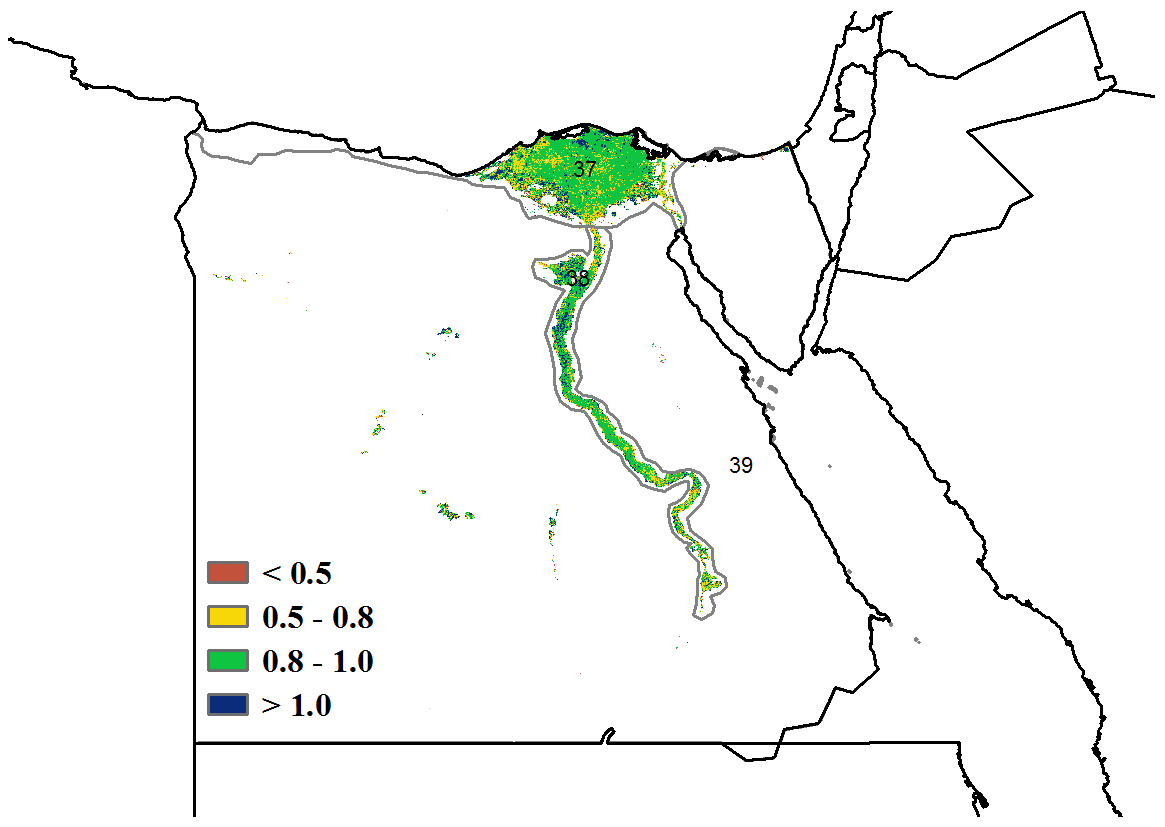
(b) Crop condition development graph based on NDVI (c) Maximum VCI
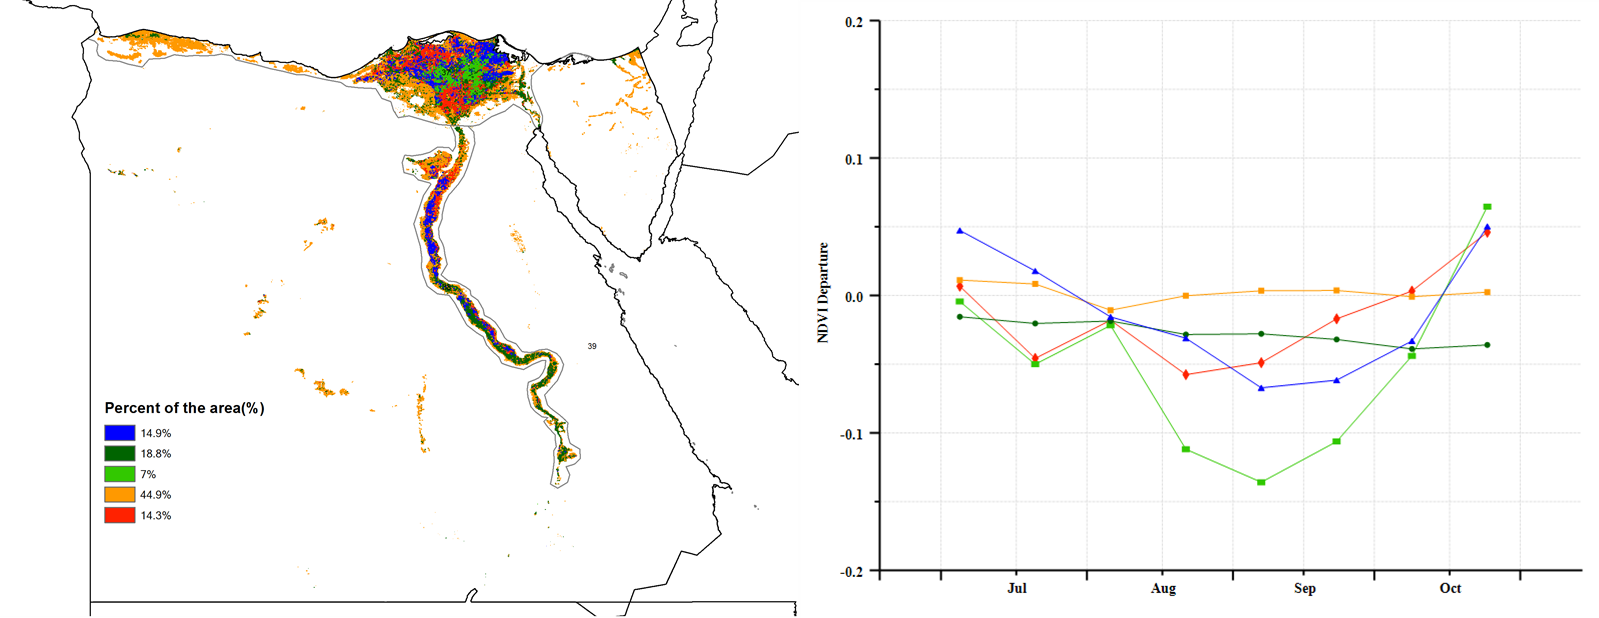
(d) Spatial NDVI patterns compared to 5YA (e) NDVI profiles
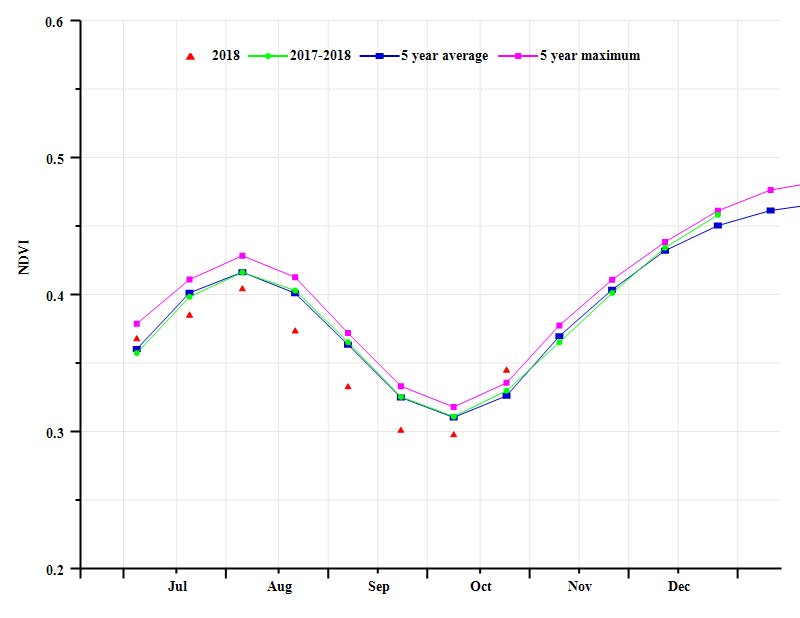

(f) Crop condition development graph based on NDVI (Nile Delta (left) and Nile Valley (right)).
Table 3.23. Egypt’s agroclimatic indicators by sub-national regions, current season's values and departure from 15YA, July-October 2018.
| RAIN | TEMP | RADPAR | ||||
| Region | Current(mm) | Departure from 15YA (%) | Current(°C) | Departure from15YA (°C) | Current (MJ/m2) | Departure from 15YA (%) |
| Nile Delta and Mediterranean coastal strip | 2 | -46 | 26.7 | 0.1 | 1384 | 0 |
| Nile Valley | 5 | 11 | 28.1 | -0.2 | 1434 | -1 |
Table 3.24. Egypt’s agronomic indicators by sub-national regions, current season's values and departure from 5YA, July-October 2018.
| BIOMSS | CALF | Maximum VCI | |||
| Region | Current (gDM/m2) | Departure from 5YA (%) | Current (%) | Departure from 5YA (%) | Current |
| Nile Delta and Mediterranean coastal strip | 31 | 23 | 0.6 | 1 | 0.7 |
| Nile Valley | 59 | 93 | 0.7 | 1 | 0.8 |
Table 3.25. CropWatch-estimated maize, rice, and wheat production for Egypt in 2018 (thousand tons).
| Production 2017 | Yield variation | Area variation | Production 2018 | Production variation | |
| Maize | 5918 | -6.9% | 0.0% | 5513 | -6.8% |
| Rice | 6545 | -6.5% | -0.5% | 6091 | -6.9% |
| Wheat | 10963 | -6.6% | 5.4% | 10790 | -1.6% |