
 English
 中文
中文
Bulletin
CropWatch bulletinMenu
- Overview
- Country analysis
- Argentina
- Australia
- Bangladesh
- Brazil
- Canada
- Germany
- Egypt
- Ethiopia
- France
- United Kingdom
- Indonesia
- India
- Iran
- Kazakhstan
- Cambodia
- Mexico
- Myanmar
- Nigeria
- Pakistan
- Philippines
- Poland
- Romania
- Russia
- Thailand
- Turkey
- Ukraine
- United States
- Uzbekistan
- Vietnam
- South Africa
- Afghanistan
- Belarus
- Mongolia
- Sri Lanka
- Zambia
- Mozambique
- Kenya
- Angola
- Hungary
- Italy
- Morocco
Authors: 超级管理员 | Edit: Miao
The monitoring period covers the final stages of the Maize and spring wheat cultivation and harvesting, as well as planting of winter wheat.
Compared to average, CropWatch agroclimatic indicators show that the conditions were abnormal at the national level. This includes a 18% drop in RAIN, slightly above average temperature, and a very significant increase in sunshine (RADPAR +10%). The resulting BIOMSS indicator is down 13%, the main crop production estimates at put at 4.5% below 2017 for wheat and 1.5% down for Maize.
The NDVI development graph for the entire country indicates crop condition below the average of the past five years and 2017. The spatial NDVI patterns compared to the five-year average indicate that NDVI is above average in 19.8% of arable land just in August and with below average values in the other regions.
This spatial pattern is reflected by the maximum VCI (VCIx) in the different areas, with a VCIx of 0.95 and low CALF(0.73) for France overall.
Regional analysis
Considering cropping systems, climatic zones, and topographic conditions, additional sub-national detail is provided for eight agro-ecological zones. They are identified in the maps by the following numbers: (54) Northern barley region; (58) Mixed maize/barley and rapeseed zone from the Center to the Atlantic Ocean; (55)Maize_barley and livestock zone along the English Channel, (56) Rapeseed zone of eastern France;(51) Dry Massif Central zone; (57) Southwestern maize zone; (52) Eastern Alpes region and (53), the Mediterranean zone.
In the Northern barley region both TEMP and RADPAR were above average (0.5°C and 16%, respectively), while RAIN was 32% below. Low VCIx values (0.66) reflect overall unsatisfactory crop condition.
The Mixed maize/barley and rapeseed zone from the Center to the Atlantic Ocean experienced average temperature, RAIN was 32% below average, while RADPAR was 13% above. According to the NDVI profile and VCIx map, crop condition was not good in the region.
The Maize/barley and livestock zone along the English Channel recorded 144 mm of rainfall over four months(RAIN -35%). Temperature was average (TEMP 0.2°C), but RADPAR was 11% above. The drop in BIOMSS was 12% compared to the five-year average. The NDVI profile confirms the conditions of crop was not good but close average.
Mostly unfavorable climatic conditions dominated the Rapeseed zone of eastern France over the reporting period. Rainfall was 41% below average (181 mm over four months).Temperature was normal, but radiation was 15% above average. The dry conditions have hampered crop growth, indicated also by a BIOMSS indicator 27% below average for the period.
The Dry Massif Central zone recorded a 32% rainfall deficit, with above average values for both RADPAR (13%) and TEMP(1.1°C). BIOMSS for the region is 20% below the five-year average, and a low VCIx value reflects the generally unsatisfactory crop and especially pasture condition, as confirmed by the NDVI development graph.
The Southwestern maize zone is one of the major irrigated maize regions in France. But rainfall only dropped 5% below average, temperature was average, but radiation was above expectations (RADPAR+7%). Crop condition was below average according to the NDVI development graph, as confirmed by the decrease of BIOMSS by 3% compared to the 5YA. The VCIx map, however, shows that the crop condition was unsatisfactory.
Generally, environmental conditions for the Eastern Alpes region were close to average with the following values: RAIN +11%, TEMP +0.9°C, and RADPAR +6%. Almost all arable land in this region was cropped during the monitoring period, and the average VCIx is 0.78.The NDVI profile confirms the crop condition.
Finally, the most favourable weather conditions were observed in the Mediterranean zone (RAIN +52%) even if other indicators remain close to average, except for TEMP (+1.4°C). According to the NDVI profiles, crop condition remained favorable since July. BIOMSS is 19% above its five-year average, and the VCIx value of 0.91 for the region is the highest in the country.
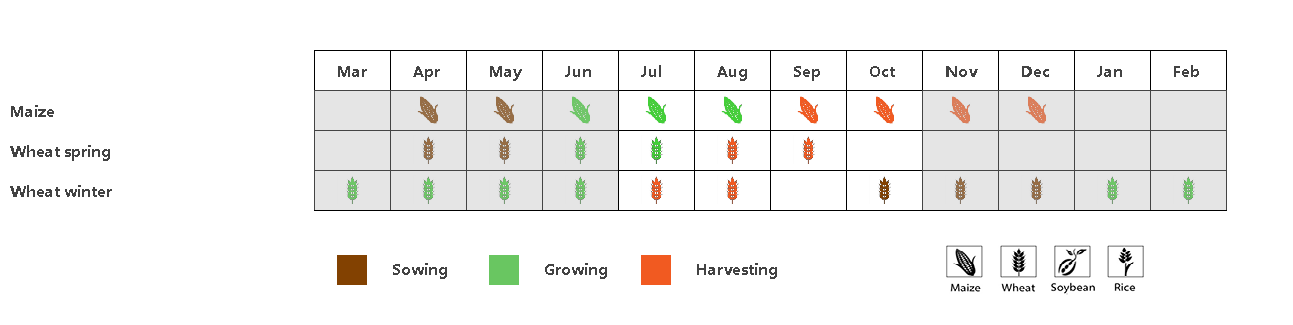 Figure 3.13 a. France phenology of major crops
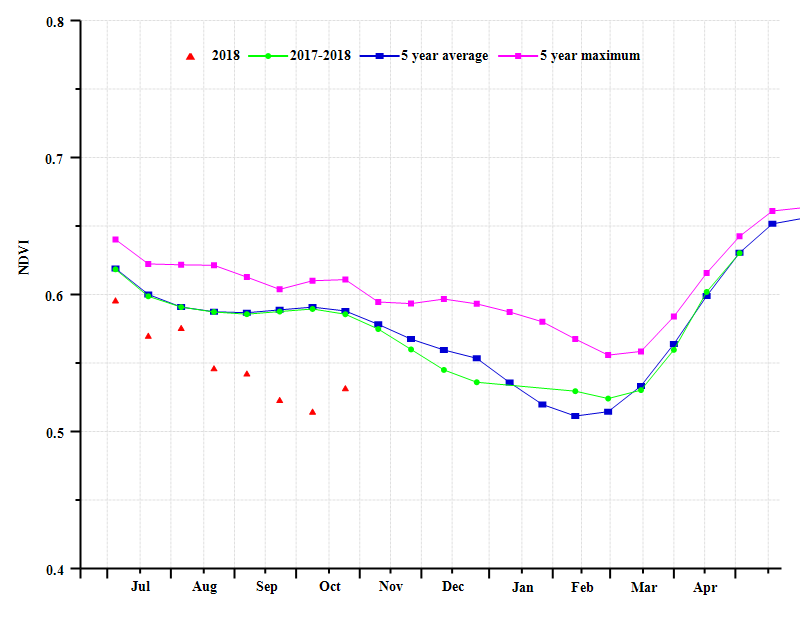
Figure 3.13 b. France national level crop condition development graph based on NDVI, comparing the July-October 2018 period to the previous season and the five-year average (5YA) and maximum
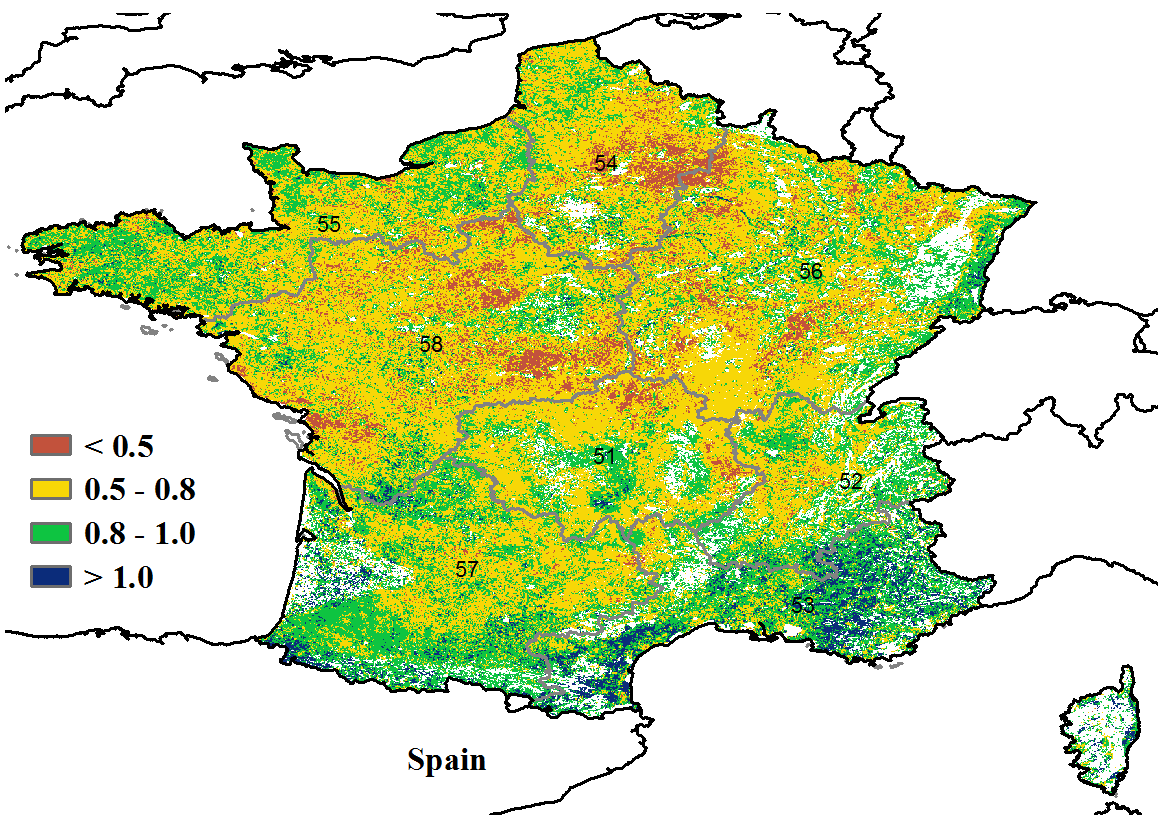
Figure 3.13 c. France maximum VCI for July-October 2018 by pixel

Figure 3.13 d. France spatial NDVI patterns up to October 2018 according to local cropping patterns and comparedto the 5YA (left) and (e) associated NDVI profiles(right).

Figure 3.13 f. Northern barley region (France) crop condition development graph based on NDVI.
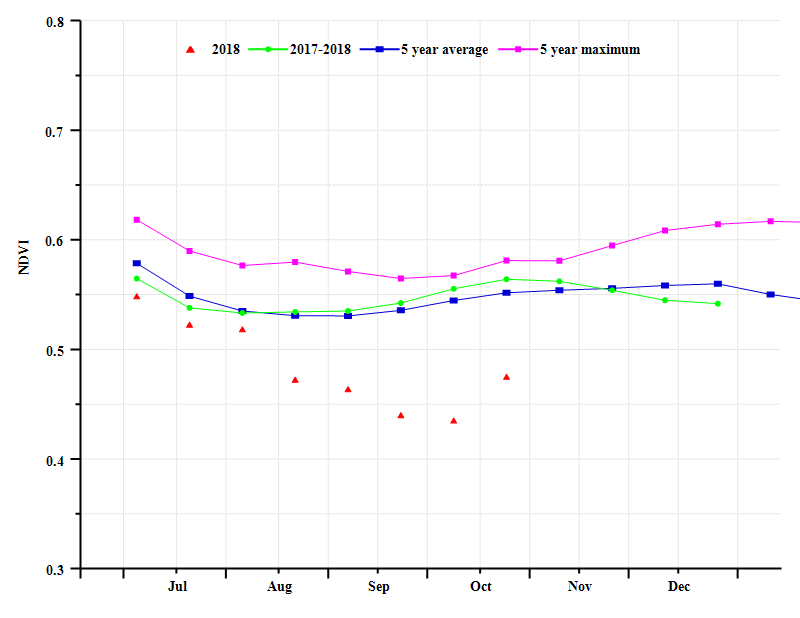
Figure 3.13 g. Mixed maize/barley and rapeseed zone from the Center to the Atlantic Ocean (France) crop condition development graph based on NDVI.
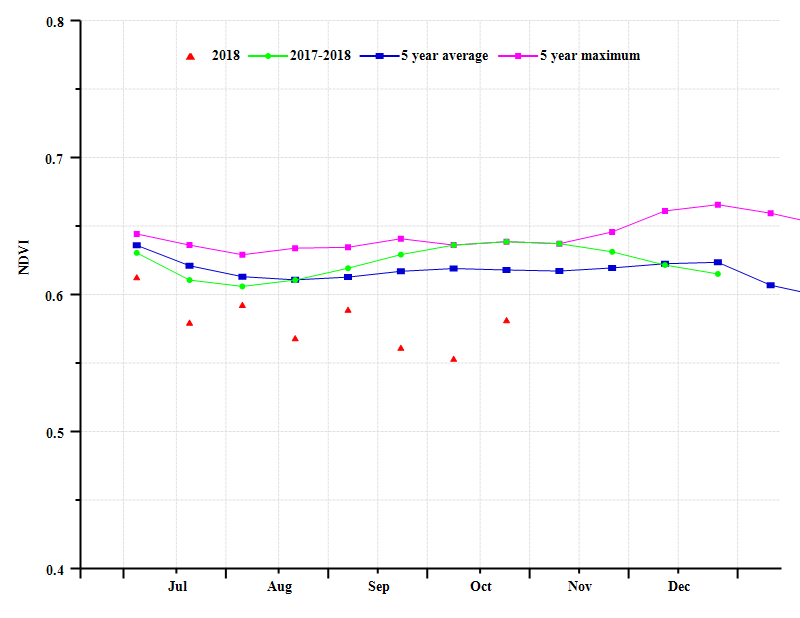
Figure 3.13 h. Maize barley and livestock zone along the English Channel crop condition development graph basedon NDVI.
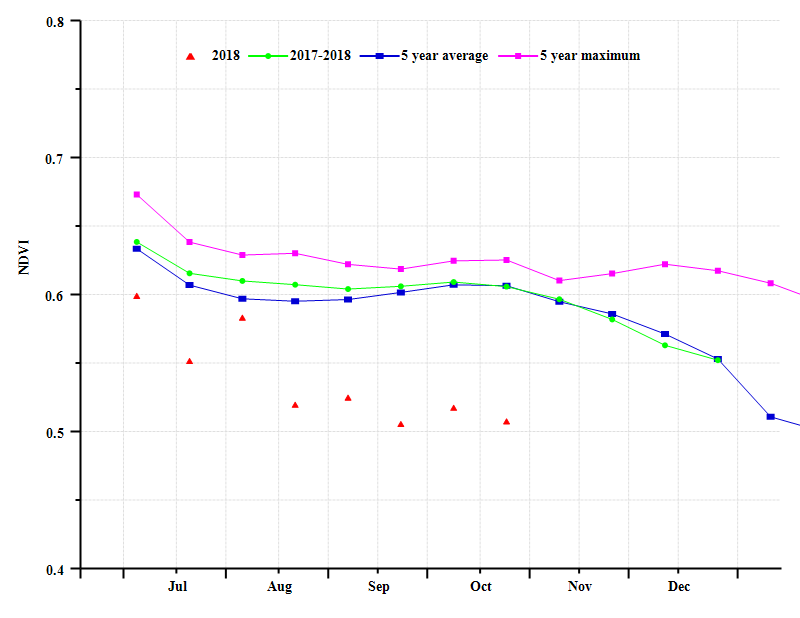
Figure 3.13 i. Rapeseed zone of eastern France crop condition development graph based on NDVI.
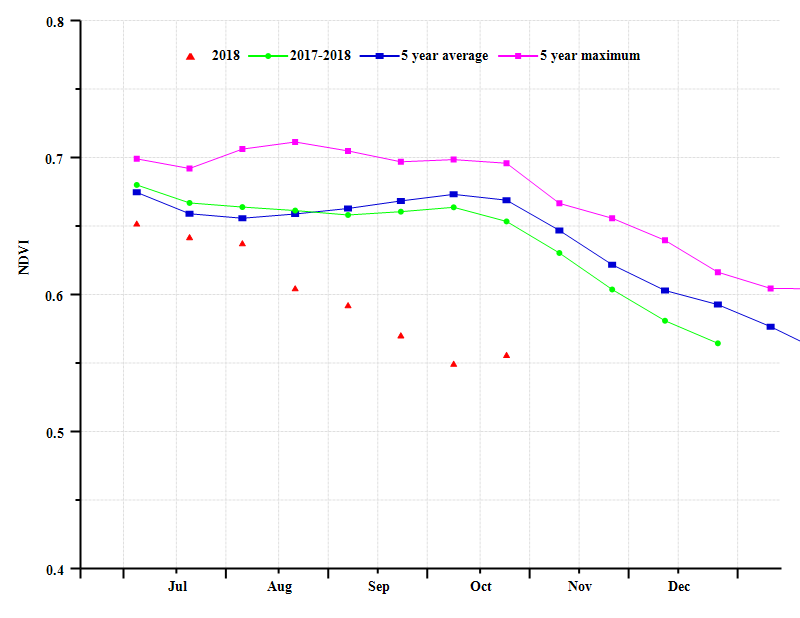
Figure 3.13 j.Dry Massif Central zone(France)crop condition development graph based on NDVI.
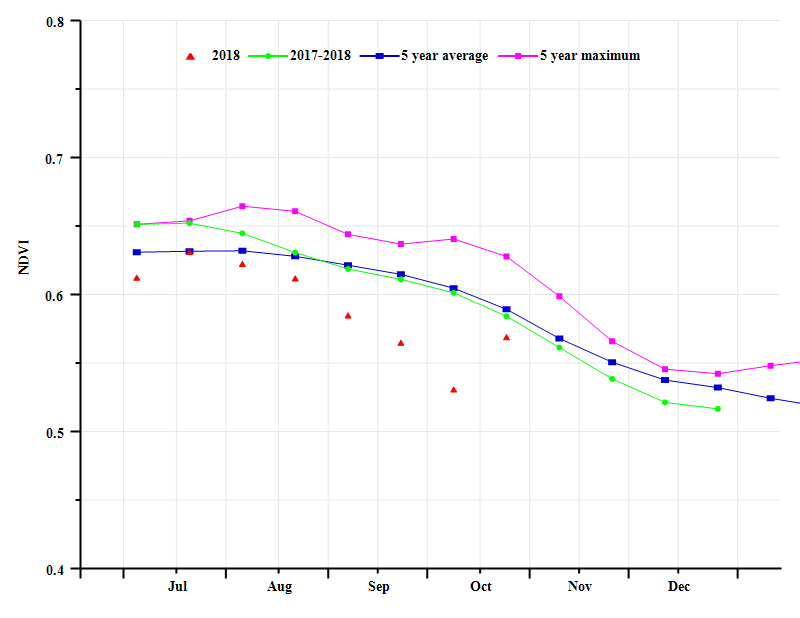
Figure 3.13 k. Southwestern maize zone(France) crop condition development graph based on NDVI.
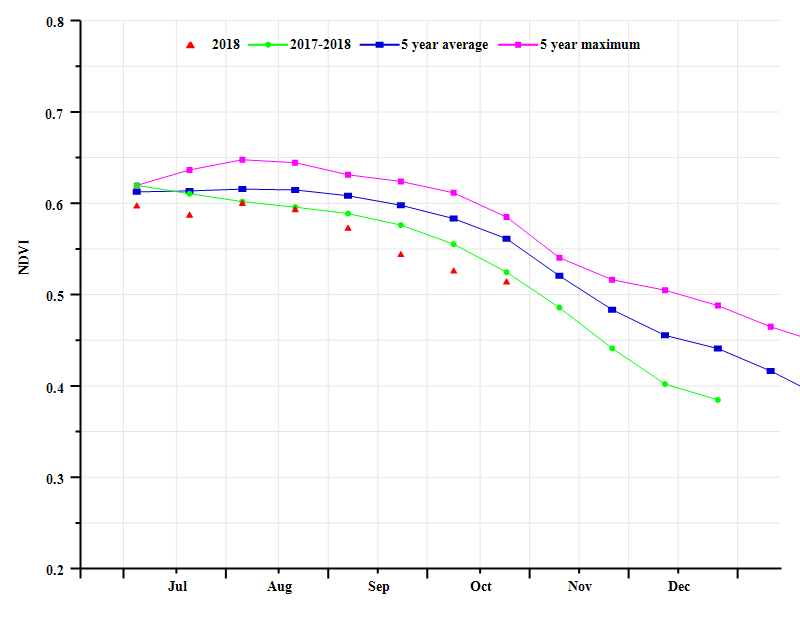
Figure 3.13 l. Eastern Alpes region(France) crop condition development graph based on NDVI.
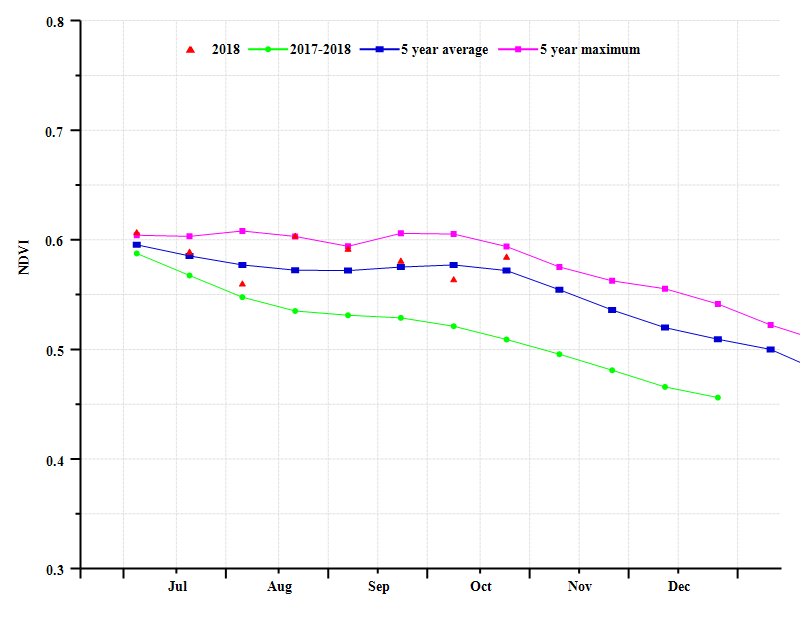
Figure 3.13 m. the Mediterranean zone(France) crop condition development graph based on NDVI.
Table 3.14. France agroclimatic indicators by sub-national regions, current season's values and departure from 15YA, July - October 2018
| Region | RAIN | TEMP | RADPAR | |||
| Current (mm) | Departure from 15YA (%) | Current (°C) | Departure from 15YA (°C) | Current (MJ/m2) | Departure from 15YA (%) | |
| Northern Barley zone | 160 | -32 | 17 | 0.5 | 974 | 16 |
| Mixed maize/barley and rapessed zone from the Centre to the Atlantic Ocean | 140 | -37 | 18 | 0.8 | 1065 | 13 |
| Maize barley and livestock zone along the English Channel | 144 | -35 | 16 | 0.2 | 940 | 11 |
| Rapeseed zone of eastern France | 181 | -41 | 17 | 0.5 | 1064 | 15 |
| Dry Massif Central zone | 213 | -32 | 17 | 1.1 | 1145 | 13 |
| Southwest maize zone | 235 | -5 | 19 | 0.5 | 1132 | 7 |
| Eastern Alpes region | 414 | 11 | 16 | 0.9 | 1150 | 6 |
| Mediterranean zone | 384 | 52 | 19 | 1.4 | 1170 | 0 |
Table 3.15. France agronomic indicatorsby sub-national regions, current season's value and departure from 5YA, July - October 2018
| Region | BIOMSS | Cropped arable land fraction | Maximum VCI | ||
| Current (gDM/m2) | Departure from 5YA (%) | Current (%) | Departure from 5YA (%) | Current | |
| Northern Barley zone | 937 | -11 | 100 | 0 | 0.66 |
| Mixed maize /barley and rapessed zone from the Centre to the Atlantic Ocean | 713 | -22 | 98 | -1 | 0.65 |
| Maize barley and livestock zone along the English Channel | 827 | -12 | 100 | 0 | 0.74 |
| Rapeseed zone of eastern France | 870 | -27 | 99 | -1 | 0.69 |
| Dry Massif Central zone | 939 | -20 | 100 | 0 | 0.70 |
| Southwest maize zone | 973 | -3 | 100 | 0 | 0.79 |
| Eastern Alpes region | 1171 | -5 | 97 | 0 | 0.78 |
| Mediterranean zone | 1058 | 19 | 96 | 4 | 0.91 |
Table 3.16 CropWatch-estimated maize and wheat production for France in 2018 (thousand tons)
| Crops | Production 2017 | Yield variation (%) | Area variation (%) | Production 2018 | Production variation (%) |
| Wheat | 38051 | -3.5 | -1.0 | 38333 | -4.5 |
| Maize | 14577 | -1.8 | 0.3 | 14364 | -1.5 |