
 English
 中文
中文
Bulletin
CropWatch bulletinMenu
- Overview
- Country analysis
- Argentina
- Australia
- Bangladesh
- Brazil
- Canada
- Germany
- Egypt
- Ethiopia
- France
- United Kingdom
- Indonesia
- India
- Iran
- Kazakhstan
- Cambodia
- Mexico
- Myanmar
- Nigeria
- Pakistan
- Philippines
- Poland
- Romania
- Russia
- Thailand
- Turkey
- Ukraine
- United States
- Uzbekistan
- Vietnam
- South Africa
- Afghanistan
- Belarus
- Mongolia
- Sri Lanka
- Zambia
- Mozambique
- Kenya
- Angola
- Hungary
- Italy
- Morocco
Authors: 超级管理员 | Edit: Miao
The current monitoring period covers the rainfed Kharif (summer) season crops: Maize, Wheat, Kharif Rice, and soybean were sowed and summer Rice and Soybean were harvested.
Crop condition was beneath average for the country. In general, rainfall was almost average (RAIN, +2%) but large differences between states were recorded: Uttar Pradesh (+40%), Rajasthan (+26%), Haryana (+34%), and Delhi (+63%). Below average values occurred in Sikkim (-45%), Gujarat (-23%), and Goa (-43%). Nationwide TEMP remained average, while photosynthetically active radiation (RADPAR) decreased by 5%. The RADPAR exceed the average in some states, e.g. Sikkim (+11%) and Meghalaya (+10%). The most significant sunshine deficits were in Madhya Pradesh (-13%), and Gujarat (-10%).
The crop condition development was below the previous five-year average. The least favorable conditions occurred in Chhattisgarh, Gujarat, Rajasthan, Madhya Pradesh, and Maharashtra. Andhra Pradesh, Gujarat, Rajasthan, and Karnataka all include areas with poor crop condition identified by VCIx below 0.5.
The biomass accumulation potential (BIOMSS) decreased significantly below average by 18%. Overall, as per Crop Watch indicators, crop condition was below average, and reduced output is expected, especially in Bihar, Chhattisgarh, Daman and Diu, Delhi, Gujarat, Jharkhand, Maharashtra, Manipur, Madhya Pradesh, Nagaland, and Uttar Pradesh. The most promising situation (BIOMSS up 17%) occurred in Puducherry.
Overall, the production of Rice, and Soybean was lower than the past year by 5%, and 6.5% respectively.
Regional analysis
India has been divided into seven agroecological zones: the Deccan plateau, the Eastern coastal region, the Gangetic plains, the Northeastern region, the Western coastal region, the Northwestern dry region and the Western Himalayan region.
The Deccan Plateau region recorded 1079 mm of RAIN (+8% relative to average), 27.2°C TEMP (-0.2°C) and 972 MJ/m² RADPAR (-9%). BIOMASS decreased 21% in the region which also recorded low NDVI. The CALF recorded 99% which is close to the 5YA, and VCIx was 0.9.
The Eastern coastal region recorded average RAIN and TEMP. The RADPAR of 1089 MJ/m² was 2 % lower than the average and BIOMASS was 13% below the 5YA. The region recorded 5% lower than average cropped area and a VCIx of 0.8 indicating moderate crop condition.
In the Gangetic region, precipitation amount was 1090 mm (14% higher than 15YA). TEMP was cooler with 0.5°C, and RADPAR was 5 % below average. The BIOMASS reached 1331 gDM/m2, which is 24 % below the 5YA. The CALF recorded 97% which is almost the 5YA, and VCIx was high at 0.9.
The Assam and Northeastern region recorded the highest precipitation in India (1535mm), but still below the average (-2%), with slightly below average TEMP at 26.4°C (-0.2°C) and average RADPAR of 955 MJ/m2. The BIOMASS was lower than the average (-12%), and CALF reached 96% which is nearly the 5YA. Crop condition was good with VCIx at 0.9; good production is expected.
The Western coastal region received 18% lower than average rainfall, average TEMP (-0.3℃ compared to 5YA) and RADPAR of 937 MJ/m² (-3%). This region had 20% lower than average BIOMASS. The CALF was 6% lower than 5YA, but crop condition was satisfactory at 0.8 VCIx.
The Northwestern region recorded the lowest rainfall value in India (652 mm, but higher than average by 3%) and near average TEMP and low RADPAR (-10%). The BIOMASS was lower than the average (-17%). CALF dropped 6% lower than 5YA and crop condition was average at 0.8 VCIx.
The Western Himalayan region received rainfall of 793 mm (13% above average) and just below average TEMP was recorded (-0.3℃). RADPAR reached 1155 MJ/m2 (-2 %). The BIOMASS was lower than 5YA by 10%. The CALF recorded 98% which is nearly the 5YA and VCIx at 0.9 indicate good production in general.
Figure 3…. India’s crop condition, July - October 2018

(a). Phenology of major crops
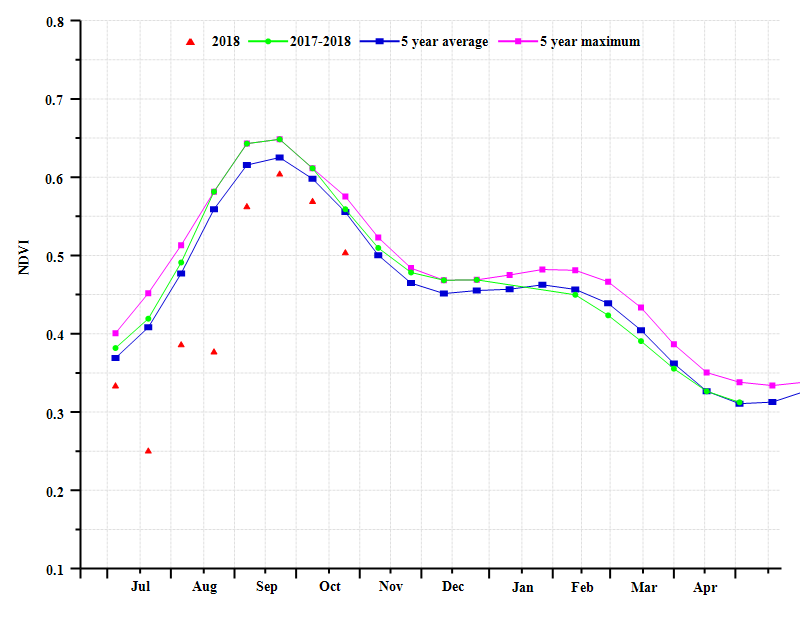

(b) Crop condition development graph based on NDVI (c) Maximum VCI

(d) Spatial NDVI patterns compared to 5YA (e) NDVI profiles
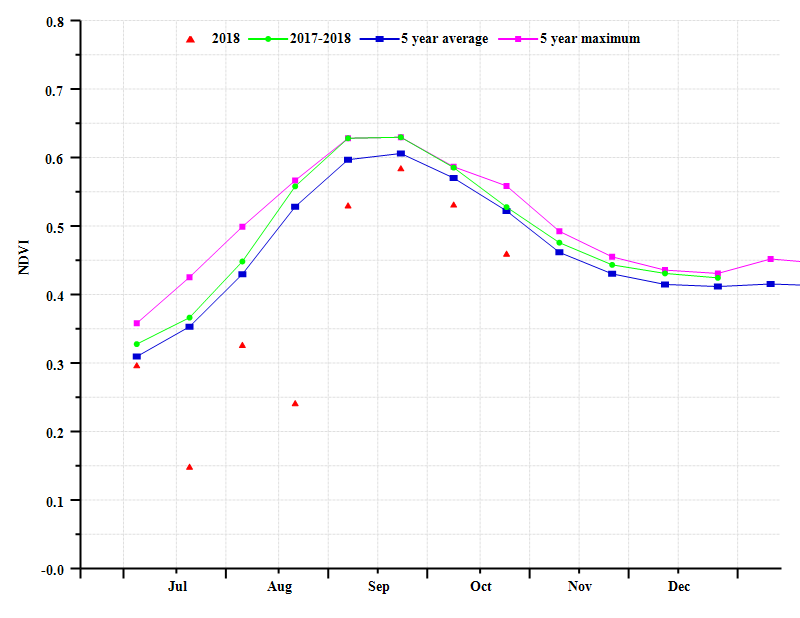
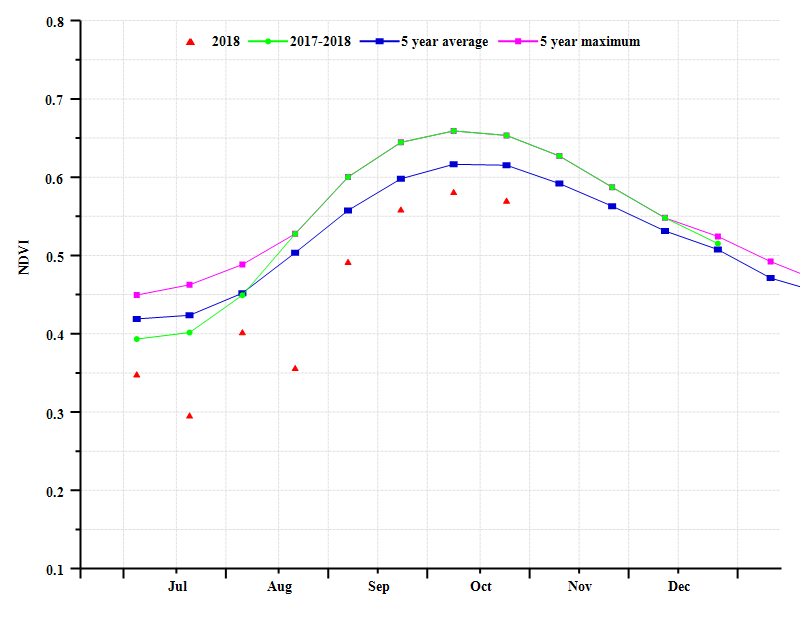
(f) Crop condition development graph based on NDVI (Deccan Plateau (left) and Eastern Coastal Region (right))
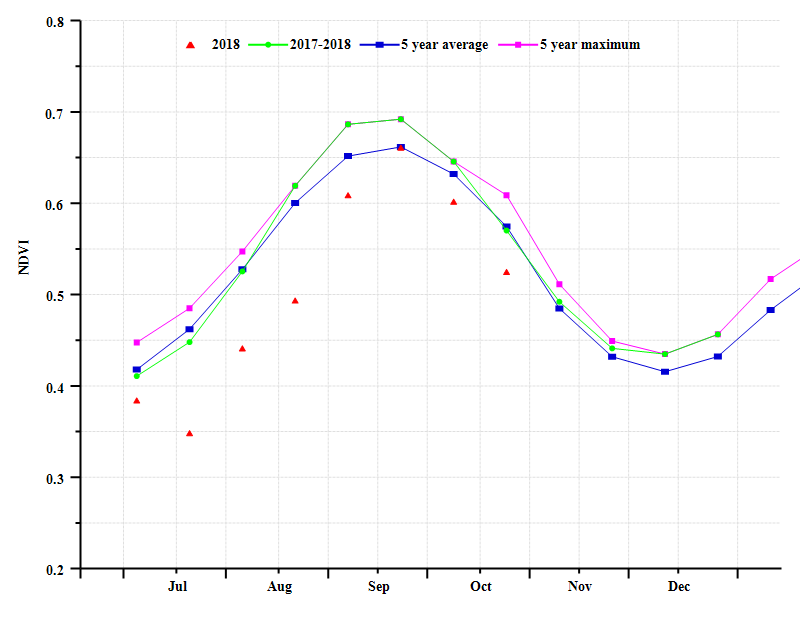
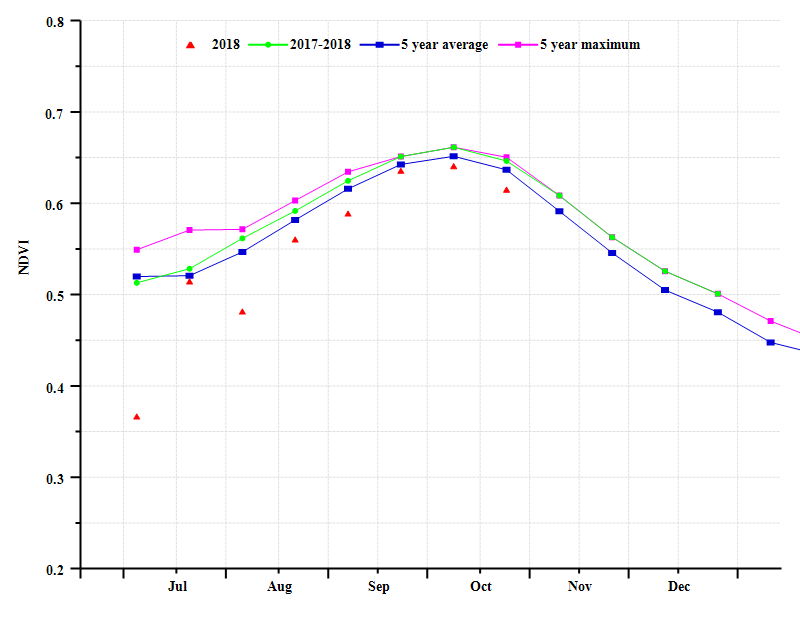
(g) Crop condition development graph based on NDVI (Gangatic Plains (left) and North Eastern Region (right))
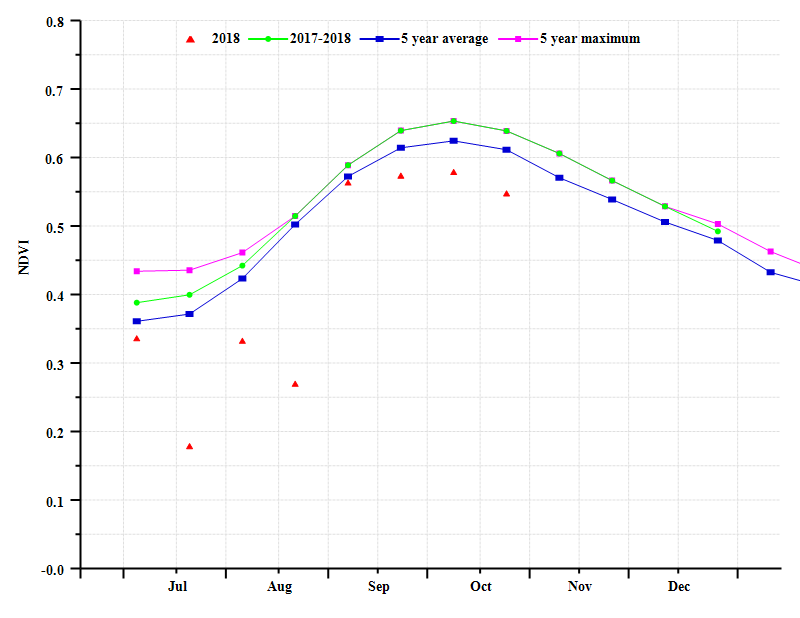
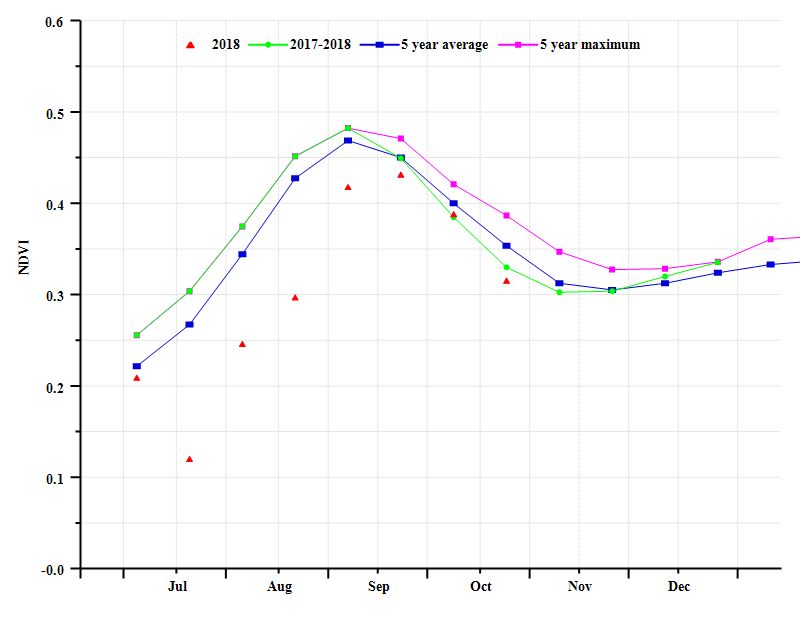
(h) Crop condition development graph based on NDVI (WesternCoastal Region (left) and Western Dry Region (right))

(i) Crop condition development graph based on NDVI (WesternHimalayan Region)
Table 3..... India’s agroclimatic indicators by sub-national regions, current season's values and departure from15YA, July - October 2018.
| Region | RAIN | TEMP | RADPAR | |||
| Current (mm) | Departure from 15YA (%) | Current (°C) | Departure from 15YA (°C) | Current (MJ/m2) | Departure from 15YA (%) | |
| Deccan Plateau (India) | 1079 | 8 | 27.2 | -0.2 | 972 | -9 |
| Eastern coastal region (India) | 872 | 1 | 28.1 | 0.2 | 1089 | -2 |
| Gangatic plain (India) | 1090 | 14 | 28.8 | -0.5 | 1077 | -5 |
| Assam and north-eastern regions (India) | 1536 | -2 | 26.4 | -0.2 | 955 | 0 |
| Western coastal region (India) | 843 | -18 | 25.1 | -0.3 | 937 | -3 |
| North-western dry region or Rajastan and Gujarat (India) | 652 | 3 | 28.9 | -0.4 | 1007 | -10 |
| Western Himalayan region (India) | 793 | 13 | 20.8 | -0.4 | 1176 | -2 |
Table 3….. India’s agronomicindicators by sub-national regions, current season's values and departure from5YA, July - October 2018.
| Region | BIOMSS | CALF | Maximum VCI | ||
| Current (gDM/m2) | Departure from 5YA (%) | Current (%) | Departure from 5YA (%) | Current | |
| Deccan Plateau (India) | 1363 | -21 | 99 | -0.3 | 0.9 |
| Eastern coastal region (India) | 1524 | -13 | 86 | -5 | 0.8 |
| Gangatic plain (India) | 1331 | -24 | 97 | -0.1 | 0.9 |
| Assam and north-eastern regions (India) | 2001 | -12 | 96 | 0.1 | 0.9 |
| Western coastal region (India) | 1338 | -20 | 88 | -6.2 | 0.8 |
| North-western dry region or Rajasthan and Gujarat (India) | 977 | -17 | 74 | -6.2 | 0.8 |
| Western Himalayan region (India) | 1155 | -10 | 98 | -0.1 | 0.9 |
Table 3..... CropWatch-estimated rice, Maize, Soybean and wheat production for India in 2018(thousand tons)
| Crops | Production 2017 | Yield variation (%) | Area variation (%) | Production 2018 | Production variation (%) |
| Maize | 19034 | -3.80% | -2.00% | 17936 | -5.80% |
| Rice | 163146 | -2.10% | -3.00% | 154920 | -5.00% |
| Wheat | 93496 | -1.70% | -0.60% | 91374 | -2.30% |
| Soybean | 12159 | -5.80% | -0.80% | 11368 | -6.50% |