
 English
 中文
中文
Bulletin
CropWatch bulletinMenu
- Overview
- Country analysis
- Argentina
- Australia
- Bangladesh
- Brazil
- Canada
- Germany
- Egypt
- Ethiopia
- France
- United Kingdom
- Indonesia
- India
- Iran
- Kazakhstan
- Cambodia
- Mexico
- Myanmar
- Nigeria
- Pakistan
- Philippines
- Poland
- Romania
- Russia
- Thailand
- Turkey
- Ukraine
- United States
- Uzbekistan
- Vietnam
- South Africa
- Afghanistan
- Belarus
- Mongolia
- Sri Lanka
- Zambia
- Mozambique
- Kenya
- Angola
- Hungary
- Italy
- Morocco
Authors: 超级管理员 | Edit: Miao
As the most important crop of Mexico, maize began to be sowed about September in the northwest. In other areas of the country the crop was at growing stage between July and September and reached harvest in October. Winter wheat sowing began in October. Both soybean and rice were at harvesting stage over the reporting period.
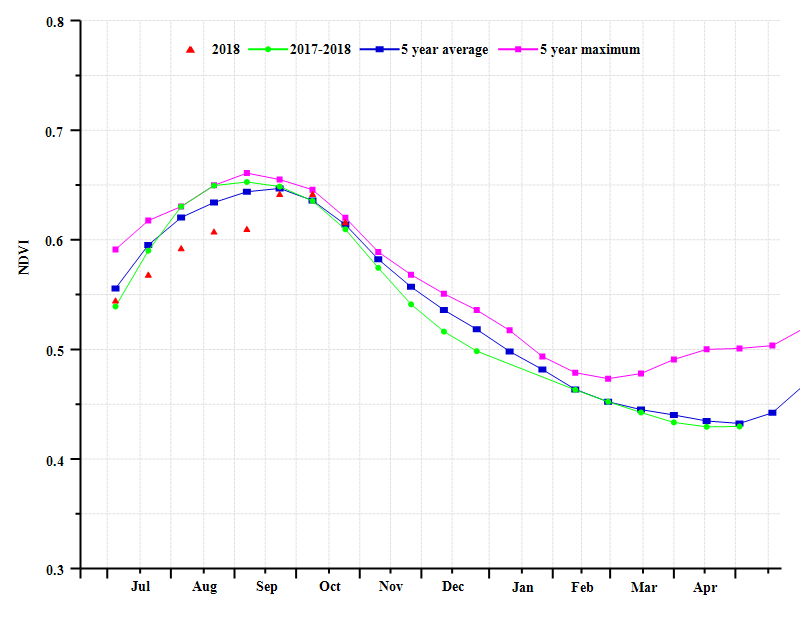
Crop condition was generally below average between July and September and reached the level of the previous 5-year average in early October, according to crop condition development graph based on NDVI. The CropWatch agroclimatic indicators showed that rainfall (-2%), temperature (-0.3°C) and radiation (+1%) were close to average, which was beneficial for crop growth, as indicated by a relatively high value of maximum VCI (0.91). CALF increased by 2%, compared with the previous 5-year average. As for individual crop types, the planted area for wheat significantly increased by 8.7% while that for maize was almost unchanged (+0.1%), compared with the last year’s level. Building on the above analyses, the production of wheat in Mexico during this season is estimated to be 3589 thousands tons, which is 9.3% above that in 2017; maize production will be 23643 thousands tons, which is 0.9% below the level of last year.
Crop condition displayed obvious differences in spatial distribution. According to the spatial pattern of maximum VCI, very high values (greater than 1.0) occurred mainly in northeastern Mexico (including Coahuila and northern Nuevo León) whereas extremely low values (less than 0.5) occurred in the northwestern and western parts of the country (Baja California, Baja California Sur, Sonora and Chihuahua). The maximum VCI in other regions of Mexico was moderate, with the values between 0.5 and 1.0. The map for the spatial pattern of NDVI departures from the previous 5-year average and the according NDVI departure profiles showed that 11.4% of planted areas located in Coahuila and northern Nuevo Leóon experienced about average crop condition during early July through early September and significantly above-average condition after late September. On the contrary, 18.6% of planted areas displayed continuously below-average crop condition, mainly in Sonora, Chihuahua, Tamaulipas and Veracruz. Crop situation in most of the other parts of Mexico was generally close to average over the reporting period. Therefore, the spatial patterns of NDVI departures from average were generally consistent with those of maximum VCI.
Regional analysis
Based on cropping systems, climatic zones, and topographic conditions, Mexico is divided into four agro-ecological regions. These regions including Arid and semi-arid regions(82), Humid tropics with summer rainfall(83), Sub-humid temperate region with summer rains(84) and Sub-humid hot tropics with summer rains(85). Regional analyses of crop situation can provide more detail for the production situation in Mexico.
The Arid and semi-arid regions located in northern and central Mexico, account for about half of planted areas in the country. According to the NDVI development graph, crop condition in these regions was generally below average during early July through early September. Luckily, these regions displayed above-average crop condition since late September, with the condition even surpassing the level of the previous 5-year maximum in October. Agroclimatic condition were moderate over the reporting period. Compared to average, rainfall increased by 8% while temperature declined by 0.6°C. Radiation was average. The maximum VCI was relatively high, with a value of 0.9. Moreover, CALF increased by 5%, compared with average. The situation of crop production in these regions is promising.
Sub-humid temperate region with summer rains situated in central Mexico. Crop condition in these regions were below average from July to early September but were close to average since late September. The agroclimatic condition was unfavorable: rainfall, temperature and radiation decreased by 15%, 0.2°C and 3% compared to average, which resulted in below-average BIOMSS (-8%).
Sub-humid hot tropics with summer rains and Humid tropics with summer rainfall are located respectively in southern and southeastern Mexico. During the monitoring period, crop condition was continuously below average in these regions, as shown by the NDVI time profiles. Agroclimatic conditions were moderate, with the departures from average for rainfall, temperature and radiation ranging between -3% and +5%, and -0.2 °C and -0.3°C. BIOMSS dropped below average by 7% and 6%, respectively, which further confirms unfavorable crop condition in these regions.
Figure 3.30. Mexico’s crop condition, July-October 2018
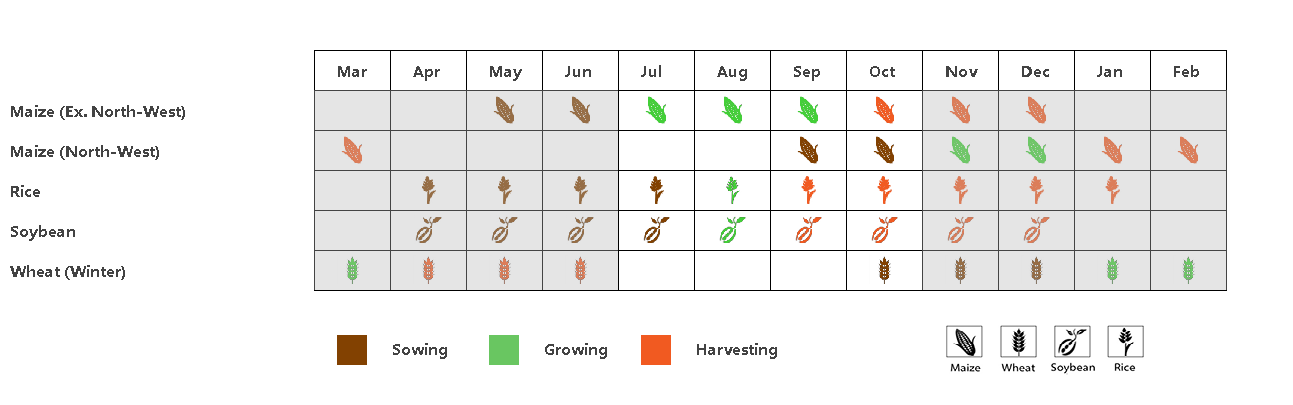
(a). Phenology of major crops

(b) Crop condition development graph based on NDVI (c) Maximum VCI

(d) Spatial NDVI patterns compared to 5YA (e) NDVI profiles


(f) Crop condition development graph based on NDVI (Arid and semi-arid regions (left) and Humid tropics with summer rainfall (right))

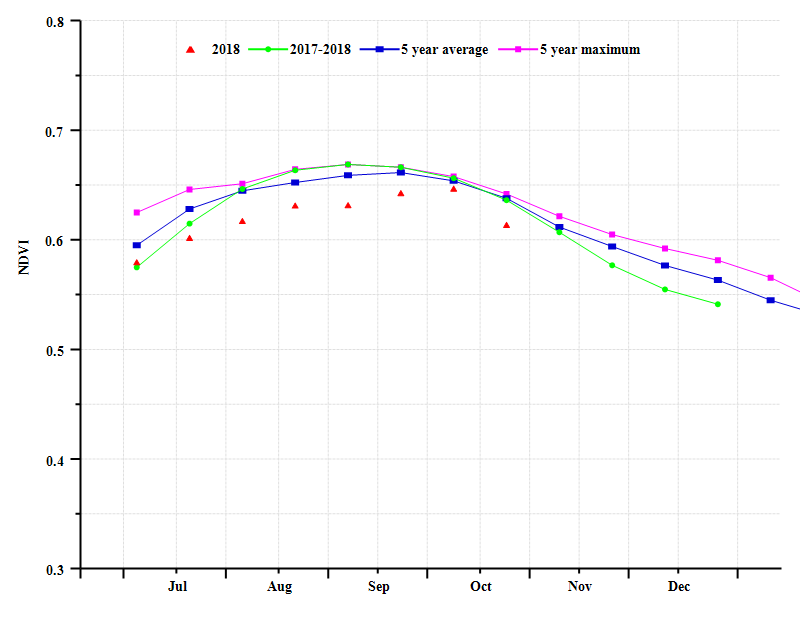
(g) Crop condition development graph based on NDVI (Sub-humid temperate region with summer rains (left) and Sub-humid hot tropics with summer rains (right))
Table 3.55. Mexico’s agroclimatic indicators by sub-national regions, current season's values and departure from 15YA, July-October 2018
| Region | RAIN | TEMP | RADPAR | |||
| Current | Departure | Current | Departure from | Current | Departure | |
| Arid and semi-arid regions | 443 | 8 | 23.4 | -0.6 | 1280 | 0 |
| Humid tropics with summer | 989 | -3 | 27.0 | -0.3 | 1323 | 5 |
| Sub-humid temperate region | 527 | -15 | 20.3 | -0.2 | 1176 | -3 |
| Sub-humid hot tropics with | 886 | -3 | 24.0 | -0.2 | 1238 | 1 |
Table 3.56. Mexico’s agronomic indicators by sub-national regions, current season's values and departure from 5YA, July-October 2018
| Region | BIOMSS | Cropped arable land | Maximum | ||
| Current | Departure from | Current | Departure from | Current | |
| Arid and semi-arid regions | 1073 | -2 | 86 | 5 | 0.90 |
| Humid tropics with summer | 1863 | -6 | 100 | 0 | 0.91 |
| Sub-humid temperate region | 1474 | -8 | 98 | 0 | 0.90 |
| Sub-humid hot tropics with | 1681 | -7 | 96 | 1 | 0.91 |
Table 3.57. CropWatch-estimated maize and wheat production for Mexico in 2018 (thousands tons)
| Crops | Production 2017 | Yield variation ) | Area variation | Production 2018 | Production variation |
| Maize | 23858 | -1.0% | 0.1% | 23643 | -0.9% |
| Wheat | 3283 | 0.6% | 8.7% | 3589 | 9.3% |