
 English
 中文
中文
Bulletin
CropWatch bulletinMenu
- Overview
- Country analysis
- Argentina
- Australia
- Bangladesh
- Brazil
- Canada
- Germany
- Egypt
- Ethiopia
- France
- United Kingdom
- Indonesia
- India
- Iran
- Kazakhstan
- Cambodia
- Mexico
- Myanmar
- Nigeria
- Pakistan
- Philippines
- Poland
- Romania
- Russia
- Thailand
- Turkey
- Ukraine
- United States
- Uzbekistan
- Vietnam
- South Africa
- Afghanistan
- Belarus
- Mongolia
- Sri Lanka
- Zambia
- Mozambique
- Kenya
- Angola
- Hungary
- Italy
- Morocco
Authors: 超级管理员 | Edit: Miao
During the current monitoring period, maize was still growing during July and August and harvest began in September, after winter wheat was sown in August. According to the crop condition development graphs based on NDVI at the national scale, crop condition was mostly average from July to October. The CropWatch agroclimatic indicators show that weather conditions were moderate when compared with average: rainfall reduced by 7% whereas temperature and radiation were 0.9°C and 5% above average. The maximum VCI at the national scale was 0.83. However, the values of this indicator vary a lot spatially.High values (greater than 0.8) were mainly located in western and northern Ukraine (e.g Chemihiv, Kiev, Zhytomyr, Vinnytsia, Khmelnytskyi and Chemivtsi), whereas low values (less than 0.5) occurred in the southeastern part of the country, e.g. Zaporizhia, Kherson and Mykolaiv. According to the graph of spatial pattern of NDVI departures compared to 5YA, 28.9% of planted areas located in western and northern Ukraine showed overall above average crop condition (i.e., Poltava, Chemihiv, Vinnytsia and Chemivtsi), whereas 15.8% of all crops displayed continuously below average condition, mainly located in the southeastern part, including Zaporizhia, Kherson, Crimea, Donetsk and Dnepropetrovsk. This pattern was generally consistent with that of maximum VCI.
Compared with the last 5 years’ average, CALF and cropping intensity declined 3% and 4%, respectively. In addition, the planted areas for maize and wheat during the season were respectively 7.9% and 3.0% lower than those in the same period of 2017. Building on the above analyses, the productions of maize and wheat are estimated to decrease 7.8% and 7.1% below the corresponding output of 2017.
Regional analysis
Based on cropping systems, climatic zones, and topographic conditions, four agro-ecological regions can be distinguished for Ukraine. They include Central wheat area, Northern wheat area, Eastern Carpathian hills and Southern wheat and maize area. The analyses for crop situation at subnational regional scale can provide more detail for the production situation in Ukraine.
In the Central wheat area overall crop condition was average between July and October 2018. Rainfall was 182 mm, which was 6% below average. Temperature and radiation increased by 0.8°C and 6%, respectively, compared with average. The agroclimatic condition resulted in 4% above average BIOMSS and a relatively high VCIx of 0.88, indicating favorable situation of wheat production.
The Northern wheat area showed average wheat condition during the monitoring period. Weather was favorable: rainfall was average and temperature and radiation increased respectively by 0.8°C and 6% compared to average. The maximum VCI in this region was very high, reaching a value of 0.94.
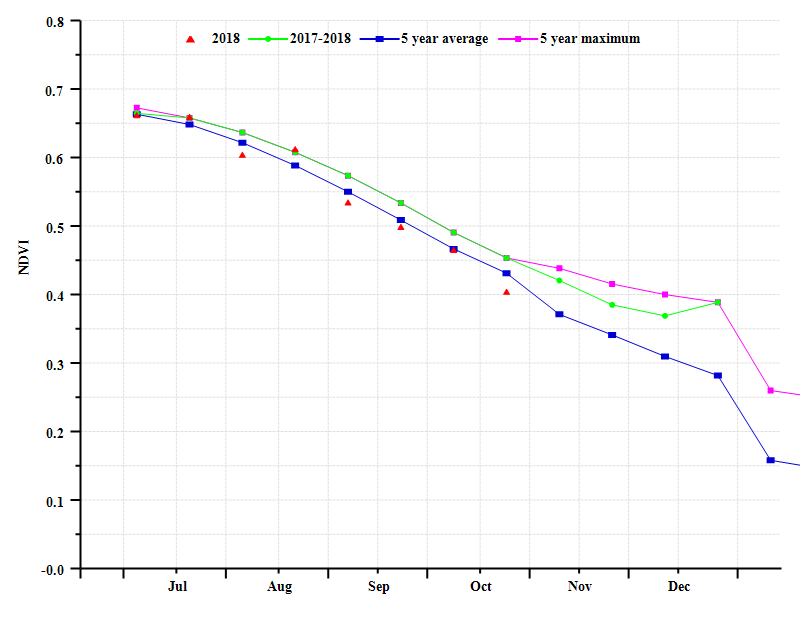
According to crop condition development graph based on NDVI, crop condition was generally favorable over the reporting period in the Eastern Carpathian hills. NDVI was above average from late August to late September. Rainfall was short by 21% compared with average, which lead to significantly below-average BIOMSS (-23%). In contrast, temperature and radiation were respectively 0.6°C and 5% above average. The maximum VCI was very high, with a value of 0.96, implying favorable crop condition in this region.
The Southern wheat and maize area had below average crop condition from early July to early September, but improved from late September. Agroclimatic conditions were unfavorable, with low rainfall compared to average (-10%). Consequently, the maximum VCI was rather low at 0.69. Moreover, CALF decreased by 10% compared with average. Therefore, the situation of wheat and maize production in this area is not promising.
Figure 3.30. Ukraine crop condition, July-October 2018

(a) Phenology of major crops

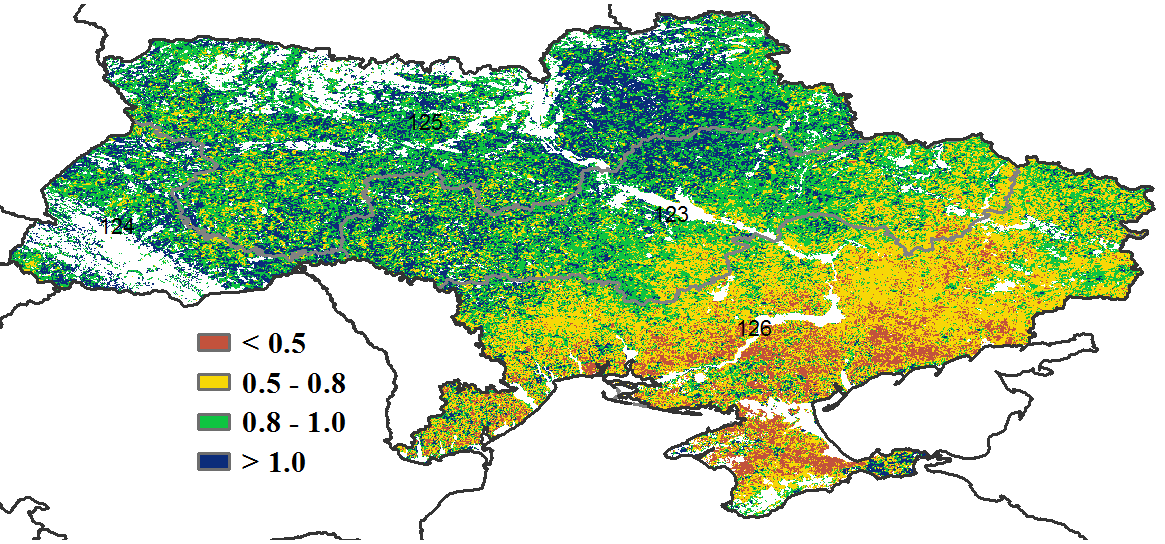
(b)Crop condition development graph based on NDVI (c) Maximum VCI
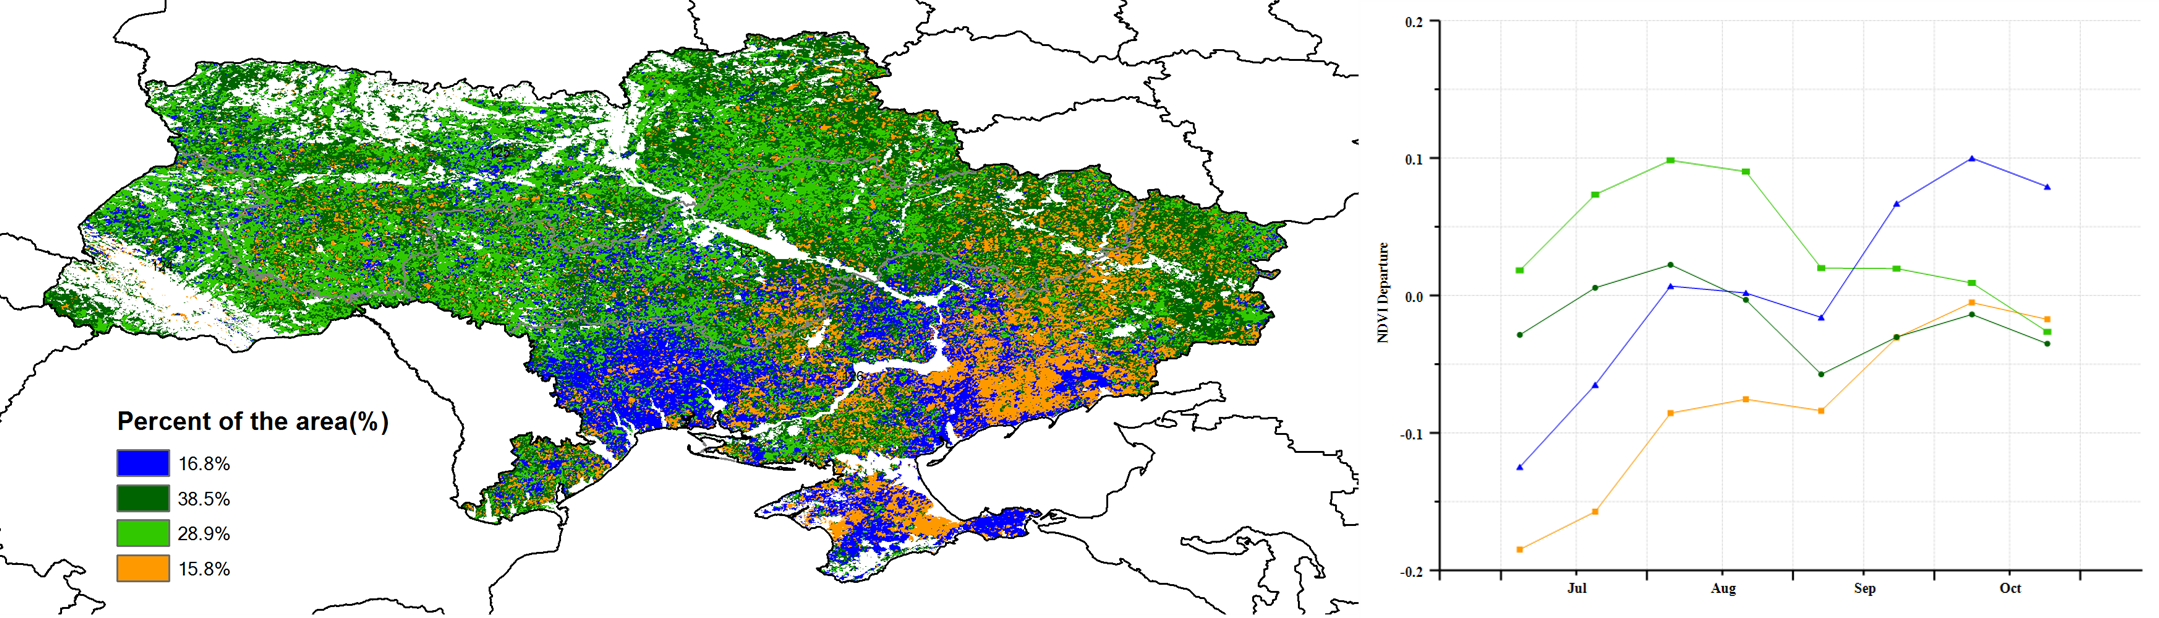
(d)Spatial NDVI patterns compared to 5YA (e)NDVI profiles
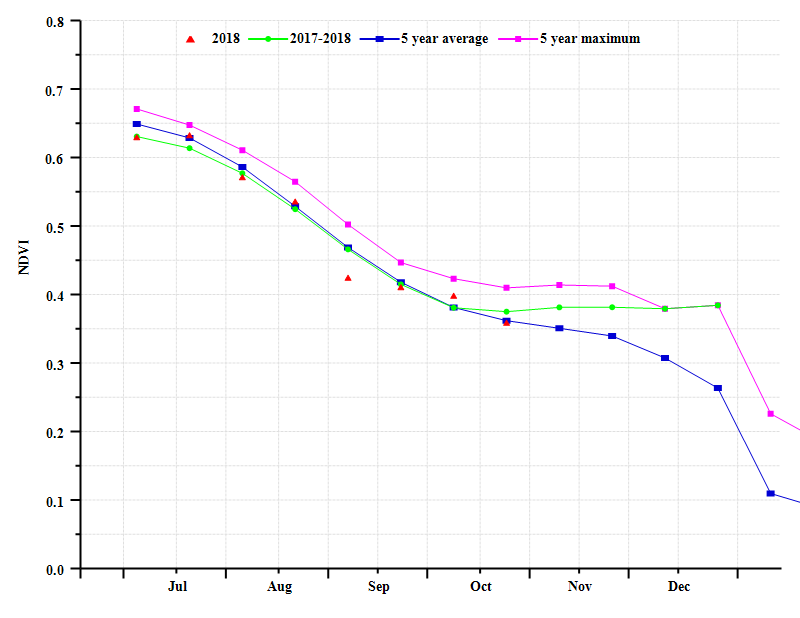
(f)Crop condition development graph based on NDVI (Central wheat area (left) and Northern wheat area (right))

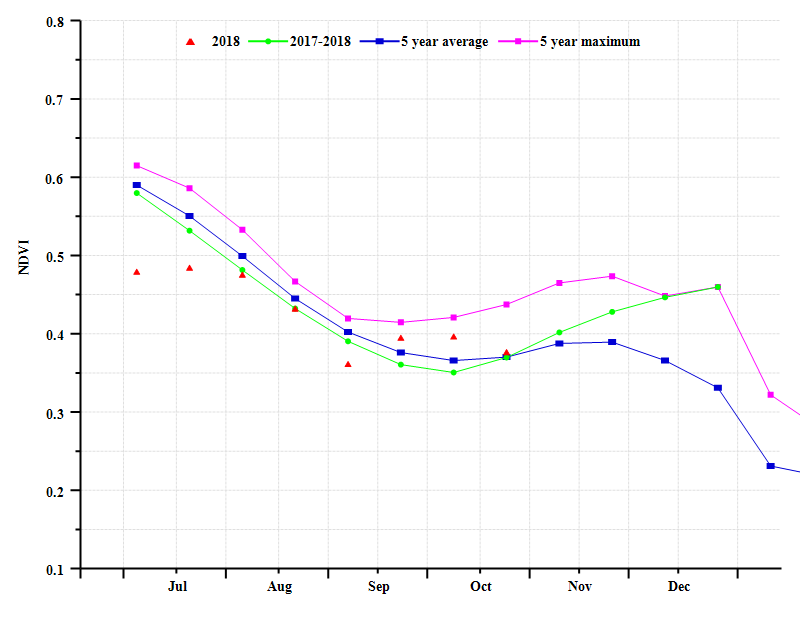
(g)Crop condition development graph based on NDVI (Eastern Carpathian hills (left)and Southern wheat and maize area (right))
Table 3.55. Ukraine agroclimatic indicators by agroecologicalzones, current season valuess and departure from 15YA, July-October 2018
| RAIN | TEMP | RADPAR | ||||
| Region | Current (mm) | Departure from 15YA (%) | Current (°C) | Departure from 15YA (°C) | Current (MJ/m2) | Departure from 15YA (%) |
| Cebntral wheat area (Ukraine) | 182 | -6 | 17.9 | 0.8 | 988 | 6 |
| Northern wheat area (Ukraine) | 229 | 0 | 16.8 | 0.8 | 929 | 6 |
| Eastern Carpathian hills (Ukraine) | 254 | -21 | 15.8 | 0.6 | 991 | 5 |
| Southern wheat and maize area (Ukraine) | 154 | -10 | 19.6 | 1.1 | 1036 | 3 |
Table 3.56. Ukraine agronomic indicators by agroecologicalzones, current season valuess and departure from 5YA, July-October 2018
| BIOMSS | CALF | Maximum VCI | |||
| Region | Current (gDM/m2) | Departure from 5YA (%) | Current (%) | Departure from 5YA (%) | Current |
| Cebntral wheat area (Ukraine) | 938 | 4 | 100 | 0 | 0.88 |
| Northern wheat area (Ukraine) | 796 | -19 | 100 | 0 | 0.94 |
| Eastern Carpathian hills (Ukraine) | 957 | -23 | 100 | 0 | 0.96 |
| Southern wheat and maize area (Ukraine) | 867 | 15 | 82 | -10 | 0.69 |
Table 3.57 Ukraine CropWatch-estimated maize and wheat production for 2018(thousand tons)
| Production 2017 | Yield variation | Area variation | Production 2018 | Production variation | |
| Maize | 31398 | 0.1% | -7.9% | 28943 | -7.8% |
| Wheat | 22662 | -4.2% | -3.0% | 21043 | -7.1% |