
 English
 中文
中文
Bulletin
CropWatch bulletinMenu
- Overview
- Country analysis
- Argentina
- Australia
- Bangladesh
- Brazil
- Canada
- Germany
- Egypt
- Ethiopia
- France
- United Kingdom
- Indonesia
- India
- Iran
- Kazakhstan
- Cambodia
- Mexico
- Myanmar
- Nigeria
- Pakistan
- Philippines
- Poland
- Romania
- Russia
- Thailand
- Turkey
- Ukraine
- United States
- Uzbekistan
- Vietnam
- South Africa
- Afghanistan
- Belarus
- Mongolia
- Sri Lanka
- Zambia
- Mozambique
- Kenya
- Angola
- Hungary
- Italy
- Morocco
Authors: 超级管理员 | Edit: Miao
The monitoring period covers the sowing stage of wheat in Uzbekistan from September to October and the growing and harvesting stage of maize. Crop condition was generally favorable. The national average VCIx was 0.75, and the cropped arable land fraction decreased by 4%. Among the CropWatch agroclimatic indicators, TEMP was slightly below average (-0.5°C), while RAIN and RADPAR were up by 93% and 1%, respectively. The combination of factors resulted in increased BIOMSS (107%) compared to the recent five-year average. The crop intensity increased 1% compared to the five-year average. As shown by the NDVI development graph, crop condition was below five year average during the reporting period. NDVI cluster graphs and profiles show that 13.8% of the agriculture areas had above average condition from July to October, mostly in Guliston and Jizzakh, and some small parts of Denan, Termez, Samarqand, Namangan, Kitab and Qunghirot provinces. Other regions were below average. Overall, CropWatch expects a decrease of 7.7% in wheat production compared with last year, even if the area of wheat cultivation by 0.9%.
Regional analysis
In the Aral Sea cotton zone, Crop condition was below five years average from July to October. Accumulated rainfall and radiation were above average (RAIN 172% and RADPAR 2%) and temperature was average (TEMP -0.2°C). The BIOMSS index increased by 125% compared to the five-year average. The maximum VCI index was 0.79, while the cropped arable land decreased by 6%. Overall crop prospects are average.
In the Eastern hilly cereals zone, NDVI was generally below the five-year average from July to October. The RAIN and RADPAR were above average (+81% and 1%) and TEMP was slightly below average (-0.5°C). The combination of the factors resulted in high BIOMSS (+102%) compared to the five-year average. The maximum VCI index was 0.74, while the cropped area decreased by 4% compared to the five-year average. Overall crop prospects are just normal or below.

(a). Phenology of major crops
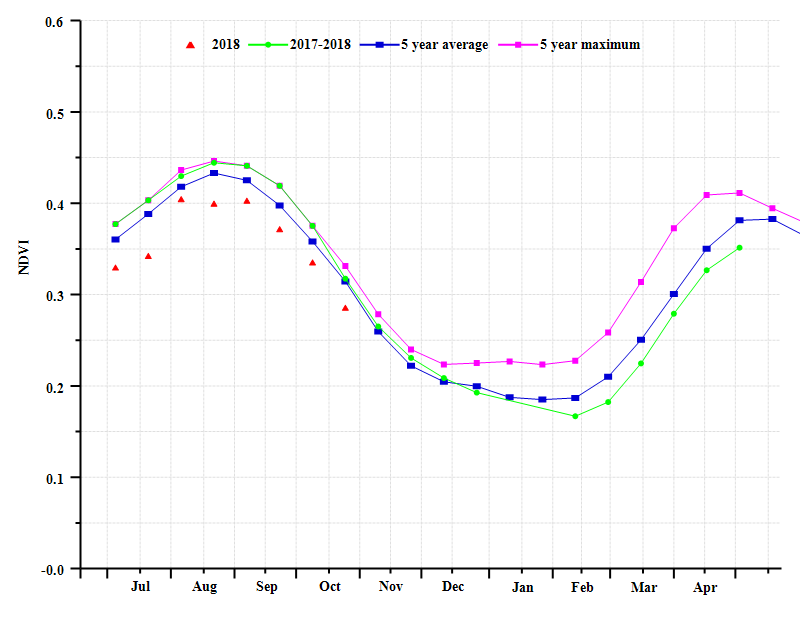

(b) Crop conditiondevelopment graph based on NDVI (c) Maximum VCI

(d) Spatial NDVIpatterns compared to 5YA (e) NDVI profiles


(f) Crop condition development graph based on NDVI Aral Sea Cotton region(left) Eastern hilly cereals region (right)
Table 3.112. Uzbekistan’s agroclimatic indicators by sub‐national regions, current season's values and departure from 15YA, July ‐October 2018
| Regions Name | RAIN | TEMP | RADPAR | |||
| Current (mm) | Departure from 15YA (%) | Current (°C) | Departure from 15YA (°C) | Current (MJ/m2) | Departure from 15YA (%) | |
| Aral Sea cotton zone | 146 | 172 | 22.1 | -0.2 | 1310 | 2 |
| Eastern hilly cereals zone | 72 | 81 | 20.9 | -0.5 | 1391 | 1 |
| Central region with sparse crops | 279 | 129 | 22.8 | -0.2 | 1312 | 1 |
Table 3.113. Uzbekistan’s agronomic indicators by sub‐national regions, current season's values and departure from 5YA, July ‐ October 2018
| Regions Name | BIOMSS | CALF | Maximum VCI | ||
| Current (gDM/m2) | Departure from 5YA (%) | Current | Departure from 5YA (%) | Current | |
| Aral Sea cotton zone | 514 | 125 | 62 | -6 | 0.79 |
| Eastern hilly cereals zone | 437 | 102 | 49 | -4 | 0.74 |
| Central region with sparse crops | 900 | 76 | 5 | -40 | 0.72 |
Table 3.114. CropWatch‐estimated Wheat production for Uzbekistan in 2018 (thousand tons)
| Crops | Production 2017 | Yield variation(%) | Area variation(%) | Production 2018 | Production variation |
| Wheat | 6442 | -8.5 | 0.9 | 5945 | -7.7 |