
 English
 中文
中文
Bulletin
CropWatch bulletinMenu
- Overview
- Country analysis
- Argentina
- Australia
- Bangladesh
- Brazil
- Canada
- Germany
- Egypt
- Ethiopia
- France
- United Kingdom
- Indonesia
- India
- Iran
- Kazakhstan
- Cambodia
- Mexico
- Myanmar
- Nigeria
- Pakistan
- Philippines
- Poland
- Romania
- Russia
- Thailand
- Turkey
- Ukraine
- United States
- Uzbekistan
- Vietnam
- South Africa
- Afghanistan
- Belarus
- Mongolia
- Sri Lanka
- Zambia
- Mozambique
- Kenya
- Angola
- Hungary
- Italy
- Morocco
Authors: 超级管理员 | Edit: Miao
Summer and autumn rice harvesting in Vietnam has been completed, while late rice is still in its growing season. Generally, compared with the average of the past five years and the average of the same period last year, the crop condition in Vietnam was significantly lower, except from July to September. The initial NDVI value was initially close to 2017 values but was affected by wide fluctuations until September. After September, the NDVI value recovered to the same level as in 2017. The peak of the growing season of late rice is close to the previous five years average. CropWatch agroclimatic indicators show generally average conditions with precipitation (-1%), TEMP (-0.2%), BIOMSS (-5%). RADPAR was also the same as average (1091MJ/m2). Average meteorological conditions resulted in a high VCIx of 0.93 at the national level. Overall crop condition in the country is close to or slightly below average.
Regional analysis
Based on cropping systems, climatic zones, and topographic conditions, three sub-national regions can be distinguished for Vietnam: Northern Vietnam, Central Vietnam and Southern Vietnam.
Northern Vietnam recorded abundant rainfall (RAIN +23%), below average RADPAR (-3%) and TEMP (-0.5°C). With the CALF and BIOMSS almost unchanged compared to the average (5YA), VCIx was high (0.95). The crop condition development graph of NDVI stayed below the 5 years average except in September. Based on agroclimatic indicators, below average output is likely.
In Central Vietnam, good rainfall was recorded (997mm), but nevertheless 21% below average); TEMP was average (+0.1°C departure) and RADPAR was above average (3%). BIOMSS is down -10% but CALF was fine (0.97) and so was VCIx (0.93). The graph of NDVI indicates that crop condition reached the 5YA in September and exceeded it after September. Below average output is expected.
In Southern Vietnam,with the exception of low RADPAR (-5%) and RAIN (-7%), normal TEMP (0%) overall condition of weather and crops was close to average (BIOMSS -5%). VCIx was high (0.9) with CALF up 0.5% over 2017. The NDVI development graph indicates mostly below average crop condition, especially before September with low NDVI values. CropWatch expects below average production.
Figure3.33. Vietnam crop condition, July-October 2018

Figure3.33a. Vietnam phenology of major crops

Figure3.33b. Vietnam national level crop condition development graph based on NDVI,comparing the July-October 2018 period to the previous season and the five-yearaverage (5YA) and maximum
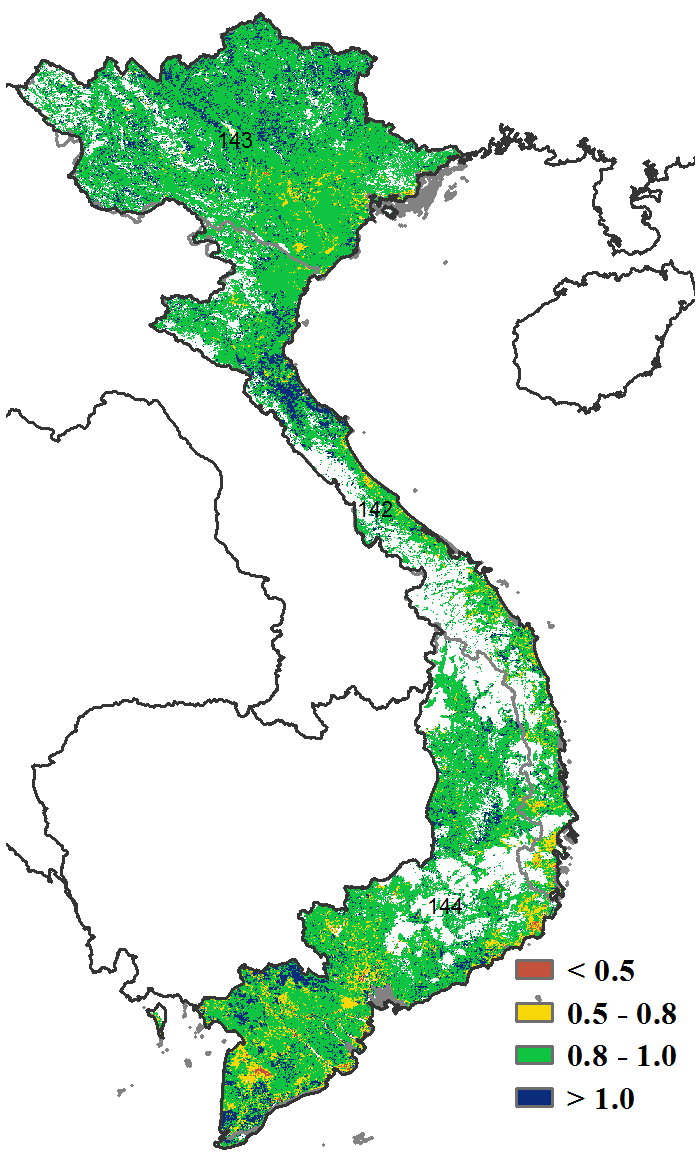
Figure3.33c. Vietnam maximum VCI for July-October 2018 by pixel

Figure3.33d. Vietnam spatial NDVI patterns up to October 2018 according to localcropping patterns and compared to 5YA (left) and (e) associated NDVI profiles(right)

Figure3.33f. Southern Vietnam (Vietnam) crop condition development graph based onNDVI

Figure3.33g. Northern Vietnam (Vietnam) crop condition development graph based onNDVI

Figure3.33h. Central Vietnam (Vietnam) crop condition development graph based on NDVI
Table3.87 Vietnam agroclimatic indicators by sub-national regions, currentseason values and departure from 15YA, July-October 2018
| RAIN | TEMP | RADPAR | ||||
| Current (mm) | Departure from 15YA (%) | Current (°C) | Departure from 15YA (°C) | Current (MJ/m2) | Departure from 15YA (%) | |
| North_Vietnam | 1244 | 23 | 25 | -0.5 | 1068 | -3 |
| Central_Vietnam | 997 | -21 | 27.7 | 0.1 | 1103 | 3 |
| South_Vietnam | 1111 | -7 | 26 | 0 | 1107 | 0 |
| Regions Name | BIOMSS | Cropped arable land fraction | Maximum VCI | ||
| Current (gDM/m2) | Departure from 5YA (%) | Current(%) | Departure from 5YA (%) | Current | |
| North_Vietnam | 1955 | -1 | 99 | -0.1 | 0.95 |
| Central_Vietnam | 1776 | -10 | 97 | -0.1 | 0.93 |
| South_Vietnam | 2099 | -5 | 93 | 0.5 | 0.90 |
Table 3.89 CropWatch-estimated rice production for Vietnam in 2018 (thousands tons)
| Crops | Production 2017 | Yield variation(%) | Area variation (%) | Production 2018 | Production variation(%) |
| Rice | 45422 | -1.0 | -0.3 | 44832 | -1.3 |