
 English
 中文
中文
Bulletin
CropWatch bulletinMenu
- Overview
- Country analysis
- Argentina
- Australia
- Bangladesh
- Brazil
- Canada
- Germany
- Egypt
- Ethiopia
- France
- United Kingdom
- Indonesia
- India
- Iran
- Kazakhstan
- Cambodia
- Mexico
- Myanmar
- Nigeria
- Pakistan
- Philippines
- Poland
- Romania
- Russia
- Thailand
- Turkey
- Ukraine
- United States
- Uzbekistan
- Vietnam
- South Africa
- Afghanistan
- Belarus
- Mongolia
- Sri Lanka
- Zambia
- Mozambique
- Kenya
- Angola
- Hungary
- Italy
- Morocco
Authors: 超级管理员 | Edit: Miao
Kenya
Due to its latitude near the Equator and the effects of elevation, Kenya experiences a large variety of rainfall and resulting cropping patterns. The country has up to two seasons. During the short rains (centered around Nov-Dec) farmers plant mostly maize while long rains (centered around April to June) are used for growing maize and wheat. The long rain maize and wheat were harvested in October. Sowing of short rain maize started in the reporting period. The current analysis covers mostly for long rain maize and wheat harvested from October and grown mostly in the south-western highlands.
At the national level, precipitation and temperature were below average (RAIN ‐31%; TEMP -0. 6°C), while the radiation was above average (RADAR,+4%). The Warm temperatures with a persistent rainfall deficit affected long rain wheat and maize crops at the flowering and grain filling time in large parts of the country, and the biomass accumulation potential BIOMASS was 31% below the recent five‐year average.The national NDVI profile graph was highly variable: below average from mid-July to mid-august, increasing up the end of August and below average from September to October. The NDVI profiles indicate above average NDVI values in 87.2% (33.9 + 53.3) of arable land (regions like Narok, Kajiado, Kisumu, Nakuru, and Embu). This spatial pattern is reflected by the VCI (VCIx) in the different areas: the central part to Embu and Nairobi region recorded favorably high VCIx, above 1. While the other region (like Kisumu, Nakuru) were between 0.8 and1.0. Generally, at national level the condition was favorable.The cropping intensity was slightly decreased by 0.4%. The production of maize it expected to increase by 16.1 % in 2018 production
Regional analysis
Based on the cropping systems, climatic zones and topographic conditions we divided this country into three Agroecological regions: The Eastern Coastal Area, the Northern region with sparse vegetation and Southwest Kenya.
The northern region with sparse vegetation is a mostly pastoral region. Compared to other regions, scarce amounts of rainfall were recorded (RAIN at 106 mm, 28% below average) from areas including (Turkana, Samburu, West Pokot, and Baringo). This significantly below average rainfall leads to a decrease in BIOMASS -33%. Temperature and sunshine were about average. The NDVI‐based Crop condition development shows values below the five years average; from August to mid of September the situation was above average and it dropped again below average in October. The maximum VCI was high at 0.92 and so was CALF (CAL, +30%) . Overall, rangeland production was average at best.
The Eastern Coastal Area include Mandera, Wajir, and Isiolo; they are secondary production areas compared to the southwest of Kenya. 136 mm rainfall was recorded (RAIN 25% above average) while TEMP was average (+0.2C) and RADPAR was above average by 6%. The biomass production potential was below the 5YA (BIOMASS,-2%). The NDVI profile underwent marked fluctuations. Throughout the reporting period maximum VCIx was 0.94 with CALF at 6 %, indicating very favorable crop production.
Southwest of Kenya includes Narok, Kajiado, Kisumu, Nakuru, and Embu, major producers of long rain wheat and maize. Compared to the above two regions this region received high rainfall (183 mm, but nevertheless 35% below average. With TEMP (‐0.7ºC departure), this resulted in BIOMSS at -32%. Both sunshine and CALF increased (RADPAR +4%, CALF + 27%). The average VCI for the Southwest of Kenya (1.10) results from values between 0.8 and 1 and above. In spite of NDVI fluctuations over time, the indicators show rather favorable crop condition in the southwest of Kenya.
Figure 3.26. Kenya's crop condition, July- october 2018.
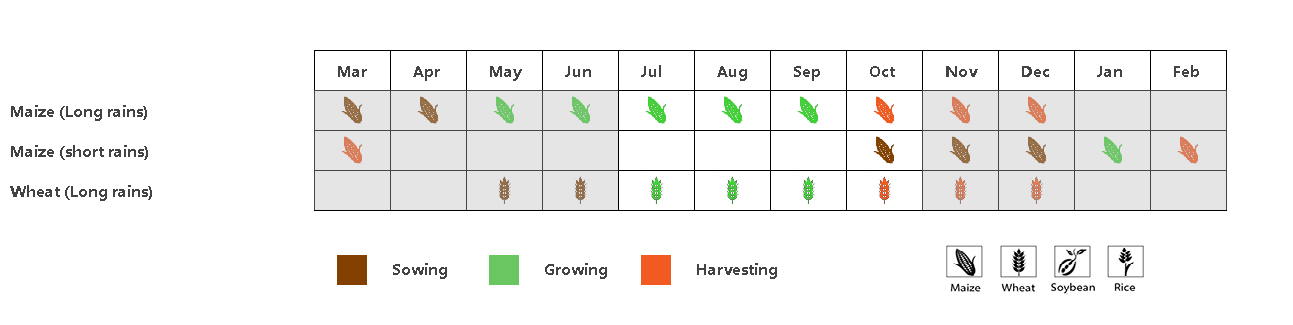
(a). Phenology of major crops


(b) Crop condition development graph based on NDVI (c) Maximum VCI

(d) Spatial NDVI patterns compared to 5YA (e) NDVI profiles


(f) Crop condition development graph based on NDVI ( Southwest of kenya, and (g) Northern region with sparse vegetation ))

(h) Crop condition development graph based on NDVI, Eastern Coastal area
Table 3.58. Kenya's agroclimatic indicators by sub‐nationalregions, current season's values, anddeparture
from 15YA, July- October 2018
Regions |
RAIN |
TEMP |
RADAR | |||
Current(mm) | Departure from 15YA(%) | Current (°C) | Departure from | Current MJ/m2 | Departure from 15YA | |
Eastern Coastal Area | 136 | 25 | 26.5 | 0.2 | 1246 | 6 |
Northern region with sparse vegetation | 106 | -28 | 25.8 | -0.1 | 1285 | 1 |
Southwest of Kenya | 183 | -35 | 19.8 | -0.7 | 1181 | 4 |
Table 3.59. Kenya's agronomic indicators by sub‐national regions,current season's values, and departure
from 5YA, July-October 2018
Regions |
BIOMASS |
Cropped arable land fraction | Maximum VCI | ||
Current | Departure from 5YA(%) | Current | Departure from | Current | |
Eastern Coastal Area | 417 | -2 | 95 | 6 | 0.94 |
Northern region with sparse vegetation | 343 | -33 | 60 | 30 | 0.92 |
Southwest of Kenya | 632 | -32 | 95 | 27 | 1.10 |
Crops | Production 2017 | Yield variation | Area variation | Production 2018 | Production variation |
Maize | 3000 | 11.4% | 4.2% | 3483 | 16.1% |