
 English
 中文
中文
Bulletin
CropWatch bulletinMenu
- Overview
- Country analysis
- Argentina
- Australia
- Bangladesh
- Brazil
- Canada
- Germany
- Egypt
- Ethiopia
- France
- United Kingdom
- Indonesia
- India
- Iran
- Kazakhstan
- Cambodia
- Mexico
- Myanmar
- Nigeria
- Pakistan
- Philippines
- Poland
- Romania
- Russia
- Thailand
- Turkey
- Ukraine
- United States
- Uzbekistan
- Vietnam
- South Africa
- Afghanistan
- Belarus
- Mongolia
- Sri Lanka
- Zambia
- Mozambique
- Kenya
- Angola
- Hungary
- Italy
- Morocco
Authors: 超级管理员 | Edit: Miao
In Morocco during the monitoring period (July-October), wheat, barley as well as maize were harvested. Winter wheat and barley were planted.
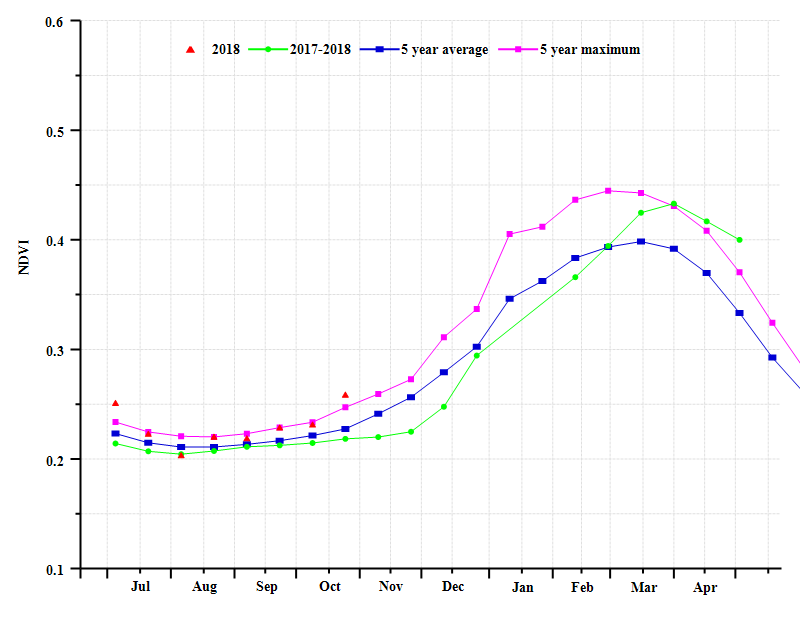
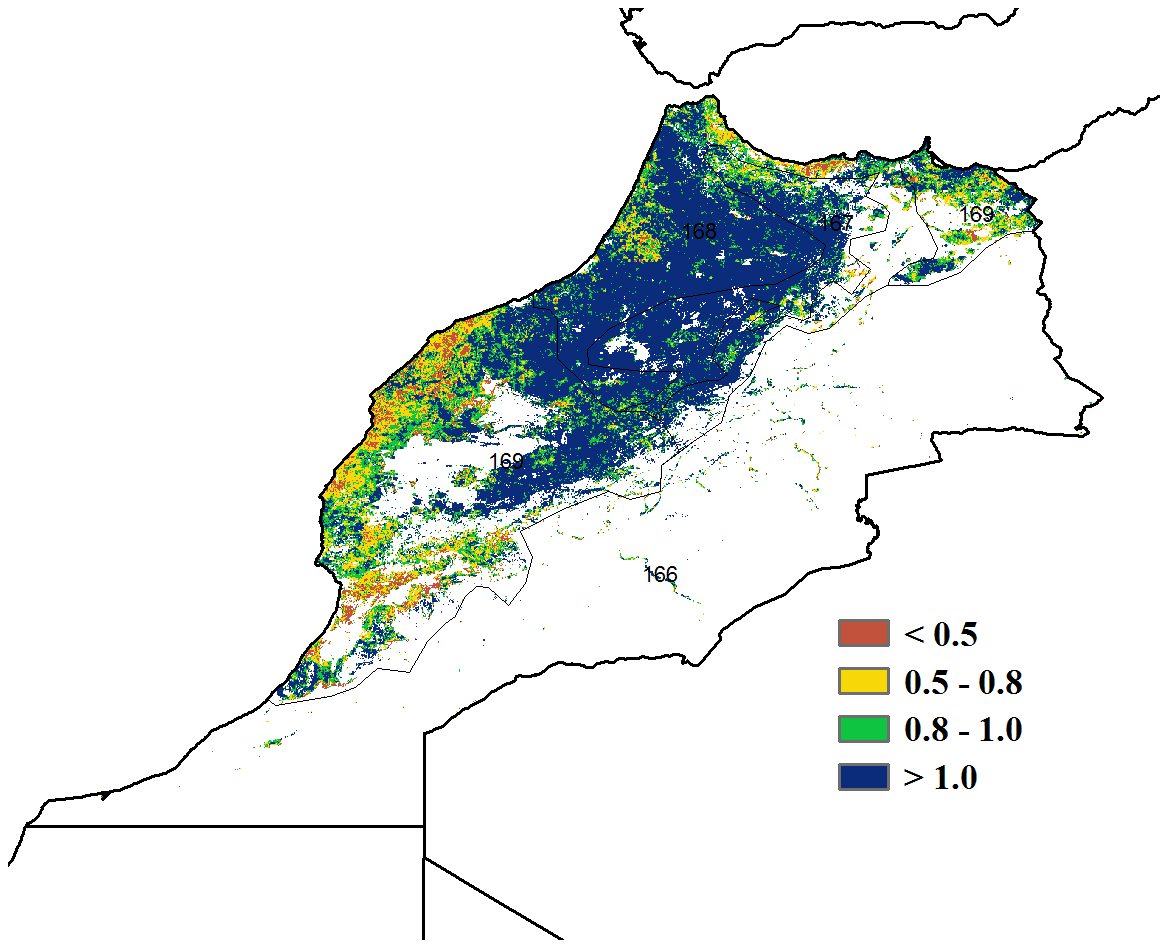
Over the monitoring period the average RAIN was 126mm, 60% above average, but both TEMP and RADPAR were below average (-0.9°C and -1%, respectively). The BIOMASS increased by 54% compared to the 5YA. The NDVI development graph shows above or close to 5-year maximum crop condition. Nationwide VCIx was very high (1.2) and the map of VCIx showed that only the coastal areas had low (< 0.5) to moderate (0.5-0.8) VCIx value (north coast of Tanger-Tetouan-Al Hoceima and Oriental regions, and the west coast of Guelmim-Oued Noun and Laâyoune-Sakia El Hamra regions) . In addition, CALF increased by 70% compared to last five-year average.
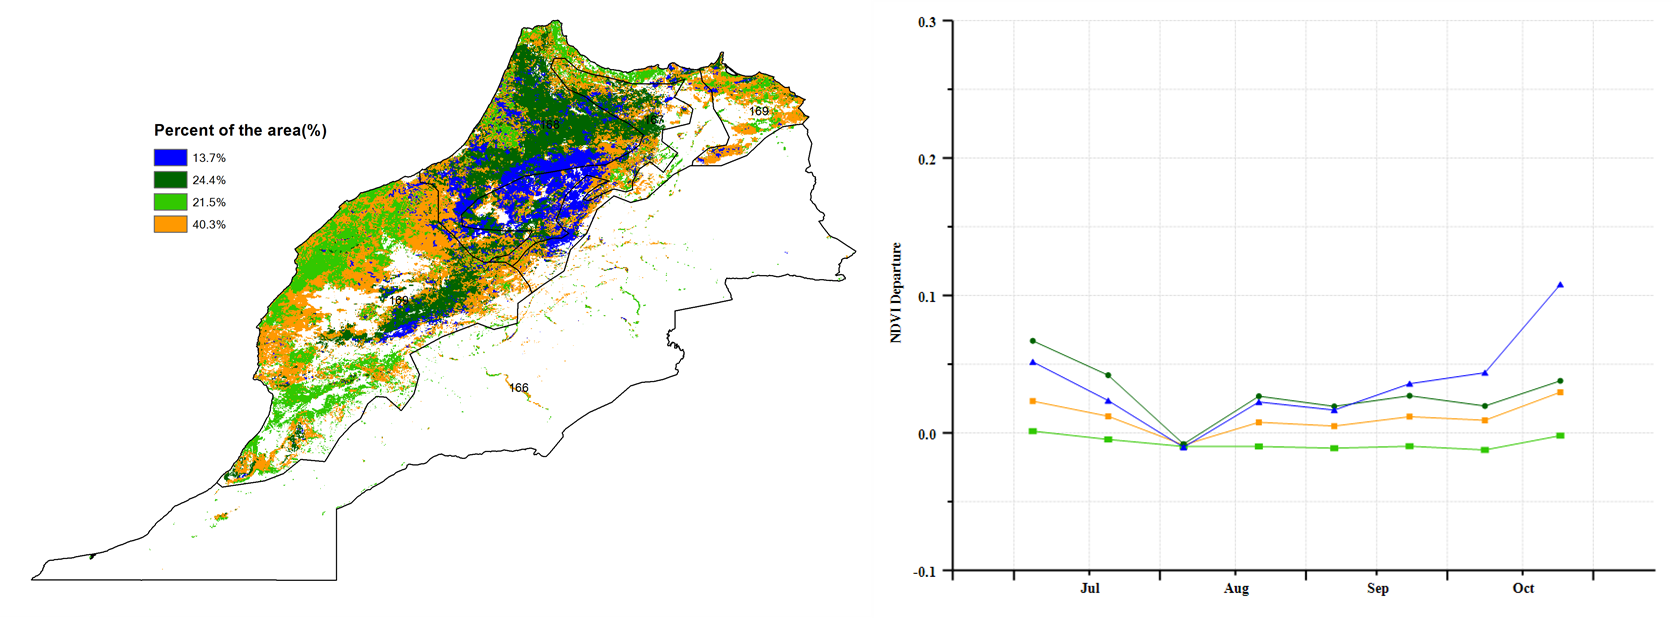
The spatial NDVI patterns map agrees with the NDVI-based crop condition graph as far as above average conditions during the monitoring periods are concerned, especially in Drâa-Tafilalet, Béni Mellal-Khénifra, Fès-Meknès, Rabat-Salé-Kénitra, and Marrakesh-Safi regions.
CropWatch estimates put 2017-2018 wheat production 0.8% below the n2016-17 production. Current prospects for the 2018-19 season are very promising.
Regional analysis
CropWatch adopts three agro-ecological zones (AEZs) relevant for crop production in Morocco, referred to as Warm semi-arid, the Warm sub-humid, and the Cool sub-humid.
For the three AEZs, the average rainfall (RAIN) was above average (by 55, 70, and 51% respectively). The increase in the rainfall was associated with an increase in the BIOMSS of 69%, 51% and 41% above the 5-year average, respectively. The average temperature (TEMP) was below the average (-0.7°C, -0.8°C, and -0.7 °C, respectively). RADPAR was below average as well, by 0.7%, 1.6% and 2.5%, respectively. The maximum VCI was high (1.0) for Warm semi-arid zones and very high (1.4) for both Warm sub-humid zones and Cool sub-humid zones, indicating very favorable crops condition for all regions.
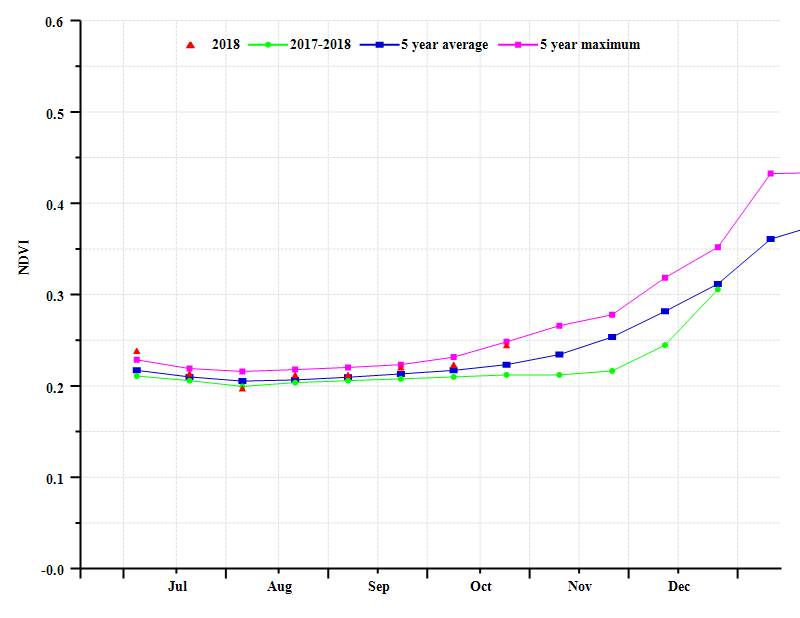
The Crop conditions NDVI-based graphs for the three regions indicating above 5-year average conditions for Warm semi-arid zones and close to 5-years maximum conditions for Warm sub-humid zones and Cool sub-humid zones.

(a). Phenology of major crops
(b) Crop condition development graph based on NDVI (c) Maximum VCI
(d) Spatial NDVI patterns compared to 5YA (e) NDVI profiles
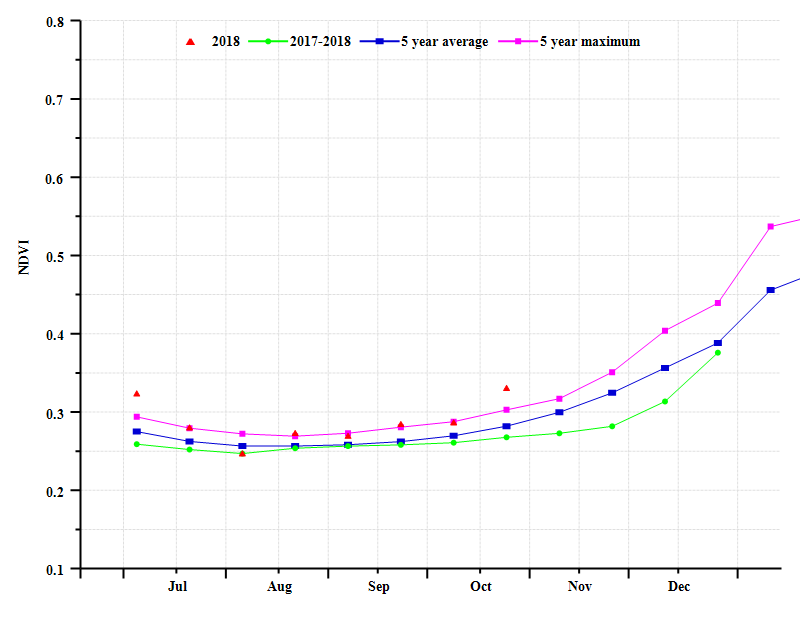
(f) Crop condition development graph based on NDVI (Warm semiarid zones (left) and Warm subhumid zones (right)).

(g) Crop condition development graph based on NDVI for Cool subhumid zones.
Table 3.52. Morocco’s agro-climatic indicators by sub-national regions, current season's values and departure from 15YA, July-October 2018.
| RAIN | TEMP | RADPAR | ||||
| Region | Current(mm) | Departure from 15YA (%) | Current(°C) | Departure from15YA (°C) | Current (MJ/m2) | Departure from 15YA (%) |
| Warm semiarid zones | 97 | 55 | 21.5 | -0.7 | 1360 | -0.7 |
| Warm subhumid zones | 148 | 70 | 22.8 | -0.8 | 1336 | -1.6 |
| Cool subhumid zones | 143 | 51 | 21.2 | -0.7 | 1321 | -2.5 |
Table 3.53. Morocco’s agronomic indicators by sub-national regions, current season's values and departure from 5YA, July-October 2018.
| BIOMSS | CALF | Maximum VCI | |||
| Region | Current (gDM/m2) | Departure from 5YA (%) | Current (%) | Departure from 5YA (%) | Current |
| Warm semiarid zones | 482 | 69 | 3 | 0.0 | 1.0 |
| Warm subhumid zones | 585 | 51 | 18 | 0.0 | 1.4 |
| Cool subhumid zones | 638 | 41 | 23 | 0.0 | 1.4 |
Table 3.54. CropWatch-estimated maize, rice, and wheat production for Morocco in 2018 (thousand tons).
| Production 2017 | Yield variation | Area variation | Production 2018 | Production variation | |
| Wheat | 7100 | 2.8% | -3.5% | 7043 | -0.8% |